Bitcoin Hits $40,000, It Will Recover —Name Your AltcoinSorry, there is a typo there on the title, I meant to say: Bitcoin hits $114,000, soon to recover.
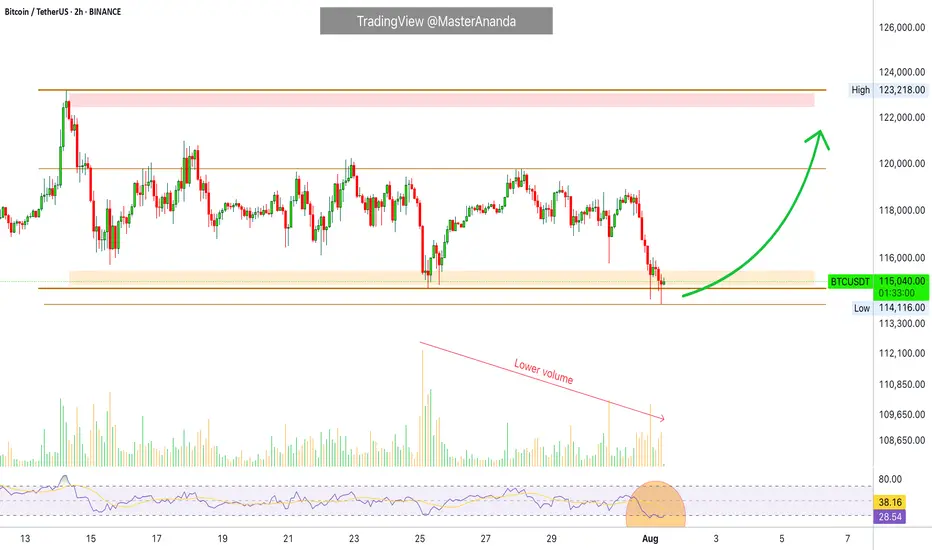
As you can see from our trading range, Bitcoin just went beyond the lower boundary and hit a new low, the lowest since 10-July but there is good news. There isn't room for prices to move much lower, this is part of the consolidation phase.
The first low happened 25-July and notice the high (bear) volume. The second low happens today and we have lower volume compared to 25-July, but Bitcoin hit a lower low. This reveals that the bearish move is already weak and losing force. It also reveals the fact that Bitcoin is about to recover.
Also notice the RSI, 2H. It hit oversold recently and went the lowest in a long while. Reversals tend to happen when the RSI becomes oversold.
Bitcoin is testing the lower boundary of the trading range, when this happens, the action reverses and moves back up. Prepare to see Bitcoin back above $120,000. It is normal and it will happen... But it is wise to give the market a few days. 5-August was bad last year. It gets bad but it also marks the bottom. Once the bottom is hit, growth long-term.
— Name Your Altcoin
Leave a comment with the altcoins you are holding now and I will do an analysis for you. The altcoins will also recover and we are witnessing just a small retrace. Hold strong as this is the most important part. We will have a very strong new bullish wave develop within days.
As Bitcoin moves to test support, it will reverse to test resistance next. Which one is your top altcoins choice?
Thank you for reading.
Namaste.
Community ideas
BTCUSDTHello Traders! 👋
What are your thoughts on BITCOIN?
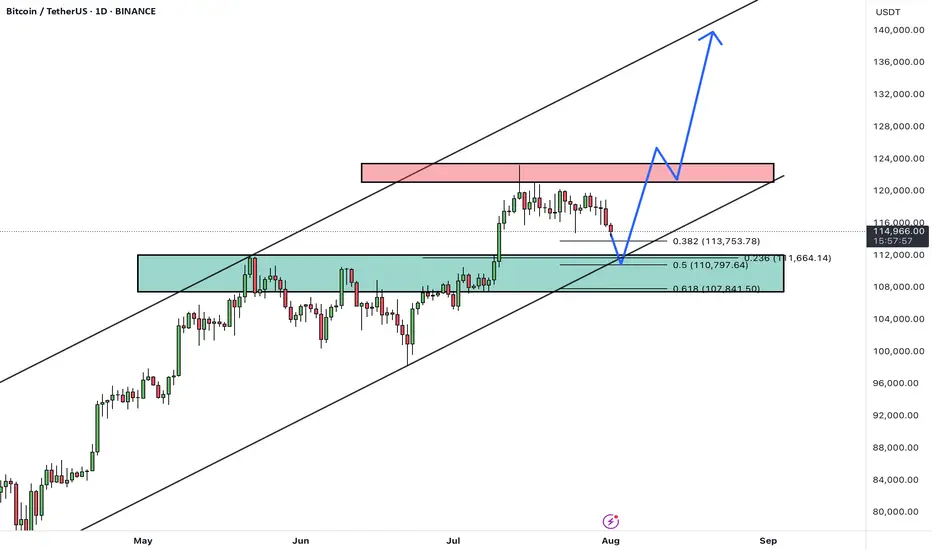
After a strong rally, BTC is currently pulling back from the 124K resistance area, heading toward a major confluence support zone between 108,000– 110,000, which aligns with:
✅ Previous breakout zone
✅ 0.5–0.618 Fibonacci retracement
✅ Lower bound of the ascending channel
This level is expected to attract buyers and act as a base for a new bullish leg.
Scenario Ahead (Main Bias):
1. Price dips into the 108–110K support
2. Bullish reversal from the zone (watch for strong reaction candles or bullish divergence)
3. Target 1: 124K (retest resistance)
4. Target 2: 135K–140K (upper channel boundary upon breakout)
BTC remains in a healthy bullish structure. Current pullback is considered constructive, and the 107–110K zone offers a high-probability long setup. Watch for bullish signals before entering.
A confirmed daily close below 107K would invalidate this bullish structure and expose BTC to deeper correction levels.
What’s your take on this setup? Do you expect a bounce from support or a deeper correction? Share your thoughts below 👇
Don’t forget to like and share your thoughts in the comments! ❤️
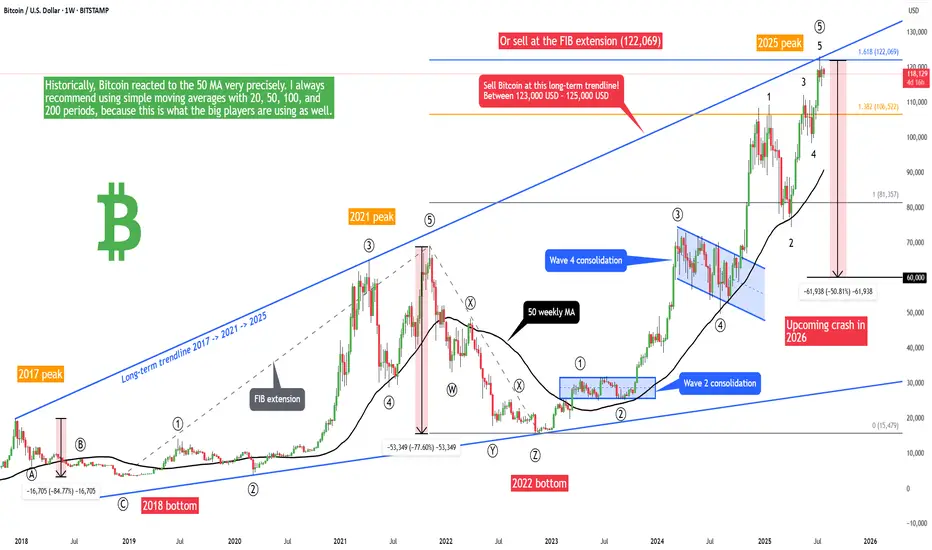
Bitcoin - 50% crash is starting! (2017 trendline, huge warning)Bitcoin is in the final stage of the bullish cycle, and we want to look for the best price to sell and prepare for the 2025/2026 bear market! The best price to sell Bitcoin is at the 1.618 FIB extension or at the main long-term 2017-2021-2025 trendline. This is exactly at 122,069, as we can see on the chart. And 2 weeks ago, Bitcoin hit both the Fibonacci level and trendline! So this is a strong sell signal.
Buying Bitcoin at the tipity top of a bullish cycle is not the best idea, because we will see 60,000 USD per Bitcoin in 2026! From the Elliott Wave perspective, there is probably only 1 high-probability scenario, and it's this ending diagonal pattern (rising wedge). I think we will see a final 2 waves on Bitcoin to form an ending diagonal wedge pattern (1-2-3-4-5). Bitcoin just finished wave 5 and is starting a brand new corrective pattern.
But you can be more conservative and wait for more confirmations, such as a break of the 50-week moving average. Waiting for such confirmations in general gives us a higher chance of success but a lower risk-to-reward ratio; in other words, you can't catch the top. I always recommend using simple moving averages with 20, 50, 100, and 200 periods because this is what the big players are using as well. These MAs are very popular among giant institutions, banks, and investors.
What's more, Bitcoin seasonality is telling us that August and September are the most bearish months for Bitcoin statistically. So you probably want to sell before a sell-off kicks in.
Write a comment with your altcoin + hit the like button, and I will make an analysis for you in response. Trading is not hard if you have a good coach! This is not a trade setup, as there is no stop-loss or profit target. I share my trades privately. Thank you, and I wish you successful trades!
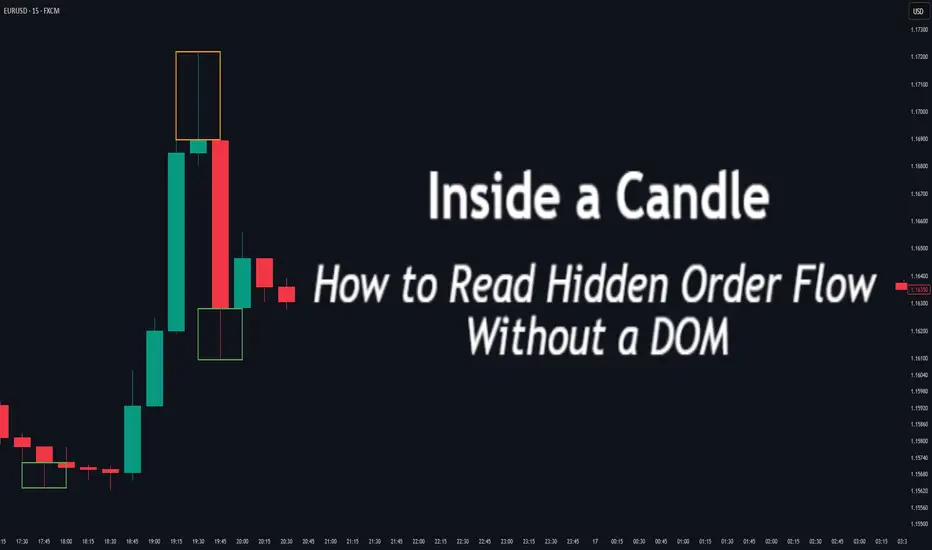
Inside a Candle: How to Read Hidden Order Flow Without a DOM
Difficulty: 🐳🐳🐳🐋🐋 (Intermediate+)
This article is for traders who want to understand the “story” behind a candle’s shape — and learn to spot aggressive buying/selling, absorption, and traps without needing footprint or order book tools.
🔵 INTRODUCTION
Most traders see candles as static shapes — green or red, big or small. But each candle is a battlefield of orders . Even without access to a DOM or volume footprint, you can still extract valuable information from just the candle's body, wick, and context .
🔵 ORIGINS: WHERE CANDLESTICKS COME FROM
Candlestick charts trace back to 18th-century Japan, where rice traders needed a way to visualize price movements over time. A legendary trader named Munehisa Homma , who traded rice futures in Osaka, is credited with developing the earliest form of candlestick analysis.
Homma discovered that price wasn’t just driven by supply and demand — but also by trader psychology . He created visual representations of market sentiment by tracking:
The opening and closing price of rice
The highest and lowest price reached during the session
This system became known as the “Sakata rules,” and it laid the foundation for many patterns still used today — such as Doji, Engulfing, and Marubozu.
Western traders only began using candlesticks widely in the 1990s, when analyst Steve Nison introduced them to the broader financial world through his book Japanese Candlestick Charting Techniques.
Today, candlesticks remain one of the most powerful and intuitive ways to visualize order flow, momentum, and market psychology — even without a Depth of Market (DOM) or depth of book.
In this article, you’ll learn how to read hidden order flow by analyzing:
Wick length and positioning
Body-to-range ratios
Candle clustering and sequences
🔵 HOW A CANDLE FORMS
Before you can read a candle, you need to understand how it comes to life . A single candle represents the full auction process during its time window.
Here’s how it builds, step by step:
Candle opens — this is the open price .
As price moves up during the session → the high] updates.
As price moves down → the low] updates.
The final traded price when the time closes → this becomes the close price .
The wick = price areas that were tested but rejected
The body = where the majority of aggressive trades occurred
If buyers push price up quickly but sellers slam it down before the close — the candle will have a long upper wick and close near the open, revealing seller absorption.
Understanding this flow helps you recognize traps, fakeouts, and reversals in real time.
🔵 CANDLE BODY: WHO'S IN CONTROL
The body of the candle reflects the result of the battle between buyers and sellers. A wide body with minimal wicks means dominance and commitment.
Big body, small wick → clear conviction
In an uptrend: buyer aggression
In a downtrend: panic or aggressive selling
Small body, long wicks → indecision, absorption, or trap
Often appears near tops/bottoms
Indicates both sides were active but neither won clearly
tradingview.sweetlogin.com
🔵 WICKS: THE SHADOWS OF REJECTION
Wicks are not just “leftovers” — they show where price was rejected after being tested.
Long upper wick = seller presence or absorption at highs
Long lower wick = buyer defense or trap spring
Double wick = liquidity sweep / false breakout
Use wick direction to spot:
Failed breakouts
Smart money traps
Exhaustion candles
🔵 HIDDEN ORDER FLOW PATTERNS
1️⃣ Absorption Candle
A large wick with little movement afterward — shows that big orders absorbed market pressure.
2️⃣ Trap Candle
A candle that sweeps above/below a key high/low and closes opposite — classic smart money fakeout.
3️⃣ Imbalance Candle
Large-bodied candle that closes near the high/low with no wick on the other end — implies one-sided aggression (and often leaves an imbalance).
🔵 CLUSTERING & SEQUENCES MATTER
Never read a candle alone. The sequence of candles tells the full story:
3+ rejection wicks near resistance? Liquidity building before breakout or trap
Bearish engulfing after long upper wick = smart money selling into retail buying
Tight-range dojis + volume spike = compression before expansion
Context + volume + structure = hidden flow decoded.
🔵 PUTTING IT TOGETHER: A REAL EXAMPLE
Price breaks above previous high
Candle closes with long upper wick and smaller body
Next candle opens, dumps fast, leaving imbalance behind
Buyers trapped — move likely to continue down
This is how you read order flow from candle anatomy .
🔵 TIPS FOR MASTERY
Use a lower timeframe (1M–5M) to see microstructure
Watch how wicks behave near S/R or OBs
Confirm with volume spikes or delta-style indicators
Use replay mode to slow down the story and study cause/effect
🔵 CONCLUSION
Every candle is a message. You don’t need expensive tools to read order flow — just your eyes, context, and curiosity.
Learn to see candles not as symbols, but as evidence of behavior . Absorption, imbalance, and traps are all visible if you look closely.
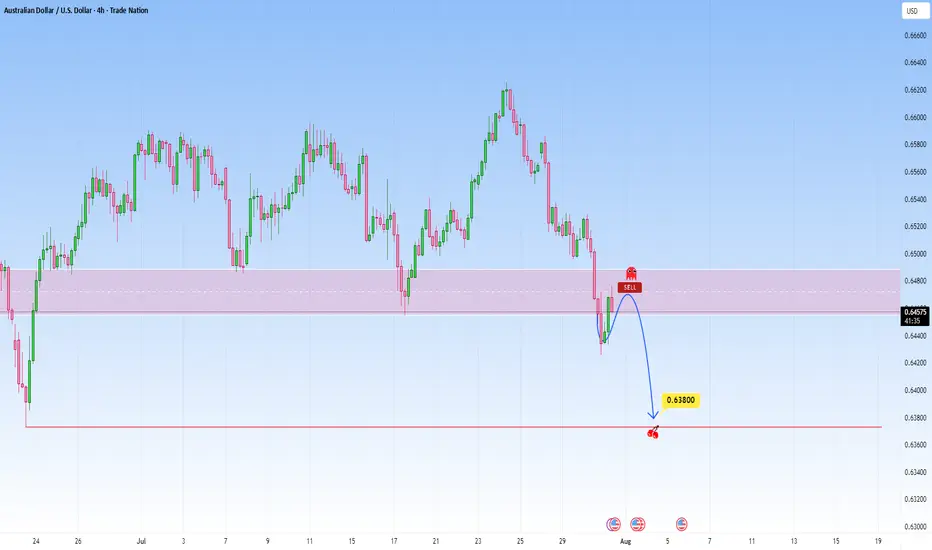
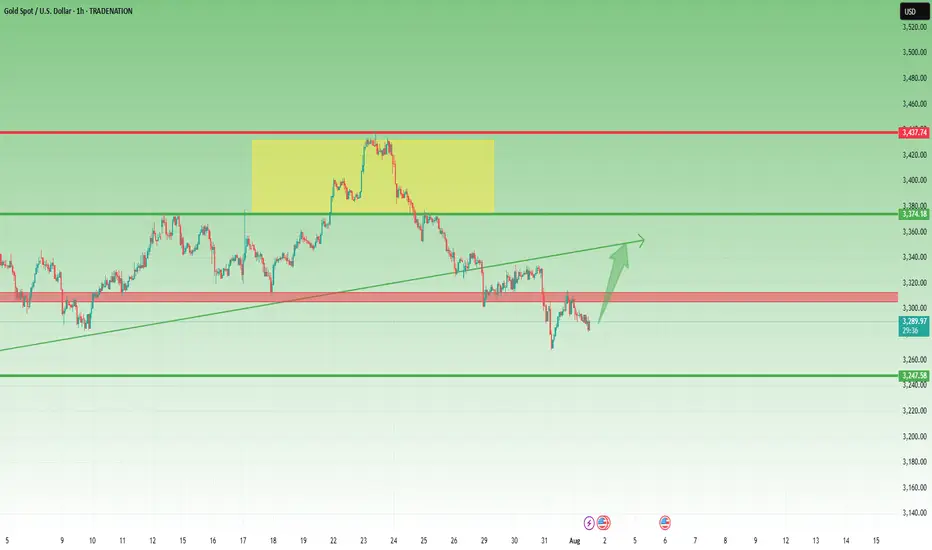
AUDUSD: Bearish Continuation from broken supportThe current setup is a clean example of a trend continuation play. Price recently broke decisively below a structure zone, this break and retest now flips the narrative, what once was a buy zone is now an opportunity for short entries.
Following the aggressive move down, price now began pulling back into that broken zone. The move appears corrective rather than impulsive, characterized by a slower, more rounded structure typical of pullback leg. This is classic behavior in continuation setups: fast drop, slow retrace, and then potential for the next leg lower.
The projected move targets a retest of the swing low at 0.63800. That level is significant, it's a level where prior demand reacted strongly and now it serves as the next probable magnet for price.
What makes this continuation trade high probability is the sharpness of the prior bearish impulse as it signals intent. The market seems to be in a controlled bearish sequence, where sellers dominate momentum and retracements offer fresh entries for trend followers.
The structure and zone alignment all point in the same direction continuation lower, not reversal.
Let me know in the comments what you think
Disclosure: I am part of Trade Nation's Influencer program and receive a monthly fee for using their TradingView charts in my analysis.
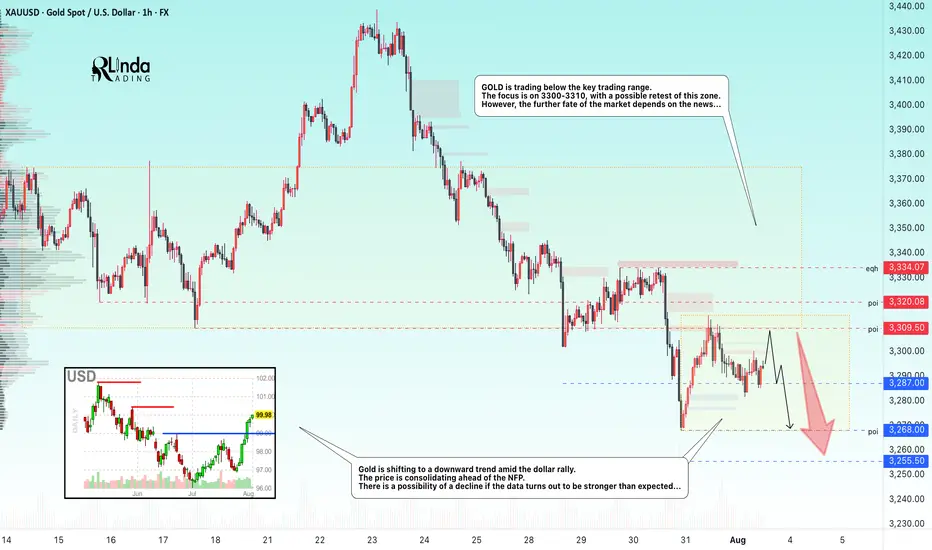
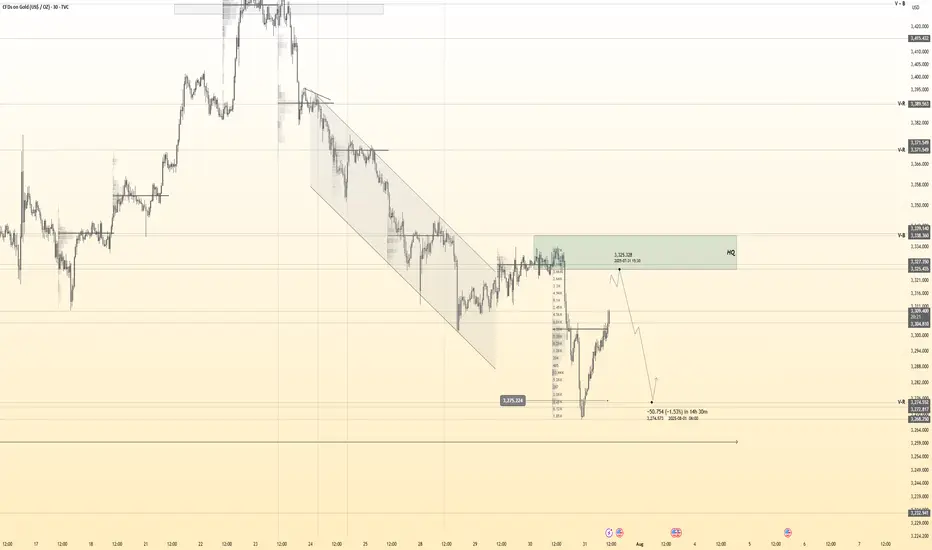
GOLD → The market is waiting for NFP. What could happen?FX:XAUUSD is bouncing off resistance at 3310, confirming the upper limit of the new trading range. The dollar continues to rally, but the market as a whole is stagnating ahead of upcoming news—NFP is coming up!
Gold is consolidating at monthly lows around $3268, awaiting key US labor market data (NFP). Trump's new tariffs (10% globally, 35% for Canada, 39% for Switzerland) have boosted demand for the dollar, putting pressure on gold. Markets are waiting for NFP: forecast +110K jobs, unemployment 4.2%. Weak data (<100K) → gold may rise to $3400. Strong (>150K) → the dollar will strengthen, gold will continue to fall. The probability of a Fed rate cut in September is <50%.
Based on yesterday's data, I would cautiously suggest that NFP will be in the range of 125K–145K, slightly above the consensus (110K). This will play into Trump's hands (I think you understand what I mean...).
Resistance levels: 3300, 3310, 3320
Support levels: 3287, 3268, 3255
The news has a negative nuance — unpredictability. Be careful.
Technically, based on the data we have at the moment, I would assume that the market may test resistance at 3300-3310 before a possible pullback to the specified support. BUT! Unpredictable data could turn the game around, and in that case, if the dollar falls, gold could start to rise.
Best regards, R. Linda!
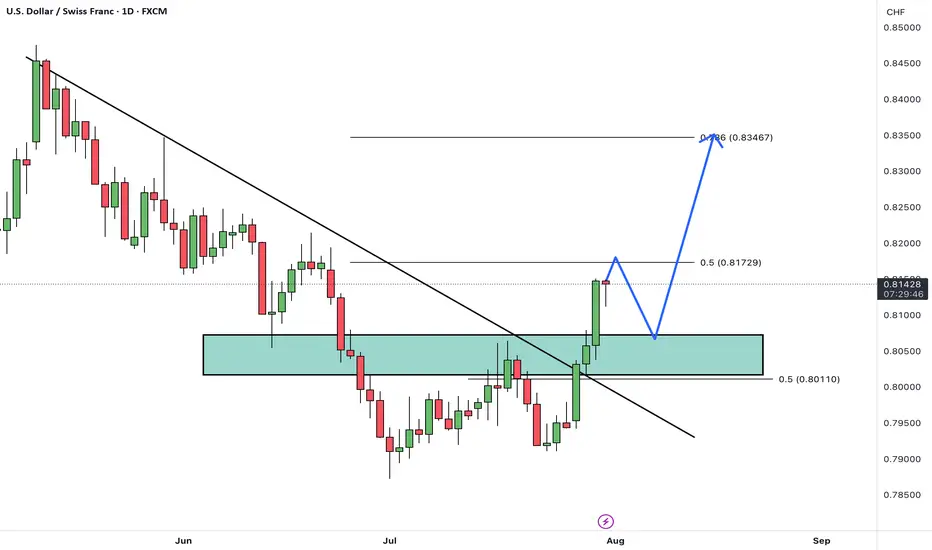
USDCHFHello Traders! 👋
What are your thoughts on USDCHF?
USD/CHF has broken above its descending trendline and cleared a resistance zone, signaling a potential trend reversal and growing bullish momentum.
After some minor consolidation and a pullback to the breakout zone, we expect the pair to continue its rally toward the next identified targets.
The broken resistance now acts as new support, and as long as price remains above this area, the bullish outlook remains valid.
Is USD/CHF ready to extend higher toward its next targets? Share your view below! 🤔👇
Don’t forget to like and share your thoughts in the comments! ❤️
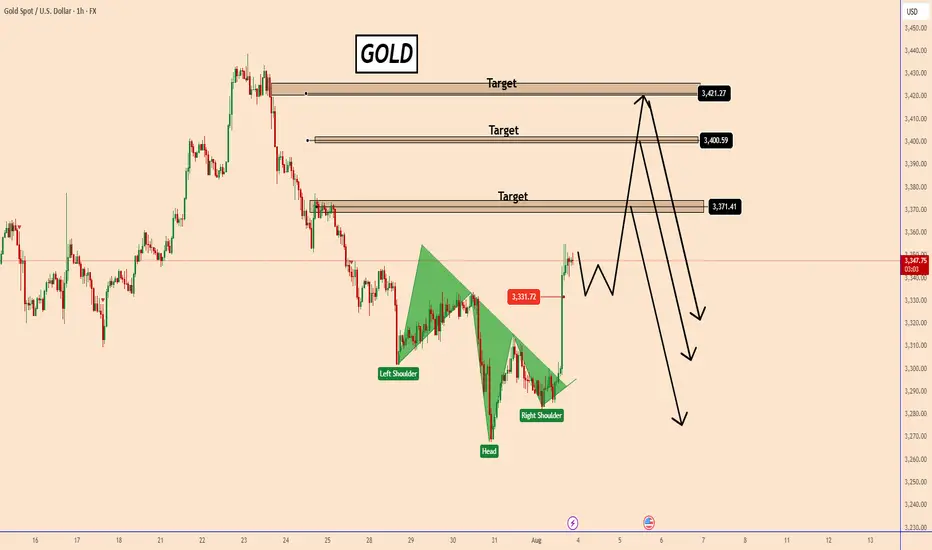
GOLD: Be careful, It's More Complex Than it SeemsGOLD: Be careful, It's More Complex Than it Seems
After the NFP data came in at 73k vs. the expected 110k, the market reacted aggressively to the US dollar. Today, the US dollar was affected on two fronts.
One was the NFP data and the other was the mess that President Trump is creating with his tariffs against many countries. Uncertainty regarding the future impact of the tariffs remains high and unknown.
After the NFP data GOLD reacted aggressively against the US dollar by breaking easily two small structural areas towards 3315 and 3334. A possible correction is expected before gold moves further to 3370; 3400 and 3400, as shown in the chart.
You may find more details in the chart!
Thank you and Good Luck!
PS: Please support with a like or comment if you find this analysis useful for your trading day
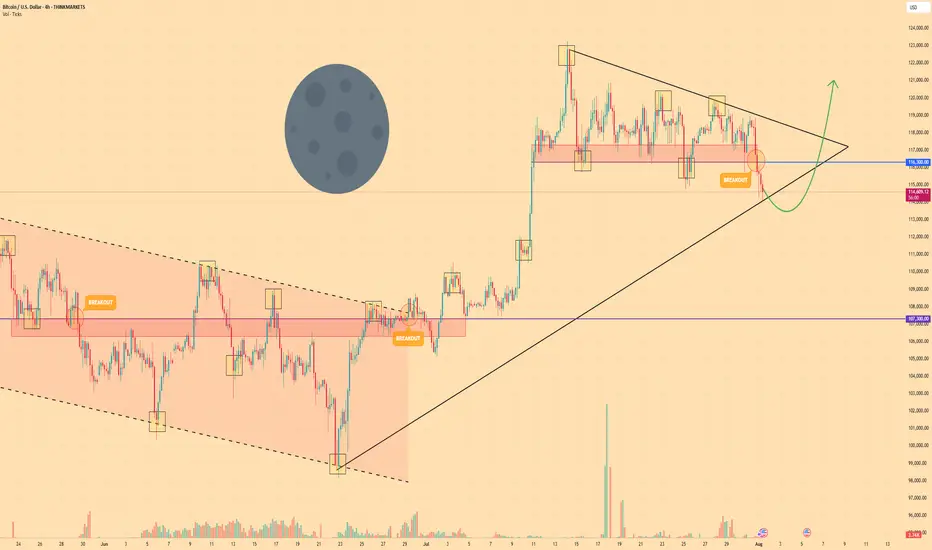
BITCOIN - Price can turn around and start to move upHi guys, this is my overview for BTCUSD, feel free to check it and write your feedback in comments👊
The price reversed its prior downtrend with a decisive breakout from a falling channel.
This breakout triggered a strong upward impulse, which then began to consolidate into a large symmetrical pennant.
However, the price recently failed to hold the lower support trendline of this pennant and broke to the downside.
The asset is currently trading just below this broken trendline, in what appears to be a liquidity grab.
To continue upwards, buyers must now overcome the immediate resistance located at the $116300 level.
I expect that this breakdown was a fakeout, and the price will soon reverse, break through the $116300 resistance, and continue its rally toward the $121000 target.
If this post is useful to you, you can support me with like/boost and advice in comments❤️
Disclaimer: As part of ThinkMarkets’ Influencer Program, I am sponsored to share and publish their charts in my analysis.
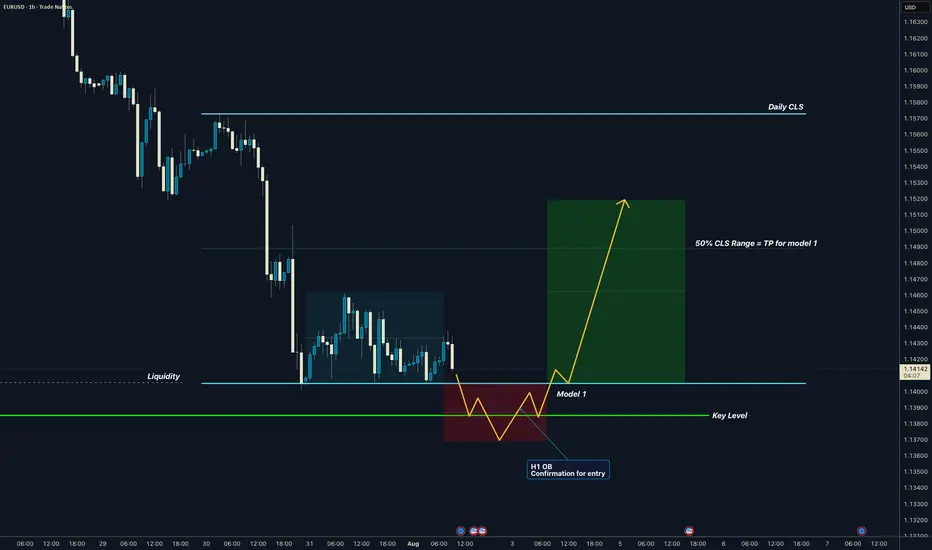
EURUSD I Daily CLS I Model 1 I KL - OB I TP 50% CLSYo Market Warriors ⚔️
Fresh outlook drop — if you’ve been riding with me, you already know:
🎯My system is 100% mechanical. No emotions. No trend lines. No subjective guessing. Just precision, structure, and sniper entries.
🧠 What’s CLS?
It’s the real smart money. The invisible hand behind $7T/day — banks, algos, central players.
📍Model 1:
HTF bias based on the daily and weekly candles closes,
Wait for CLS candle to be created and manipulated. Switch to correct LTF and spot CIOD. Enter and target 50% of the CLS candle.
For high probability include Dealing Ranges, Weekly Profiles and CLS Timing.
Analysis done on the Tradenation Charts
Disclosure: I am part of Trade Nation's Influencer program and receive a monthly fee for using their TradingView charts in my analysis.
Trading is like a sport. If you consistently practice you can learn it.
“Adapt what is useful. Reject whats useless and add whats is specifically yours.”
David Perk aka Dave FX Hunter
💬 Don't hesitate to ask any questions or share your opinions
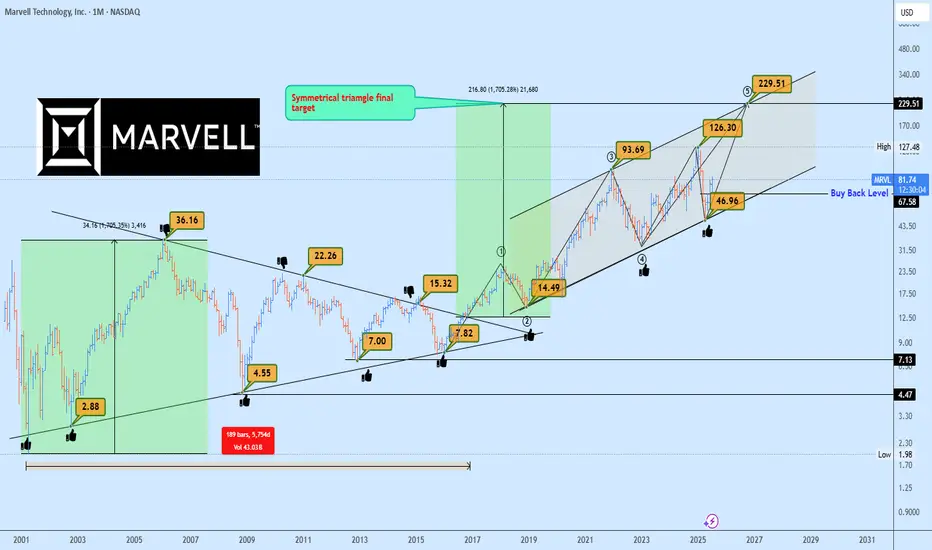
MRVL Massive 15-Years Symmetrical Breakout Targets AheadMarvell Technology (MRVL) has just completed a monumental breakout from a 15-years symmetrical triangle, a rare and powerful long-term accumulation structure. This type of macro consolidation typically precedes a major directional expansion, and in this case, the breakout confirmed bullish continuation.
Currently, MRVL is forming a rising channel structure, with price bouncing cleanly from the lower boundary confirming demand and the continuation phase of the macro move.
The 1:1 projection from the symmetrical triangle gives us a clear target trajectory, with the final leg potentially extending to $229, aligning perfectly with the upper boundary of the rising channel.
In the short to mid-term, the ideal buyback opportunity rests near $67.50, should the market retest previous breakout support or the lower boundary of the channel once more. This zone offers asymmetric risk-to-reward potential for long-term investors and swing traders alike.
Key Targets
📈 $67.50 – Buyback Opportunity Zone
📈 $229 – Rising Channel Top / 1:1 Expansion Target
A breakout this large is no coincidence, it’s backed by years of price compression and institutional positioning. Now is the time to watch closely.
📩 Drop your view in the comments and share your stock requests for quick analysis.
Only stock assets will be accepted under this post.
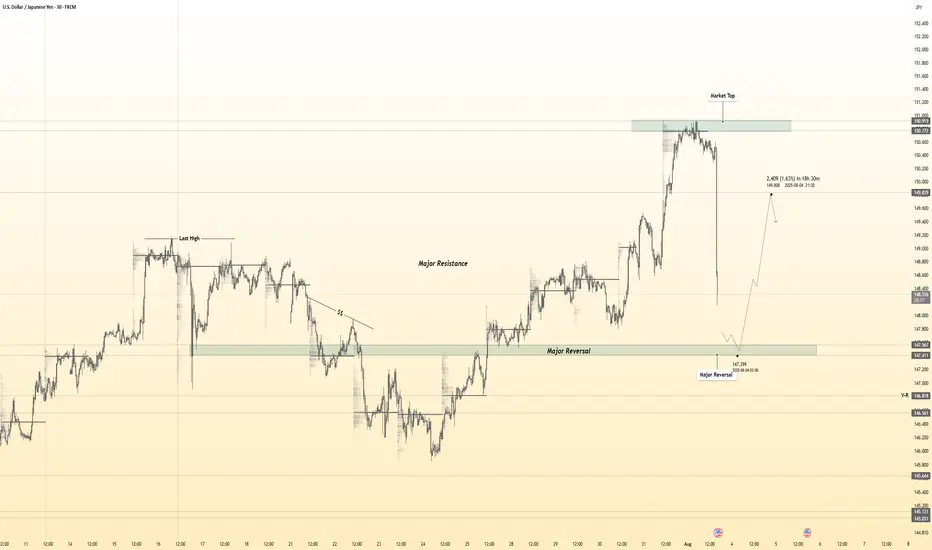
USDJPY 30Min Engaged (Bullish Reversal Entry Detected )➕ Objective: Precision Volume Execution
Time Frame: 30-Minute Warfare
Entry Protocol: Only after volume-verified breakout
🩸 Bullish Reversal : 147.450
➗ Hanzo Protocol: Volume-Tiered Entry Authority
➕ Zone Activated: Dynamic market pressure detected.
The level isn’t just price — it’s a memory of where they moved size.
Volume is rising beneath the surface — not noise, but preparation.
🔥 Tactical Note:
We wait for the energy signature — when volume betrays intention.
The trap gets set. The weak follow. We execute.
BTC HUGE DROP TO 113,400$ - BIG CRASH !*Sorry for posting to late as I am between a trip in Malaysia.*
Details:
Entry: Now - 117,000 $
Target Price: 113,410 $
Stop loss: 119,460 $
Trade Ideas:
Market creating a flag pattern here. Though its not only the logic we have some secret logics here and indicators which I shared in the VIP.
What is required to Join VIP?
- Nothing just you have to share 10% of your profit with us at the end of the month which you earned from our signals. Yeah this is just the requirement, trade where ever you like your favorite broker or else you don't need to pay fees first or create account thru our link.
Trade Signal:
I provide trade signals here so follow my account and you can check my previous analysis regarding BITCOIN. So don't miss trade opportunity so follow must.
BINANCE:BTCUSDT BINANCE:BTCUSDT.P BINANCE:BTCUSD

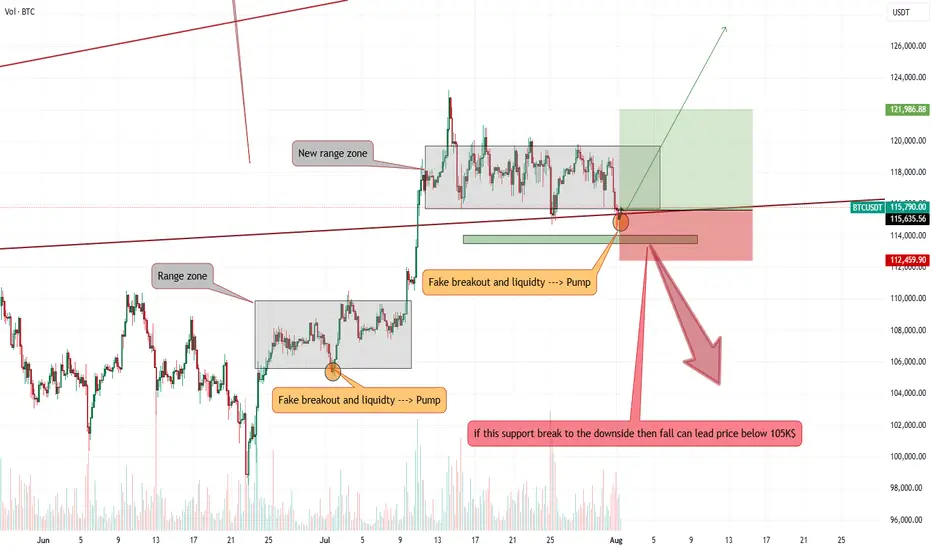
Bitcoin stop loss hunting end, entry for Long is now!!Hi on this chart that may happen with more than 70% possibility we have one of the easy setups and strategy which i call it FAKEOUT&LIQUIDTY this happen usually near trendline support or range zone support or even resistance and after a possible fakeout usually market kick sellers or Buyers and then with high volume market reverse.
I saw High volume and Fake breakout in my mind and i think it can be one of those times so we open long and lets now wait for this 1:2(Risk:Reward) signal to play.
DISCLAIMER: ((trade based on your own decision))
<<press like👍 if you enjoy💚
ADA | Full AnalysisHere is the top-down analysis for CRYPTOCAP:ADA as requested 🫡
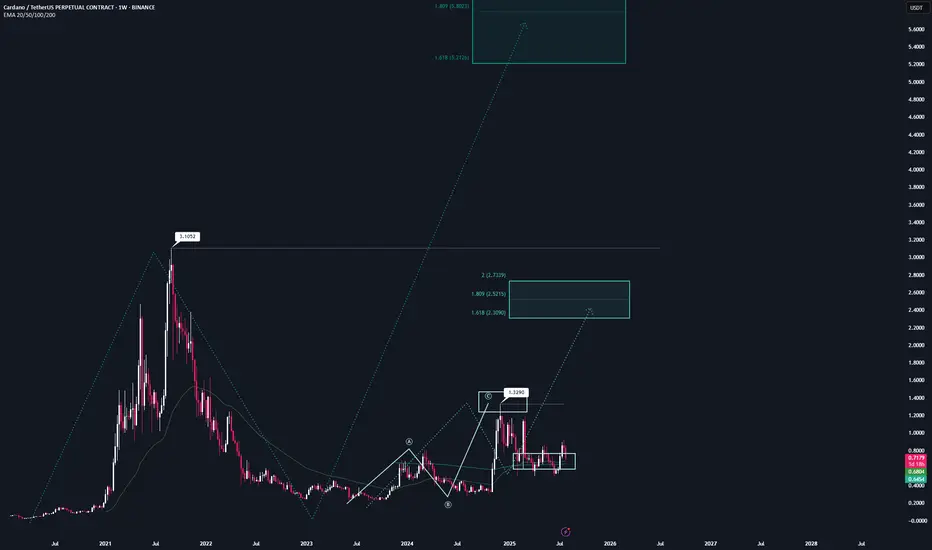
Weekly Timeframe:
We have one large potential sequence on the weekly chart that will be activated once we break the ATH at $3.1, with a target zone around $5.2. This is also my conservative target for this bull run, assuming we get the “altseason” everyone is hoping for.
We’ve also already completed a smaller sequence on the weekly chart and then corrected into the overall correction level.
If we break the November high at $1.3, we will also activate a new structure that could take us close to the ATH.
Daily Chart:
On the daily chart, we were rejected at the bearish reversal area (green) and corrected down into the B–C correction level, followed by a continuation into the target zone.
According to the rulebook, I expect a bounce from these regions and have positioned myself accordingly with 4 long orders — one at each level.
Local price action:
On the 4H chart, we have a bearish sequence that is counter to the primary scenario. Statistically, it’s less likely to play out, but it’s still worth noting.
The bearish reversal area (blue) is the next key level to watch if we get a bounce here.
If this area is broken, the follow-up move becomes very likely.
-----
Thats the my full Analysis for CRYPTOCAP:ADA , hope it was helpful if you want me to do another analysis for any other pair just comment down below.
Also, if anyone is interested in how my trading system works, let me know and I’ll post some educational content about it.
Thanks for reading❤️
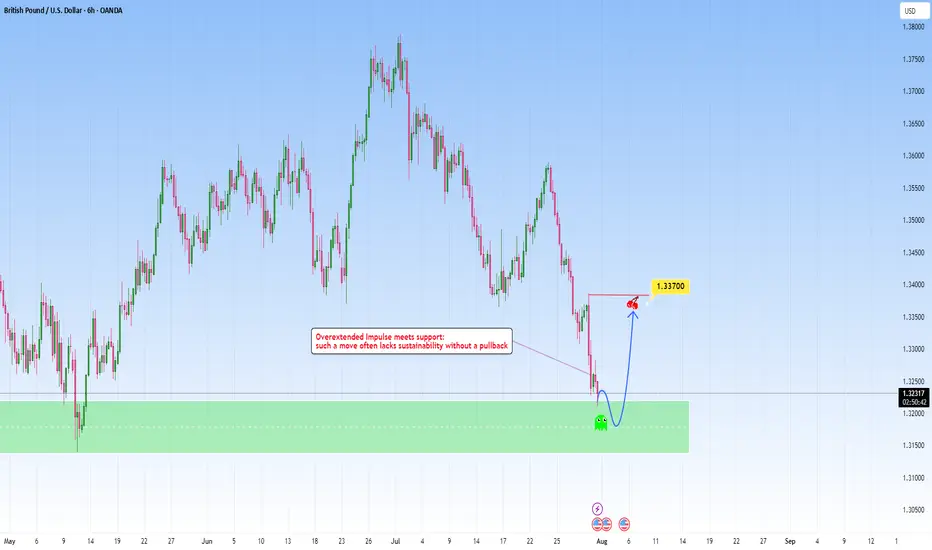
GBPUSD: Overextended move meets with supportAfter a steep and aggressive sell-off, price has tapped into a clear zone. This recent move wasn't gradual: it was impulsive and sharp, which tells us one key thing: exhaustion is likely.
The overextension into it without any meaningful pullback typically highlights imbalance, where price moves ahead of structure and becomes vulnerable to correction. But price doesn’t move in straight lines forever. Markets that fall too quickly tend to burn out just as fast. When such aggressive pushes meet with a clean, resistance like this one, they often trigger the exact opposite, a snapback correction.
I am now watching for signs of absorption and accumulation. This could play out in the form of sideways candles, wick rejections, or a sudden reversal spike. These are early signs that smart money might be stepping in.
My projected target would be toward the 1.33700 area, from the last impulsive drop. It’s a classic mean reversion setup, not just technical but psychological. Traders who chased the move late may find themselves trapped, fueling the correction as they’re forced to exit.
Gold Rejected at 3315 – But Bulls Might Not Be Done Yet📌 What happened yesterday?
During the Asian session, Gold printed a fresh local low at 3268, continuing the downtrend that already dropped over 1700 pips in just one week. However, that move quickly reversed, and we saw a natural corrective bounce.
📈 Resistance holds firm
The correction took price back up into the 3310 zone, which acted as confluence resistance. After two taps into that area, price failed to sustain above 3300, indicating sellers are still active there.
❓ Is the upside correction over?
I don't think so. The recent drop has been choppy, lacking the strong momentum of previous legs. This type of price action often signals that we are still within a correction, not in a clean continuation.
📊 What am I watching?
I’m actively monitoring for:
• Exhaustion signs on the downside
• Upside reversal signals
My plan is to open long trades only when I see confirmation, aiming for a move back toward the 3330 zone, which could act as resistance.
Disclosure: I am part of TradeNation's Influencer program and receive a monthly fee for using their TradingView charts in my analyses and educational articles.
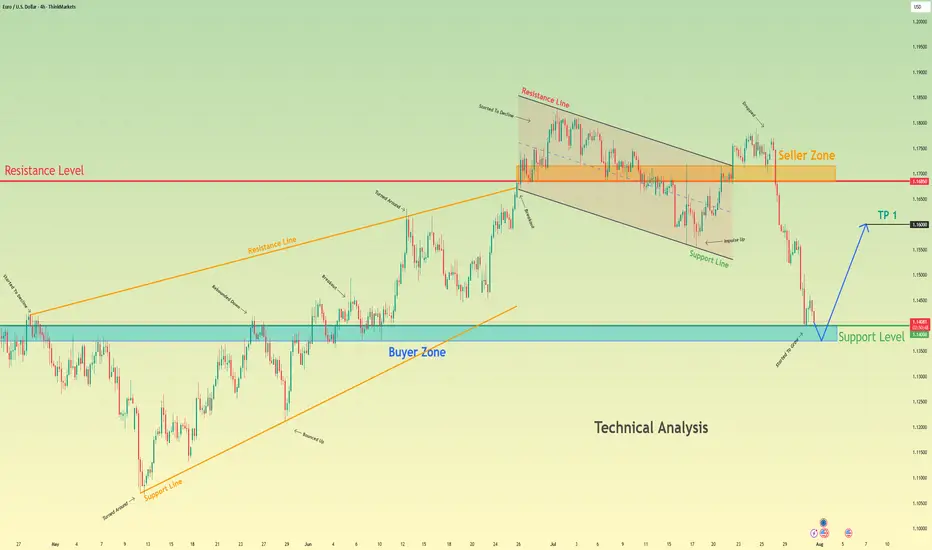
Euro bounce from buyer zone and start to move upHello traders, I want share with you my opinion about Euro. After a prolonged upward trend which formed a large rising wedge, the EURUSD faced a significant rejection from the seller zone near the 1.1685 resistance level. This failure to continue higher marked a key turning point, exhausting the bullish momentum and initiating a new bearish market phase. This new phase has since taken the form of a well-defined downward channel, within which the price has been undergoing a series of downward corrections and impulses. The most recent market action has been a sharp downward fall, accelerating the price's descent towards a critical area of historical significance. Currently, the pair is approaching the major support level at 1.1400, which also constitutes a strong buyer zone where demand has previously stepped in. The primary working hypothesis is a long, counter-trend scenario, which anticipates that the current bearish momentum will be absorbed by the strong demand within this buyer zone. A confirmed and strong rebound from this 1.1400 support area would signal a potential temporary bottom and the start of a significant upward correction. Therefore, the tp for this rebound is logically set at the 1.1600 level, a key psychological and technical point that represents a realistic first objective for a bounce of this nature. Please share this idea with your friends and click Boost 🚀
Disclaimer: As part of ThinkMarkets’ Influencer Program, I am sponsored to share and publish their charts in my analysis.
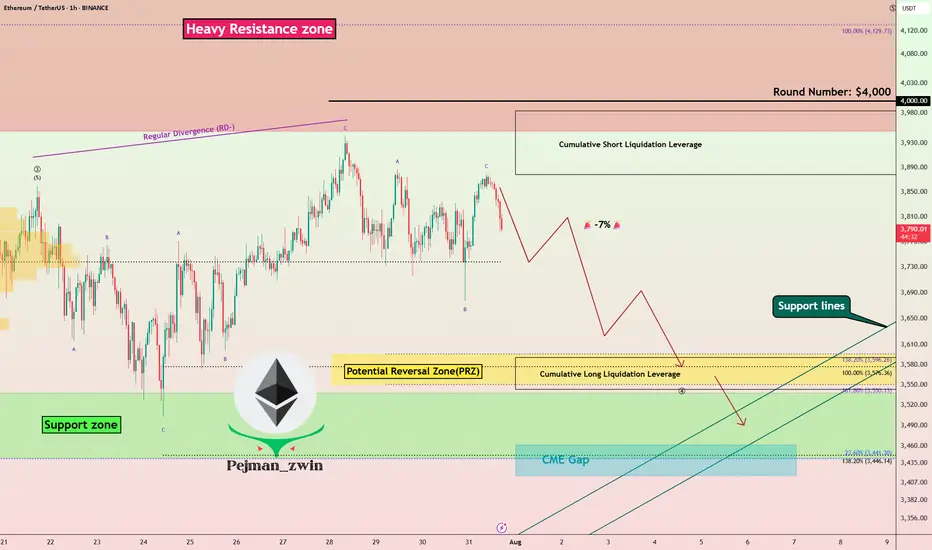
ETH at Critical Resistance + Liquidation Zone | Time to Short?Today I want to analyze Ethereum ( BINANCE:ETHUSDT ) on the 1-hour time frame . Is there a short position opportunity?
Please stay with me.
Ethereum is currently trading near a Heavy Resistance zone($4,390-$3,950) , Cumulative Short Liquidation Leverage($3,983-$3,878) and the $4,000 ( round number ). $4,000 could be a psychological number to sell .
In terms of Elliott Wave theory , Ethereum appears to have completed the main wave 3 at $3,860 and is currently completing the main wave 4 . The main wave 4 could have a Double Three Correction(WXY) or Expanding Flat(ABC/3-3-5) , with the Expanding Flat structure being more likely .
One of the reasons why shorting Ethereum could be better than shorting Bitcoin right now is that ETHBTC ( BINANCE:ETHBTC ) is currently trading above the ascending channel and is likely to correct to Fibonacci levels .
Also, we can see the Regular Divergence(RD-) between Consecutive Peaks.
I expect Ethereum to drop to at least the Potential Reversal Zone(PRZ) and attack the Support lines ( Second target ) .
Cumulative Long Liquidation Leverage: $3,591-$3,543
CME Gap: $3,461-$3,417
Note: Stop Loss: $4,023
Please respect each other's ideas and express them politely if you agree or disagree.
Ethereum Analyze (ETHUSDT), 1-hour time frame.
Be sure to follow the updated ideas.
Do not forget to put a Stop loss for your positions (For every position you want to open).
Please follow your strategy and updates; this is just my Idea, and I will gladly see your ideas in this post.
Please do not forget the ✅' like '✅ button 🙏😊 & Share it with your friends; thanks, and Trade safe.
Gold 30Min Engaged ( Bearish Reversal Entry Detected )Time Frame: 30-Minute Warfare
Entry Protocol: Only after volume-verified breakout
🩸Bearish Reversal - 3325
➗ Hanzo Protocol: Volume-Tiered Entry Authority
➕ Zone Activated: Dynamic market pressure detected.
The level isn’t just price — it’s a memory of where they moved size.
Volume is rising beneath the surface — not noise, but preparation.
🔥 Tactical Note:
We wait for the energy signature — when volume betrays intention.
The trap gets set. The weak follow. We execute.
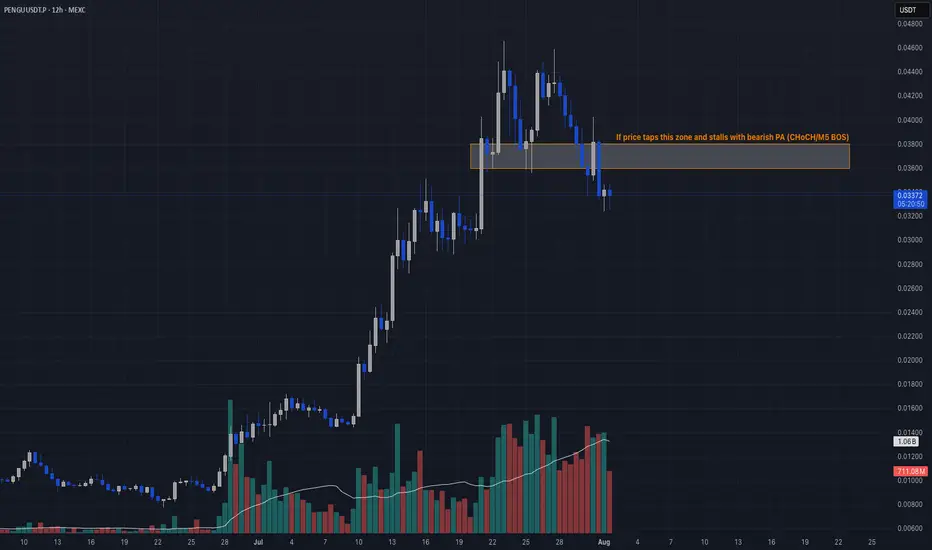
Insider Selloff + Liquidity Sweep🔻 PENGU/USDT TRADE IDEA 🔻
📣 Hey CandleCraft crew!
Today we’re diving into a chilly little bird that flew a bit too close to the heat. 🐧 PENGU pumped hard — but when team wallets start dumping $17M worth of tokens, that’s not bullish, that’s suspicious. Think iceberg ahead.
🔥 TRADE SETUP
Bias: Short
Strategy: Insider Selloff + Liquidity Sweep
Entry: $0.036 – $0.038
SL: $0.041
TPs: $0.030, $0.025, $0.018
Why?
– HTF sweep of liquidity above $0.04
– Insider wallet moved 485M tokens to exchanges
– LTF CHoCH + RSI breakdown
– Price hovering under 20-day EMA with weakening volume.
Candle Craft | Signal. Structure. Execution.
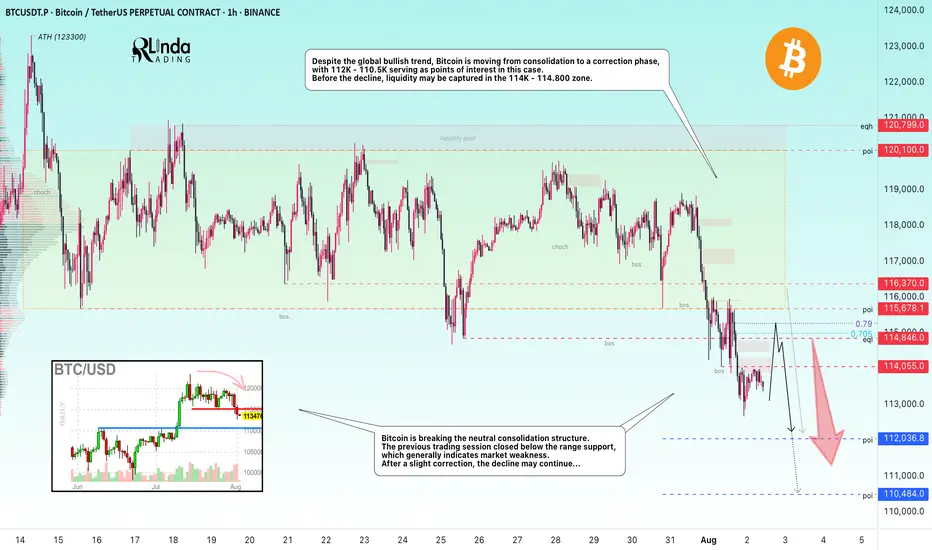
BITCOIN → From consolidation to distribution. Market weaknessBINANCE:BTCUSDT.P is moving from consolidation to a correction phase. The price broke through the support zone of 114.5–115.5, closing within the Friday trading session in the sell zone...
Previous idea from July 22: BITCOIN → Consolidation and compression to 116K. Correction?
The fundamental background is shifting to neutral, the hype has temporarily ended, and there are no bullish drivers yet. And for the health of the market, a correction is needed. Bitcoin is breaking the neutral consolidation structure. The previous trading session closed below the support range, which generally indicates market weakness. Despite the global bullish trend, Bitcoin is moving from consolidation to a correction phase, with 112K - 110.5K serving as points of interest in this case. Before the fall, liquidity may be captured in the 114K - 114.800 zone.
Resistance levels: 114.05, 114.85, 115.67
Support levels: 112.03, 110.48
After a strong movement, the market may enter a correction or local consolidation, during which it may test the specified resistance zones before continuing its downward movement to the zone of interest and liquidity at 112 - 110.5.
Best regards, R. Linda!
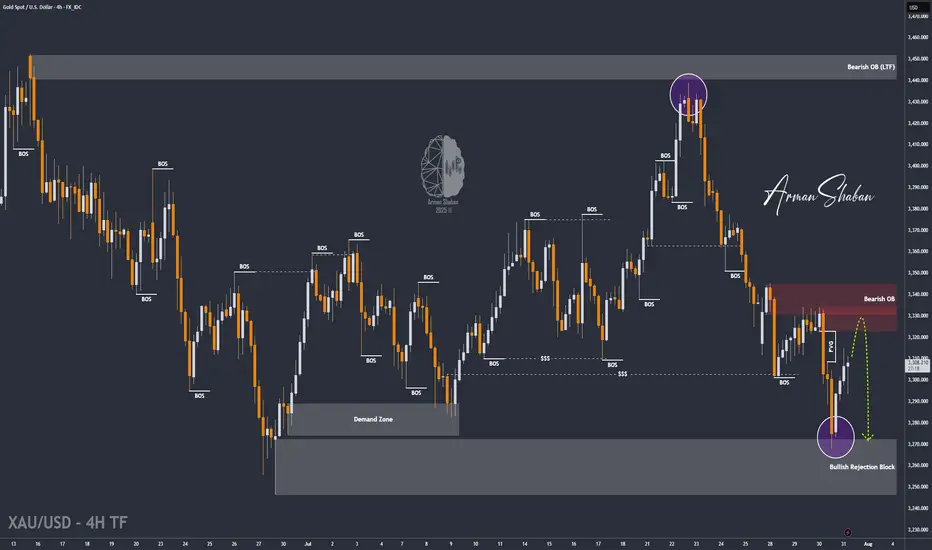
XAU/USD | Next Key Zone: Watch for Rejection at $3334! (READ)By analyzing the gold chart on the 4-hour timeframe, we can see that, just as expected, the price dropped from $3310 to $3288 in the first leg, where it hit a demand zone and bounced up to $3305, delivering a 170-pip rally. The main bearish move from $3333 to $3288 yielded 450 pips, bringing the total return on this analysis to over 620 pips!
In the second phase, gold dropped sharply again to $3268, and once more found demand, currently trading around $3307. If the price holds above $3294, we could expect further upside toward the $3322–$3334 zone. Once gold reaches this area, a strong bearish rejection is likely, with a potential return of 250 to 400 pips.
All key supply and demand levels are marked on the chart — make sure to monitor them closely and study the chart in detail. Hope you’ve made the most of this powerful analysis!
Please support me with your likes and comments to motivate me to share more analysis with you and share your opinion about the possible trend of this chart with me !
Best Regards , Arman Shaban