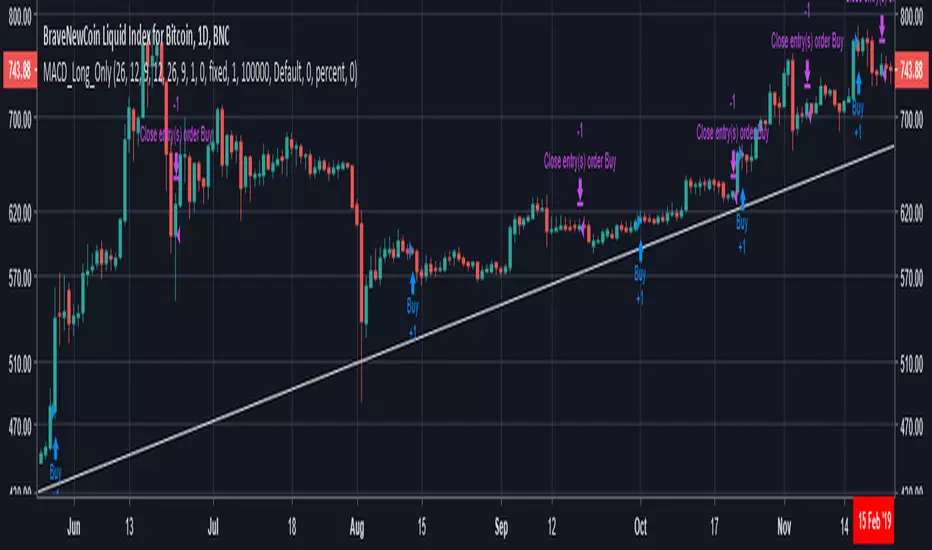
MACD_Long_OnlyI created this indicator to calculate the gains that can be made purely by going long on the market. For exchanges without the ability to short, the standard MACD strategy is unable to accurately calculate the profit/loss from entering and exiting a position, as it includes profit/loss from actively shorting the market, which may either not be possible, or be undesirable for a specific asset.
Macdcross
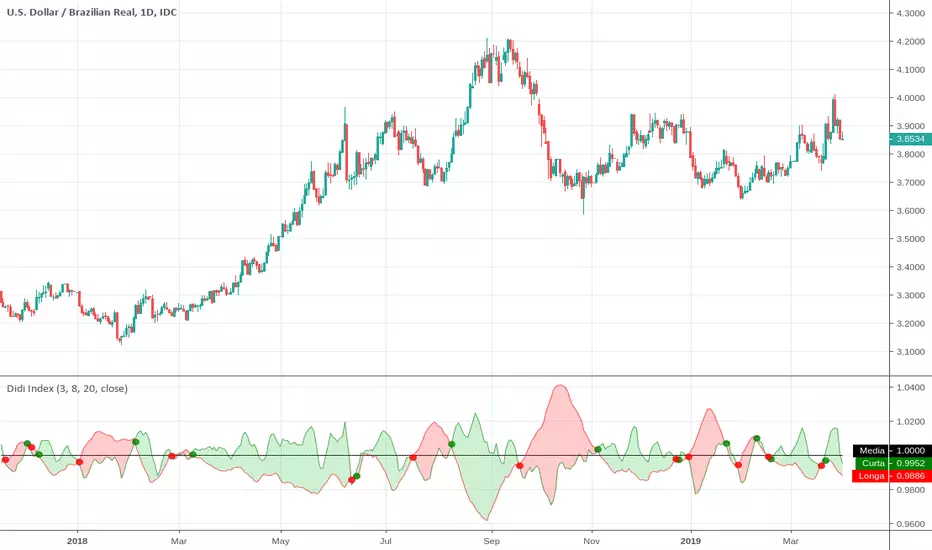
Didi IndexThis indicator was originally developed by brazilian technical analyst Odir "Didi" Aguiar. Also known as "Didi Needles". Consider it as a brazilian MACD.
And don't forget to like)
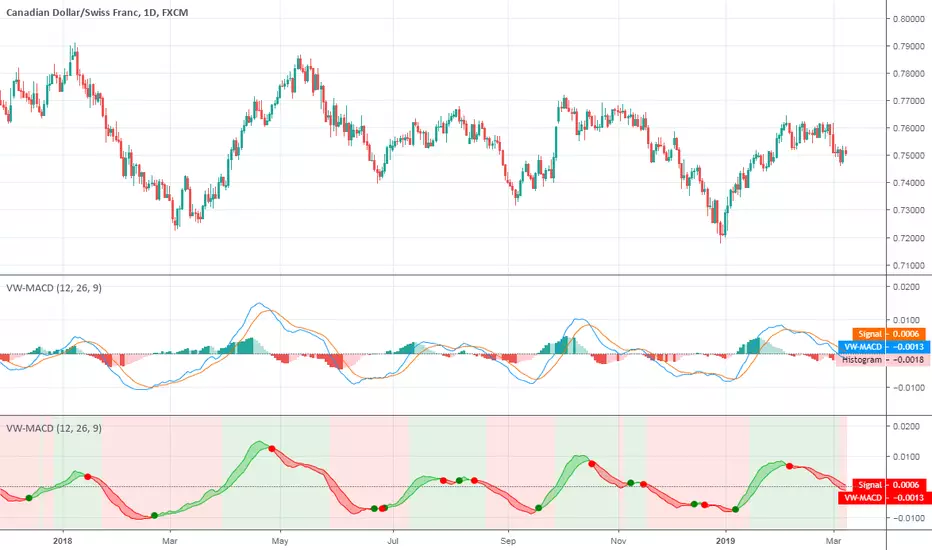
VW-MACDHello traders!
I am reading "Investing with Volume Analysis: Identify, Follow, and Profit from Trends" by Buff Pelz Dormeier so I am going to implement all indicators that are considered there.
VW-MACD was developed by Buff Pelz Dormeier in 2000 and is based on the difference between a short-term volume-weighted moving average and a long-term volume-weighted moving average. The signal line is traditionally left as an exponential moving average.
Like and follow for more cool indicators!
Happy Trading!
Percentage Volume OscillatorThis indicator is based on Percentage Price Oscillator and volume as a source.

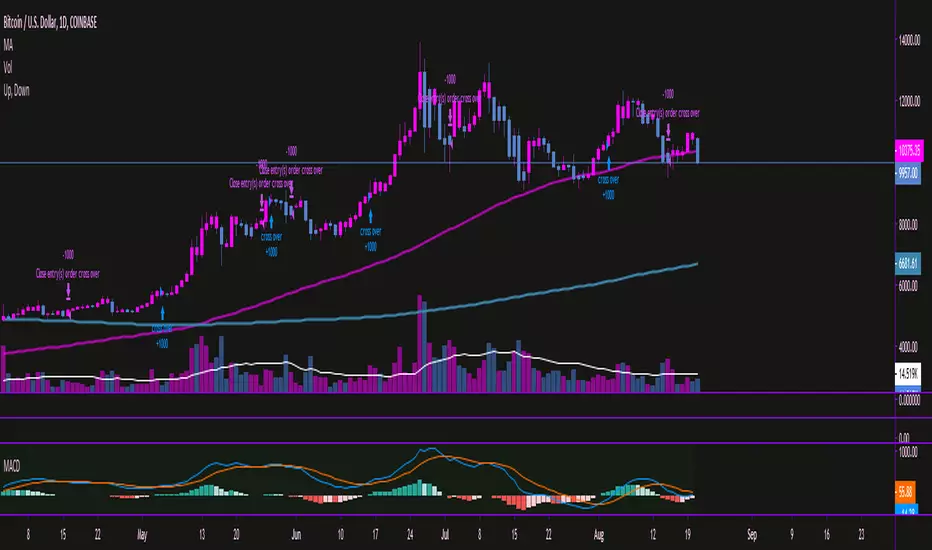
Moving Average Convergence/Divergence MaCD BackestingMade this to backtest simple macd trading strategy, had to set it to open long and short positions because i'm not sure how you get it to calculate otherwise.
MACD percentage price oscillatorMACD Percentage Price Oscillator is a variation of the MACD indicator. Signal line crossovers are almost identical. The major difference is the MACD Percentage scale which enables comparison between stocks at different prices.
MACD Percentage Price Oscillator's trading signals are the same as for the MACD indicator. The MACD indicator is primarily used to trade trends and should not be used in a ranging market. Signals are taken when MACD crosses its signal line, calculated as a 9 day exponential moving average of MACD.
First check whether price is trending. If the MACD indicator is flat or stays close to the zero line, the market is ranging and signals are unreliable.
Signals are far stronger if there is either:
- a divergence on the MACD indicator; or
- a large swing above or below the zero line.
- Unless there is a divergence, do not go long if the signal is above the zero line, nor go short if the signal is below zero. Place stop-losses below the last minor Low when long, or the last minor High when short.
The main advantage of MACD Percentage over MACD is the ability to compare indicator values across stocks.
The only difference with MACD Percentage Price Oscillator is that the difference between the fast and slow moving averages is calculated as a percentage of the slow moving average: MACD = (12 Day EMA - 26 Day EMA) / 26 Day EMA
