Zero Lag Trend Strategy (MTF)🧠 Strategy Overview
The Zero Lag Trend Signals Strategy (MTF) is a high-precision, multi-timeframe trend-following system designed for traders seeking early trend entries and intelligent exits. Built around ZLEMA-based signal detection, based on the original indicator Zero Lag Trend Signals (MTF) from AlgoAlpha, now built as a strategy with several improvements for Exit Criteria include RR, ATR Stop Loss, Trailing stop loss, etc. See below.
This momentum strategy works much better for higher timeframes, typically 4 hours or higher. This particular combination only contains 57 trades because this captures larger trend moves. The dataset contains realistic commission and slippage. You can try to run this on a smaller timeframe, but you will need to try different combinations of length, band multiplier, risk-reward ratios, and other stop loss criteria.
🔍 Key Components
1️⃣ ZLEMA Trend Engine
ZLEMA (Zero-Lag EMA) forms the foundation of the trend signal system.
Detects bullish and bearish momentum by analyzing price action crossing custom ZLEMA bands.
Optional confirmation using 5-bar ZLEMA slope filters (up/down trends) ensures high-conviction entries.
2️⃣ Volatility-Based Signal Bands
Dynamic bands are calculated using ATR (volatility) stretched over 3× period length.
These bands define entry zones (outside the bands) and trend strength.
Price crossing above/below the bands triggers trend change detection.
3️⃣ Entry Logic
Primary long entries occur when price crosses above the upper ZLEMA band.
Short entries (optional) trigger on downside cross under the lower band.
Re-entry logic allows continuation trades during strong trends.
Filters include date range, ZLEMA confirmation, and previous position state.
4️⃣ Exit Logic & Risk Management
Supports multiple customizable exit mechanisms:
🔺 Stop-Loss & Take-Profit
ATR-Based SL/TP: Uses ATR multipliers to dynamically set levels based on volatility.
Fixed Risk-Reward TP: Targets profit based on predefined RR ratios.
Break-Even Logic: Automatically moves SL to entry once a threshold RR is hit.
EMA Exit: Optional trailing exit based on price vs. short EMA.
🔀 Trailing Stop
Follows price action using a trailing ATR-based buffer that tightens with trend movement.
🔁 Trend-Based Exit
Automatically closes positions when the detected trend reverses.
5️⃣ Multi-Option Trade Filtering
Enable/disable short trades, ZLEMA confirmations, re-entries, etc.
Time-based backtesting filters for isolating performance within custom periods.
6️⃣ Visual Feedback & Annotations
Trend shading overlays: Green for bullish, red for bearish zones.
Up/Down triangle markers show when ZLEMA is rising/falling for 5 bars.
Stop-loss, TP, trailing lines drawn dynamically on the chart.
Floating stats table displays live performance (PnL, win %, GOA, drawdown, etc.).
Trade log labels annotate closed trades with entry/exit, duration, and reason.
7️⃣ CSV Export Integration
Seamless export of trade data including:
Entry/exit prices
Bars held
Encoded exit reasons
Enables post-processing or integration with external optimizers.
⚙️ Configurable Parameters
All key elements are customizable:
Entry band length and multiplier
ATR lengths, multipliers, TP/SL, trailing stop, break-even
Profit target RR ratio
Toggle switches for confirmations, trade types, and exit methods
Momenutm
HOG QQE StackHOG QQE Stack – Advanced Momentum + Volatility “Stack”
🧠 Overview
HOG QQE Stack enhances classic QQE (a smoothed RSI variant) by layering multiple signal validation components: momentum, volatility, color gradient, and volume confirmation. This “stacked” structure produces clearer, more reliable signals than using RSI or QQE alone.
📊 Key Features
1. **Smoothed RSI Core**
Starts from a twice-smoothed RSI base (similar to QQE), reducing noise for cleaner trend detection. :contentReference {index=1}
2. **Fast & Slow Momentum Lines**
Generates dual lines for momentum crossovers—more precise than single-oscillator readings. :contentReference {index=2}
3. **ATR Volatility Filter**
Adds volatility-based bands around the fast line, helping filter out weak moves and false signals. :contentReference {index=3}
4. **Volume‑Validated Pulse Dots**
Pulse dots indicate when strong momentum aligns with volume spikes near overbought/oversold zones—highlighting high-confidence moves.
5. **Gradient Color Line**
The QQE line dynamically colors itself based on its position between OB/OS levels—intuitive and visually insightful.
6. **OB/OS & Midline Context**
Includes fixed 70/50/30 reference lines for quick momentum benchmarking.
7. **Layered Signal Strength**
By stacking momentum, volatility, gradient, and volume, the indicator provides multi-tiered confirmation—hence the “Stack” name.
8. **Repaint-Safe & Minimalist**
Plots only confirmed data—no repainting. The visuals are clean and easy to read.
🎯 Application
- Monitor fast/slow momentum crossovers *within* the volatility band for confirmed trend shifts.
- Use pulse dots to confirm strong movement backed by volume.
- Ideal for 4H/Daily charts, especially when used with HOG Super Trend or Liquidity Hunter.
- OB/OS levels (70/50/30) serve as guides for potential reversals or continuations.
⚙️ Inputs
- RSI Length
- QQE Smooth Factor
- WAE Length & Multiplier
- Overbought & Oversold Levels (default 70/30)
⚠️ Notes
- Designed as a **confirmation stack**, not a standalone strategy.
- No repainting—uses confirmed bar values only.
- Fully original code—no copying.
- No guarantees of performance—use proper risk management.
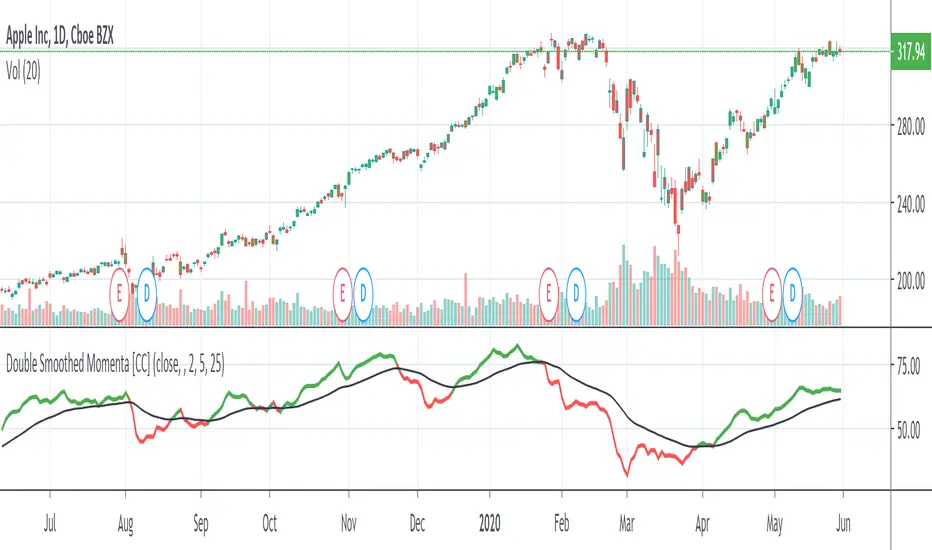
Double Smoothed MomentaDouble Smoothed Momenta was created by William Blau (Stocks & Commodities V. 9:5 (202-205)). His original indicator didn't use a signal period so I added one to notify you when to buy or sell. Buy when the indicator goes over the signal line and sell when it is falls below the signal line.
Let me know what other indicators you would like me to write scripts for!
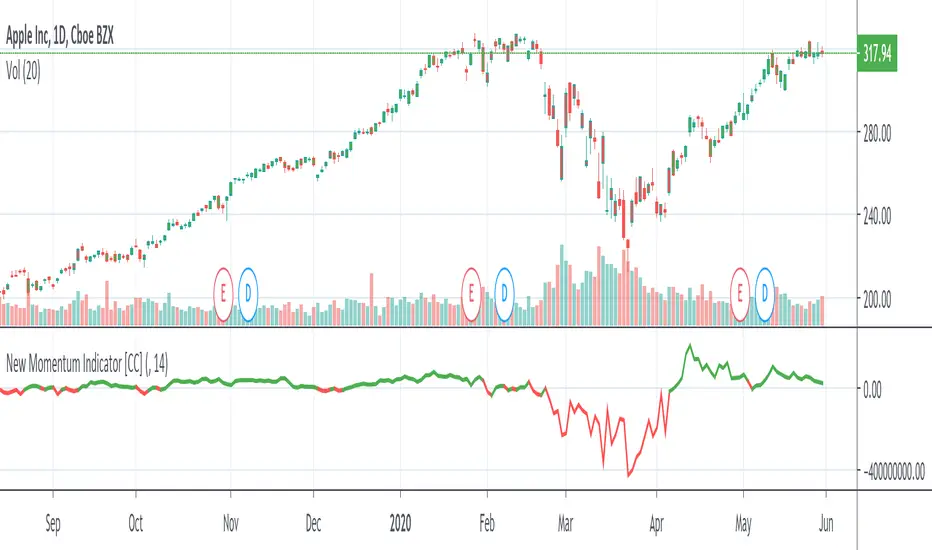
New Momentum IndicatorThe Momentum Indicator was created by Darryl W Maddox (Stocks & Commodities V. 9:4 (158-159)) and it is one of the simplest and most powerful indicators out there. Buy when the indicator goes over 0 and sell when it falls below 0
Let me know what other indicators you would like to see me write a script for!
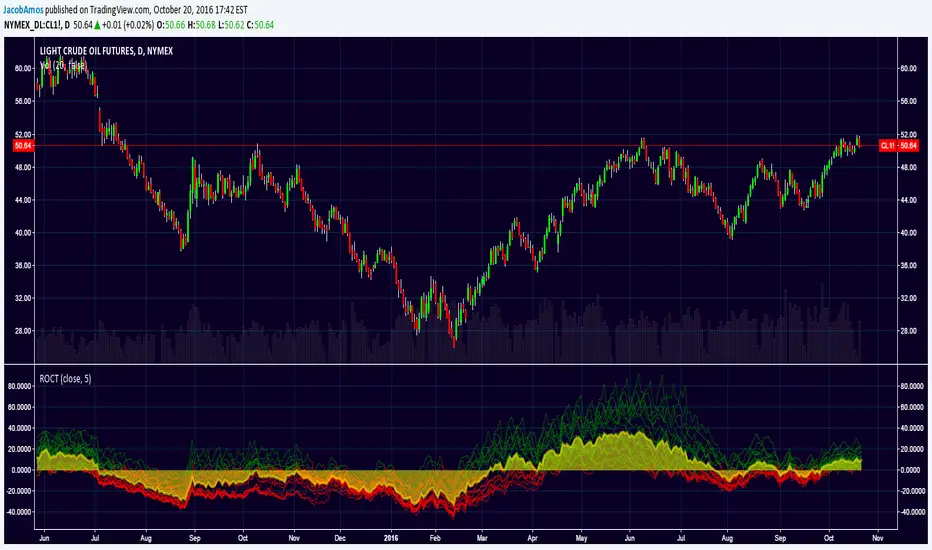
ROC TideAdds some depth to the traditional rate of change (ROC) indicator. Instead of just having one ROC line with a single lookback period, this takes a minimum lookback period, n , and plots 20 ROC lines with lookback periods of n, 2n, 3n, ..., 20n . These lines will appear green when greater than zero, red when less than zero, and yellow when equal to zero by default.
Then it plots the average of those 20 ROC's as a yellow filled area so as to make it easier to see where the balance (or "tide") of the ROC waves are located.
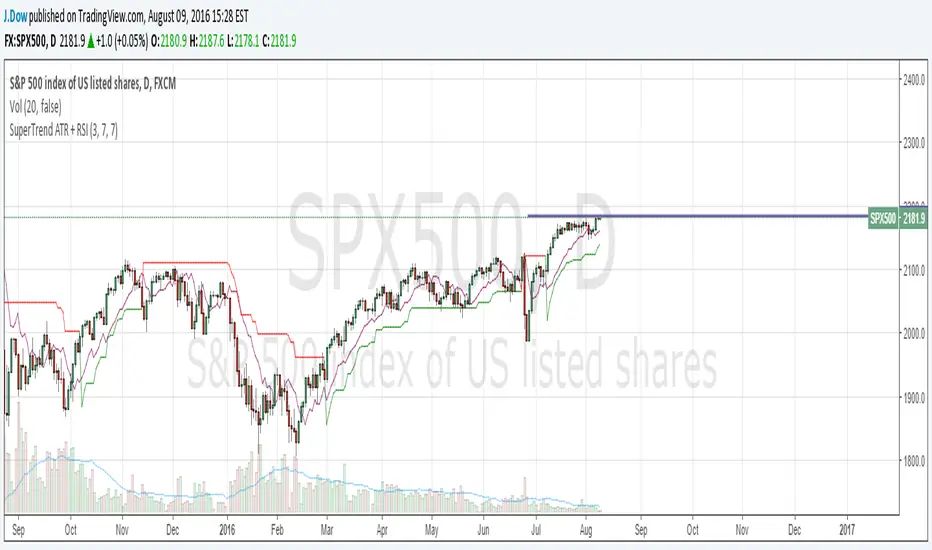
Adaptive Donchian ChannelThis indicator adds a level of adaptivity to the simple Donchian Channel by adjusting the sensitivity (lookback periods) of the channel's upper and lower bounds based on the amount of time that has elapsed since the price has hit/expanded the channel boundaries. Comparing the results of this indicator to the standard Donchian Channel, the readier level of responsiveness may prove self-evident.
METHODOLOGY:
Specifically, the more recently the channel was expanded in one direction, the longer the lookback period grows in that direction. Conversely, if the channel has not been expanded in a given direction, the lookback period will contract so as to allow for a tighter channel.
For example, let the initial lookback period be 20 bars and let the factor argument be 0.1 (or 2 bars to start, as 20*0.1 = 2). Now say the current bar sets a new 20-period high. Then the lookback period for the upper bound is expanded by 2 bars to 22, and the lookback period for the lower bound is contracted by 2 bars to 18, thereby making it simultaneously harder to set new highs and easier to set new lows (and vice versa for hitting new lows). If neither a new high nor a new low is formed, both periods contract by the given factor.