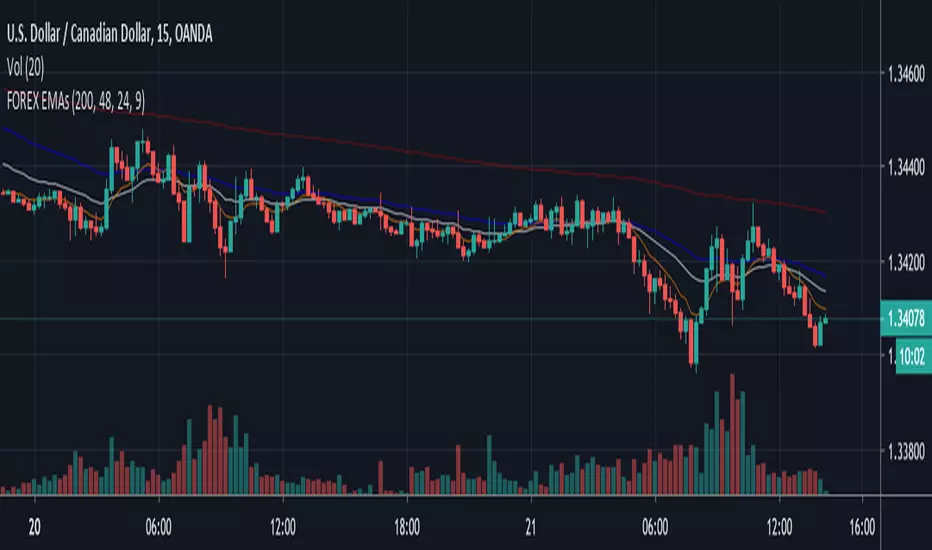
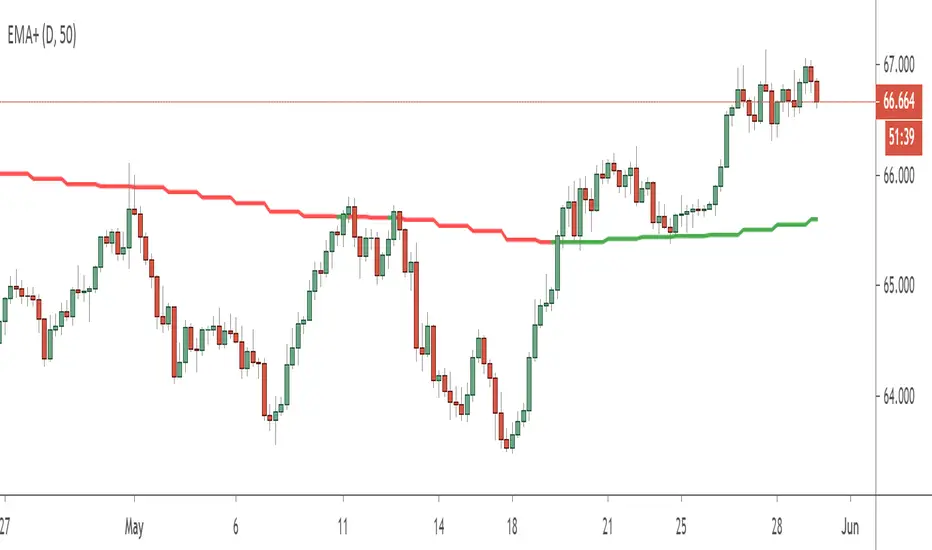
FOREX EMAsPretty simple here - this is the base EMAs I suggest most traders use in the FOREX market for swings and scalp trading. Works well on 5m, 15m, 1H, 4H, and daily trading if you design an edge to interpret the relationship these averages of price are telling you.
The 9EMA is not as valuable on the 1HR timeframe.
Moving
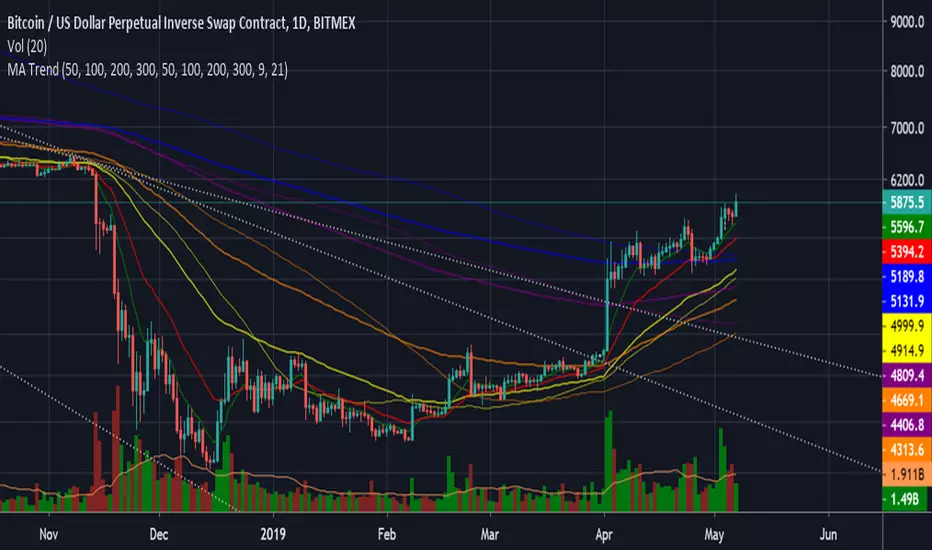
Moving Average Trend IndicatorThis Indicator shows you the major moving averages, both in simple and exponential.
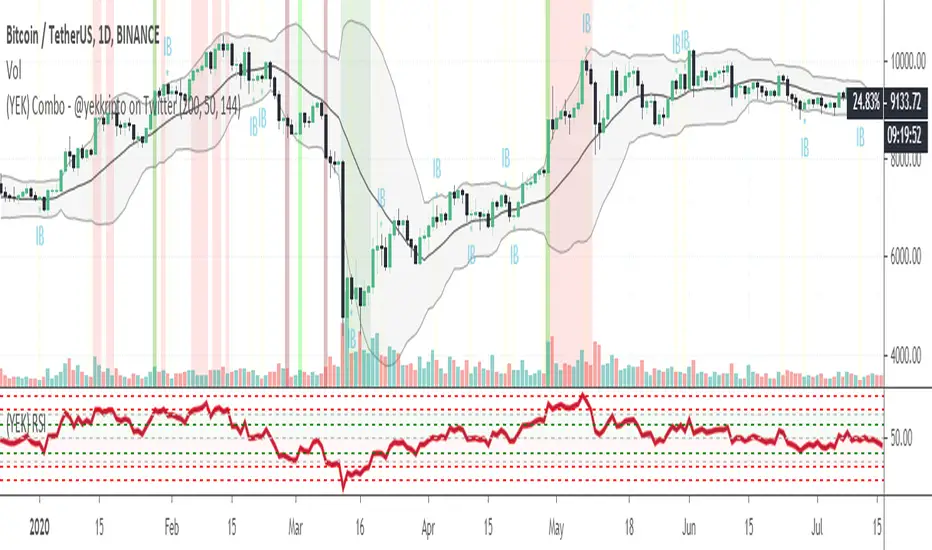
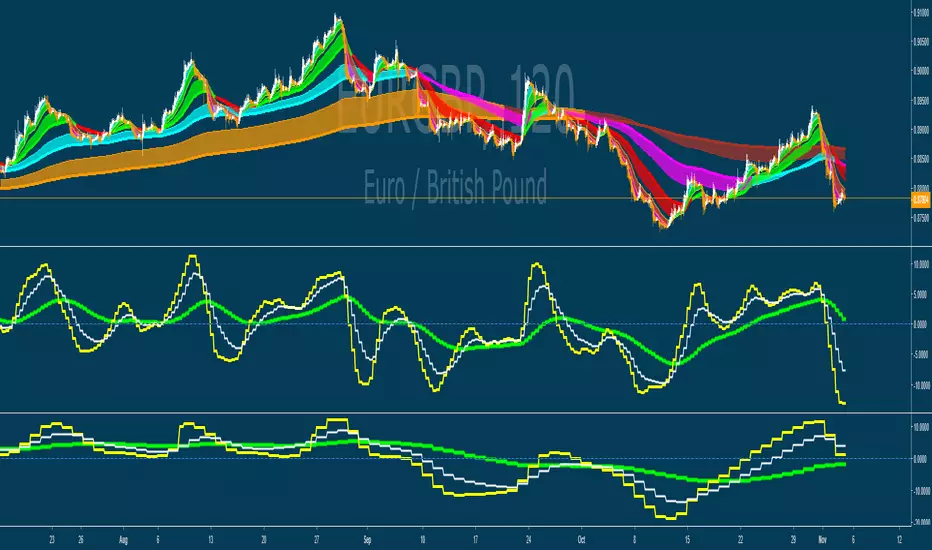
(YEK) Combo(YEK) Combo is a combination of several indicators (listed below). You can use them together or one by one. Just click settings, and choose which of them to be shown.
Here are the indicators included in this script:
- Ichimoku Cloud
- Bollinger Bands
- Moving Average 1
- Moving Average 2 (In case of detecting golden crosses or death crosses)
- Exponential Moving Average
- T3 Tillson
- MavilimW
Enjoy!
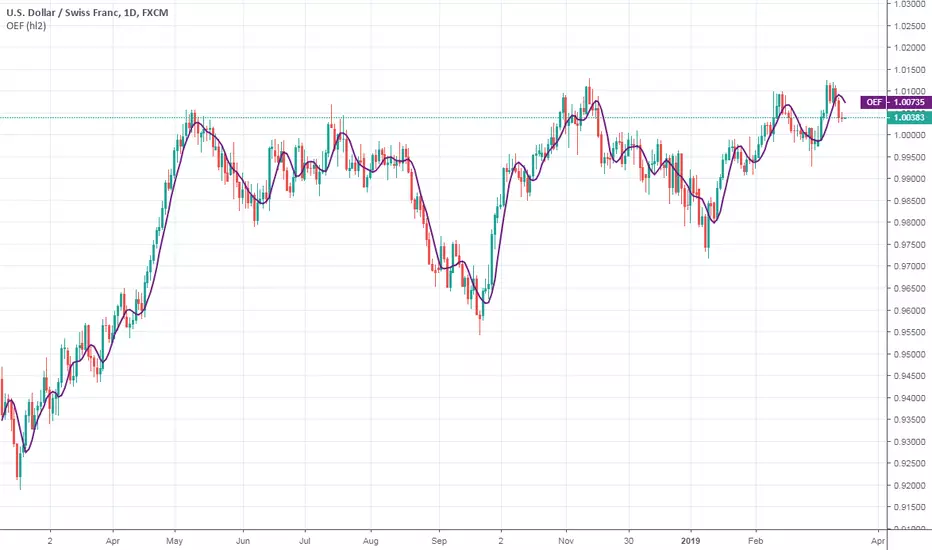
Ehlers Optimum Elliptic FilterThis indicator was originally developed by John F. Ehlers (Stocks & Commodities, V.18:7 (July, 2000): "Optimal Detrending").
Mr. Ehlers worked on the smoother that could have no more than a one-bar lag. An elliptic filter provides the maximum amount of smoothing under the constraint of a given lag.
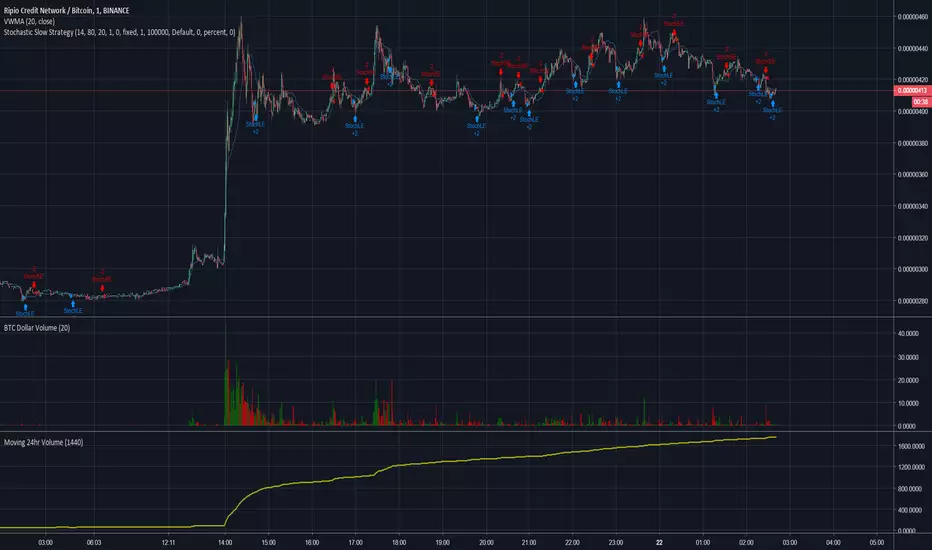
Volume - Moving Sum (Quote Currency)This indicator shows a MOVING SUM of the QUOTE CURRENCY of the pair.
I made this because I wanted to be able to see how the 24HR volume looked on 1-Minute charts (which is why the default period is 1440, as there are 1440 minutes in a day.)
QEMA - Quadruple Moving Averages (50,100,200,300)The script combines the common moving averages 50,100 and 200 and adds an additional MA300 to the graph.
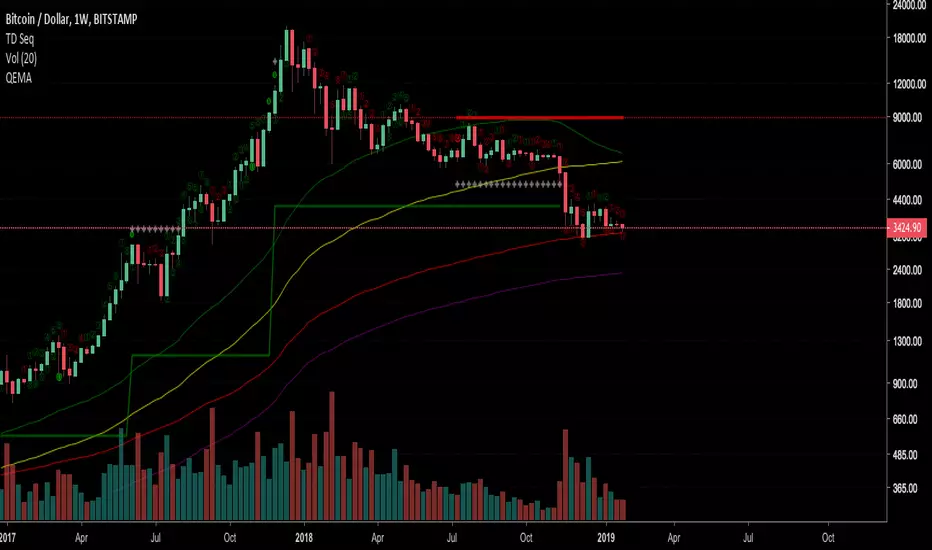
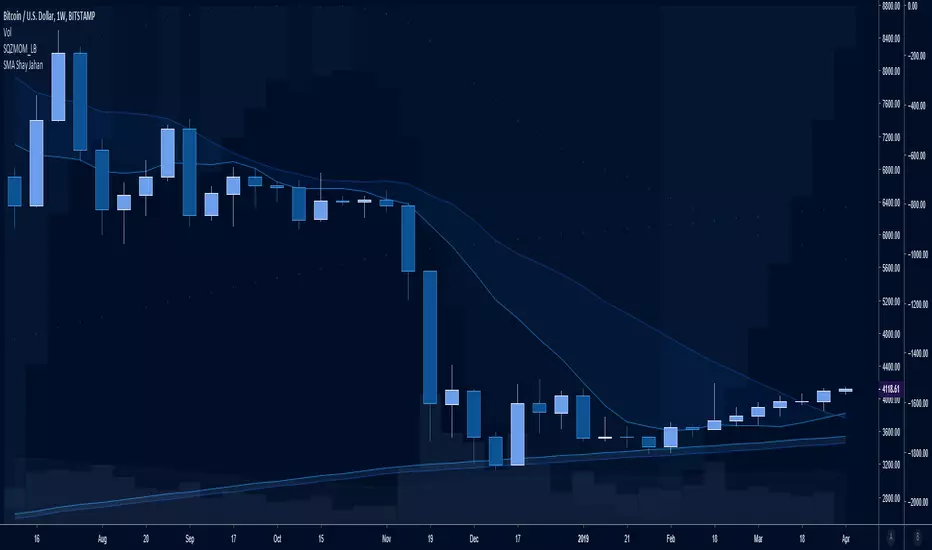
Bitstamp BTC Horizontal 200 Week SMAsmall change to my horizontal 200 week SMA script.
Plots the latest 200 week SMA value from Bitstamp BTCUSD on the chart. I use it for the Bitmex chart, as Bitmex doesn't have enough history for a 200 week moving average.

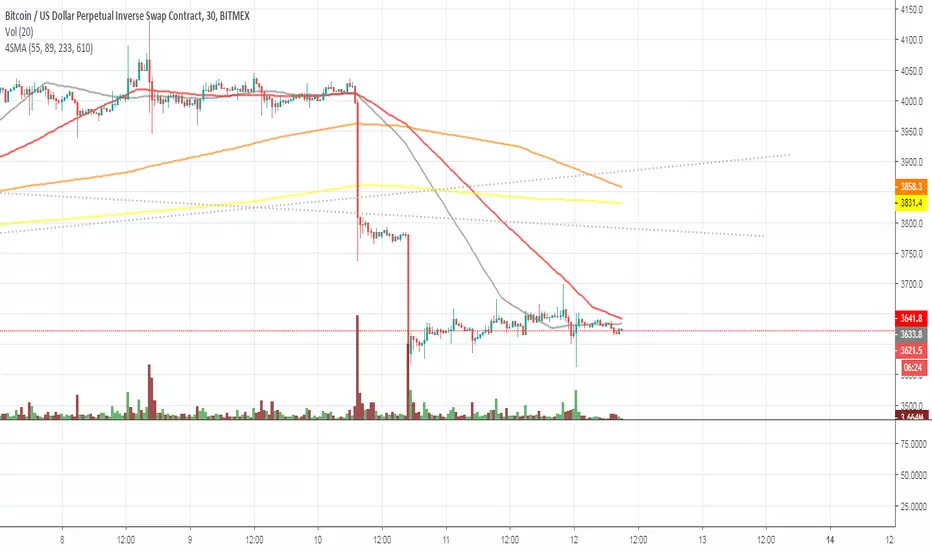
4SMA Fibonacci 55/89/223/610just noticed the correlation of SMAs and fibonacci on my charts.
maybe it will help you to.
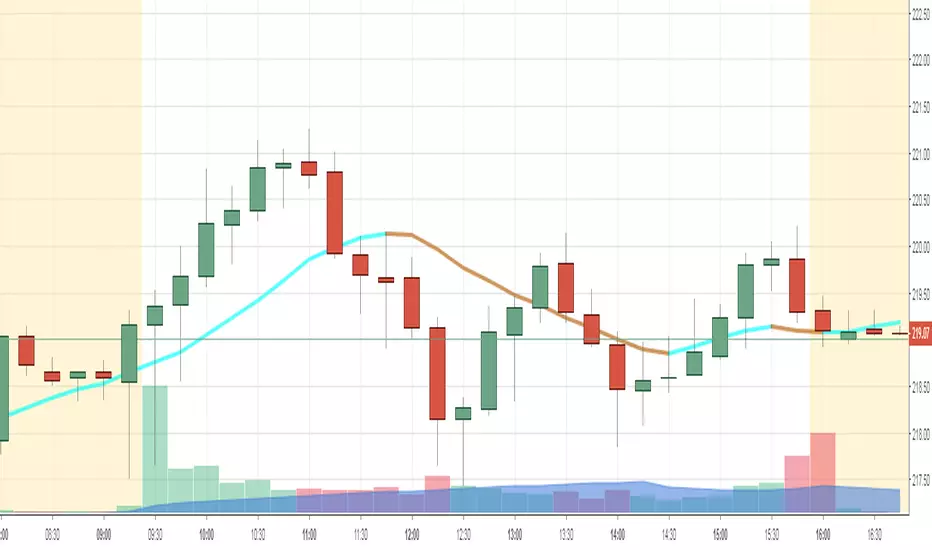
Higher Timeframe EMAThis script plots a higher timeframe EMA to your chart.
You can specify the timeframe and the length of the EMA in the settings.
This chart demonstrates the 5-minute 50EMA (black) combined with the 1-hour 50EMA (colored) on the 1 minute timeframe.
Optimized Random Average (Linear) mcbw_This is a moving average with a customizable random kernel. You can shape your kernel by selecting your parameters in the settings window. This is not something that is immediately ready to mess with by just applying it on the chart, it is very useful for people who are researching indicators and developing new tools. To see the shape of your kernel you can plug it into google or wolfram. This indicator and the related ones are rather technical in nature, so feel free to comment any questions you may have and to see if anyone has asked your question.
Read more here:
Happy studying and enjoy your life!
2019 will be absolutely insane!

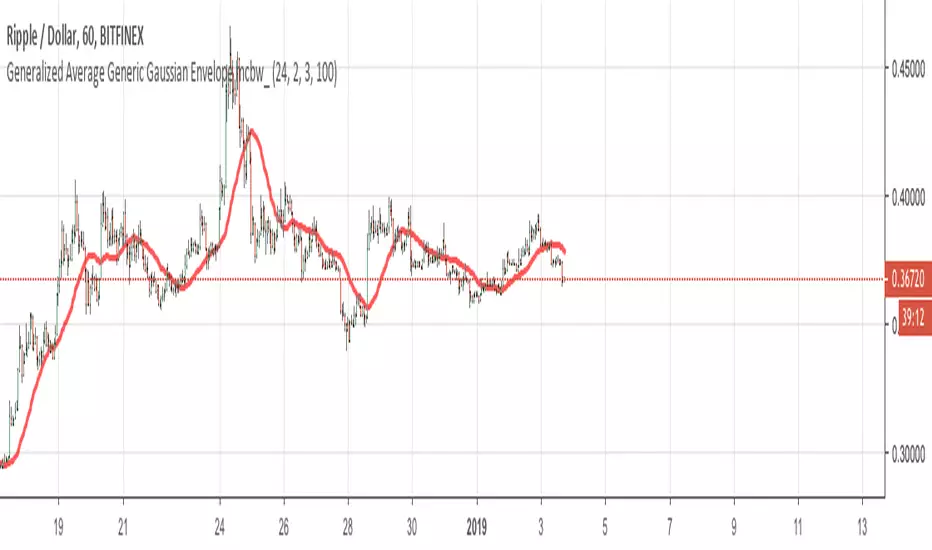
Generalized Average Generic Gaussian Envelope mcbw_This is a moving average with a customizable gaussian kernel. You can shape your kernel by selecting your parameters in the settings window. This is not something that is immediately ready to mess with by just applying it on the chart, it is very useful for people who are researching indicators and developing new tools. To see the shape of your kernel you can plug it into google or wolfram. This indicator and the related ones are rather technical in nature, so feel free to comment any questions you may have and to see if anyone has asked your question.
Read more here:
Happy studying and enjoy your life!
2019 will be absolutely insane!
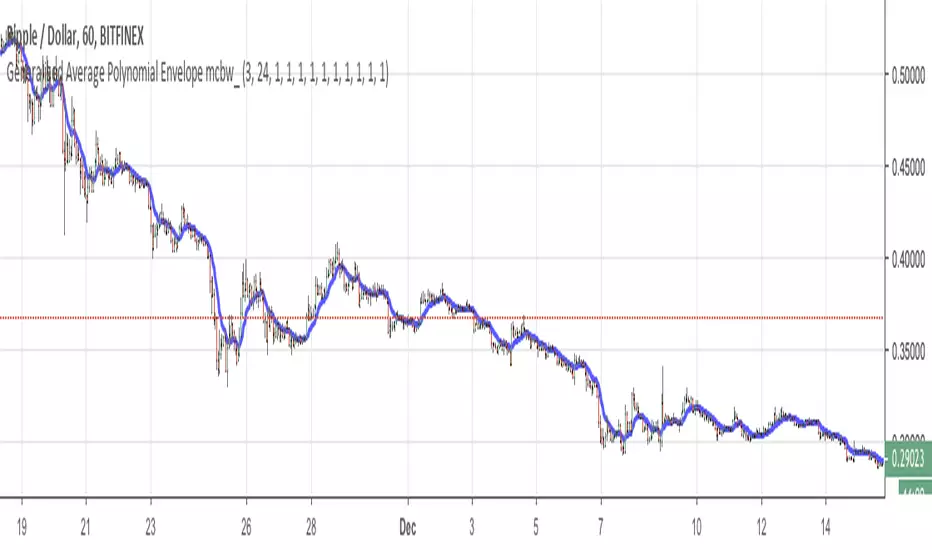
Generalized Average Polynomial Envelope mcbw_This is a moving average with a customizable polynomial kernel. You can shape your kernel by selecting your parameters in the settings window. This is not something that is immediately ready to mess with by just applying it on the chart, it is very useful for people who are researching indicators and developing new tools. To see the shape of your kernel you can plug it into google or wolfram. This indicator and the related ones are rather technical in nature, so feel free to comment any questions you may have and to see if anyone has asked your question.
Read more here:
Happy studying and enjoy your life!
2019 will be absolutely insane!
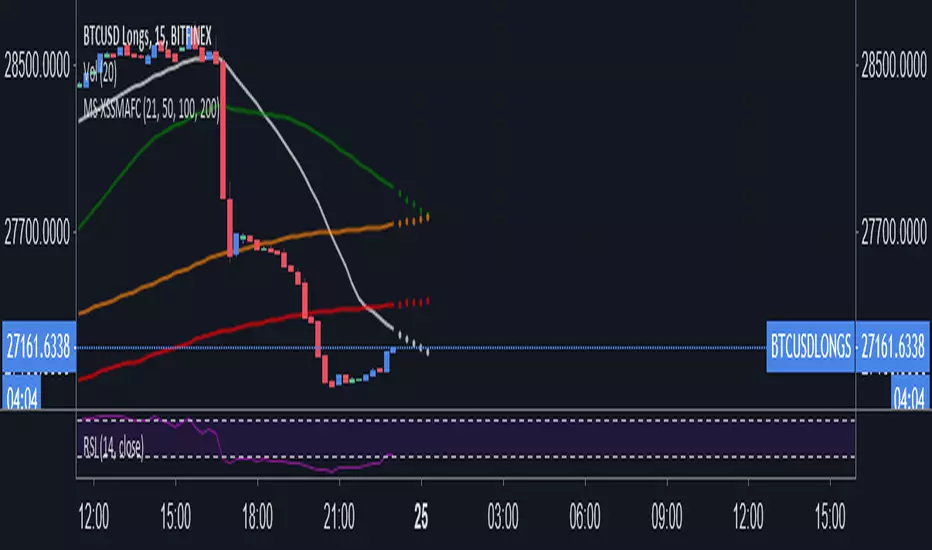
Meister Shredder - Simple Moving Averages x4 ForecastIncludes the 21, 50, 100 and 200 SMA and 6 bar forecast
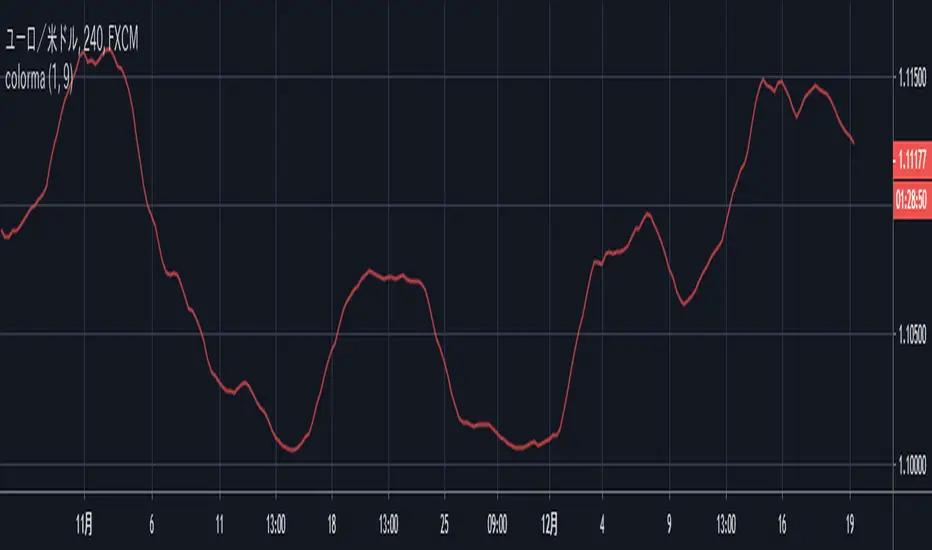
[code-piece] change plotted color with input()plotted colored moving average.
Plotted color can be changed by indicator's setting dialog.
It's useful for user to be able to change the color according to background color.
1 = red
2 = blue
3 = green
4 = yellow
5 = lime
6 = aqua
7 = orange
8 = white
other = black

Triple guppy w/ up/down colours - squattterThe trend is your friend.
Works well on 2hr TF which shows 30+60 ema from 8hr and Daily TFs.
Use a higher TF momentum indicator such as TRIX to confirm.
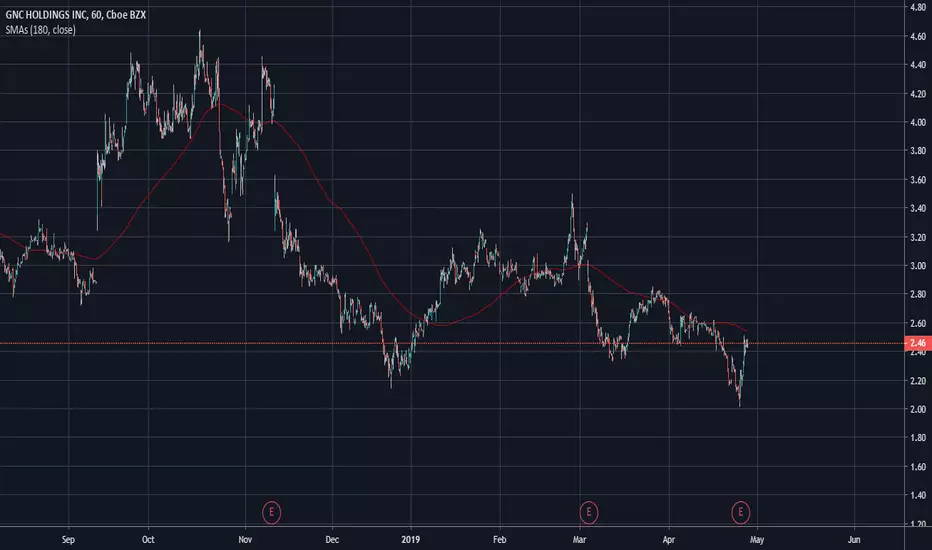
15minMAThis script lets you plot a simple or exponential moving average from a specific time frame that you can select. For example, if you always want the Daily 50MA on your chart, regardless of what resolution your chart is on, this will do it. It's also color coded to show if it's rising or falling.
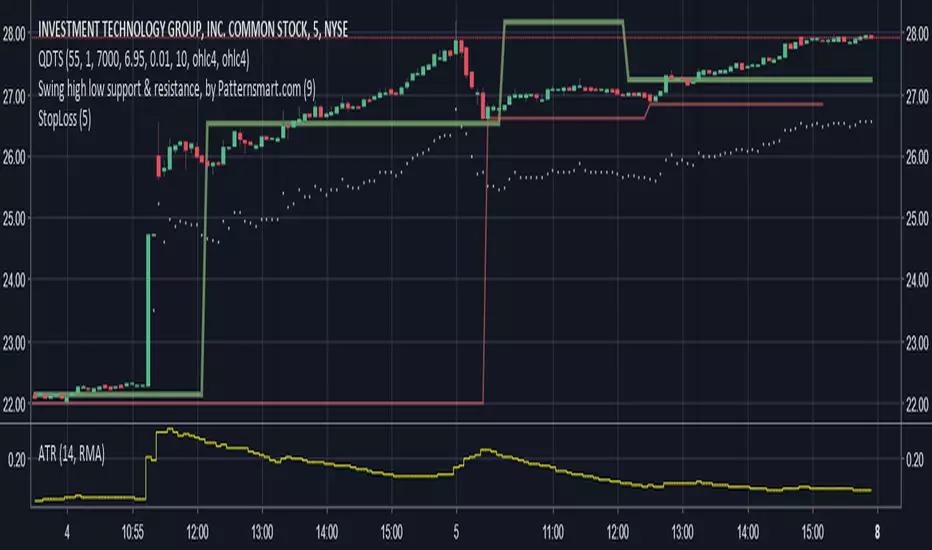
Binque's Stop LossFixed Script only showing Daily Stop Loss. Now will show stop loss based on the resolution of the chart you are on, i.e. 1 min, 5 min, 15 min, 1 h, 4 h, 1 d, 1 w, 1 month, etc...