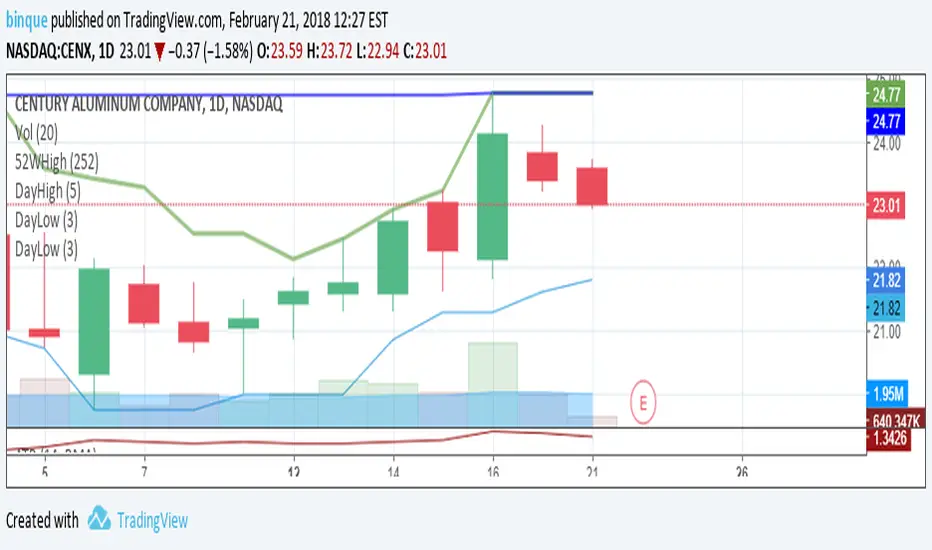
DayMidPointDayMidPoint - Plot the moving average of the Daily price midpoint for short periods of time (i.e. 3 day or 5 day). Great for detecting the short term daily trend direction to determine a SHORT or LONG position building in a stock. Use with DayHigh and DayLow indicators. for nice price channels on a chart.
Moving
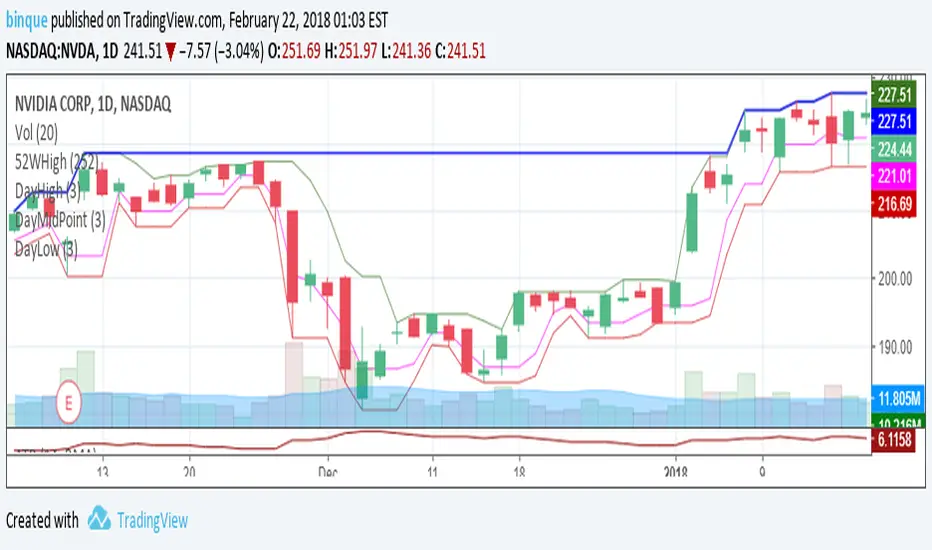
DayHigh - Plot the Moving Average of the Daily HighPlot the Moving Average of the Daily High for short periods of time (i.e 3 day or 5 day). Great for detecting when a stocks SELL pressure is running out and time to switch to a BUY strategy. Use in the DayHIGH indicator for nice price channels on a chart.

DayLow - Chart the Moving Average of the DAILY LOW PriceThis is a moving average of the Daily LOW Price over a short period of time (i.e. 3 day low moving average, etc...) Great for tracking trailing stops for a stock on an up swing.
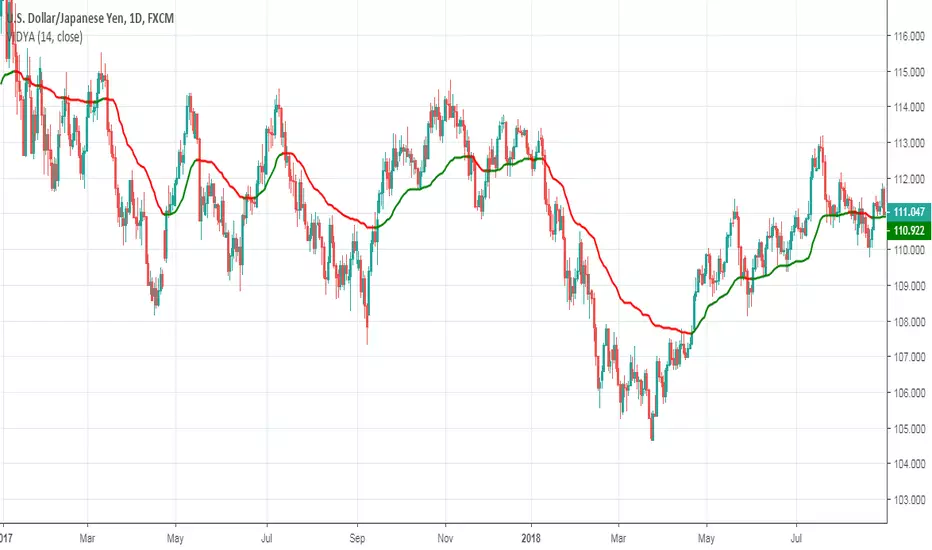
Variable Index Dynamic Average (VIDYA)Variable Index Dynamic Average indicator script based on the original version by Tushar Chande.
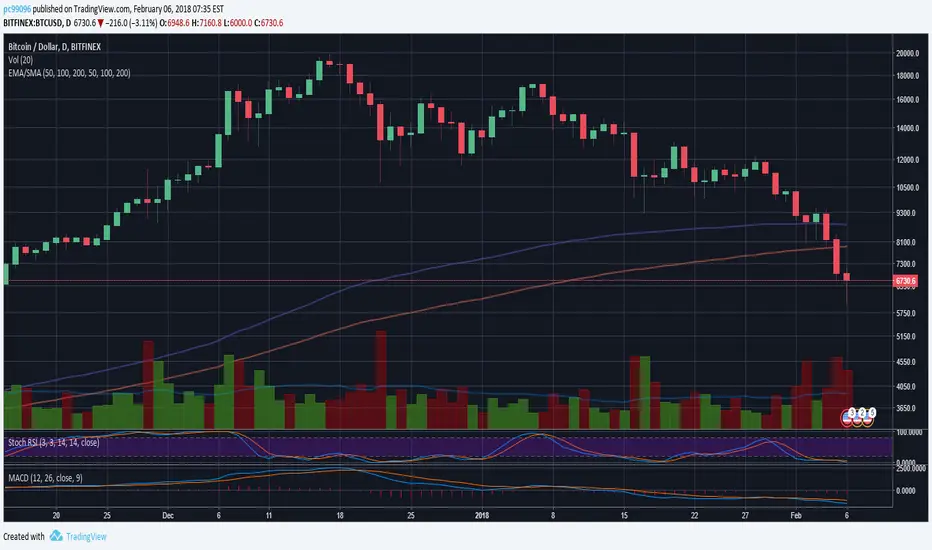
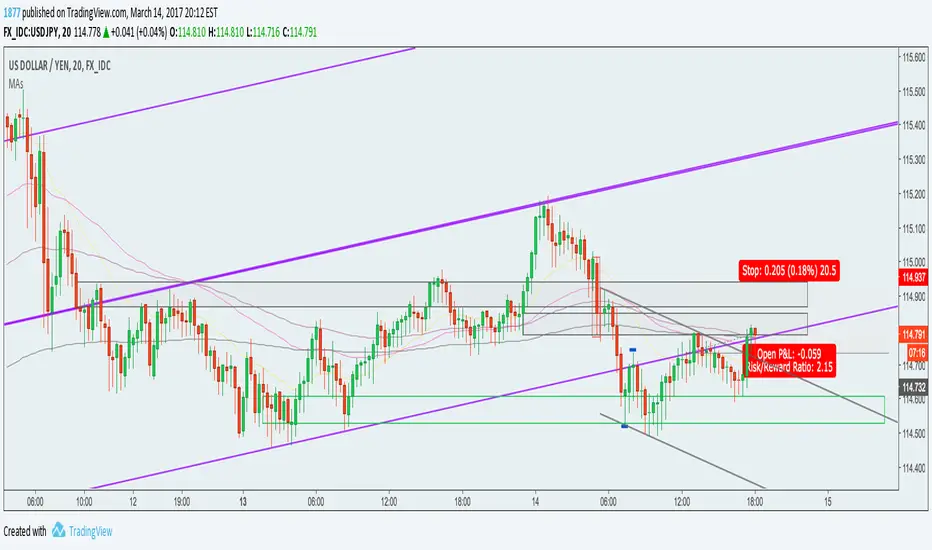
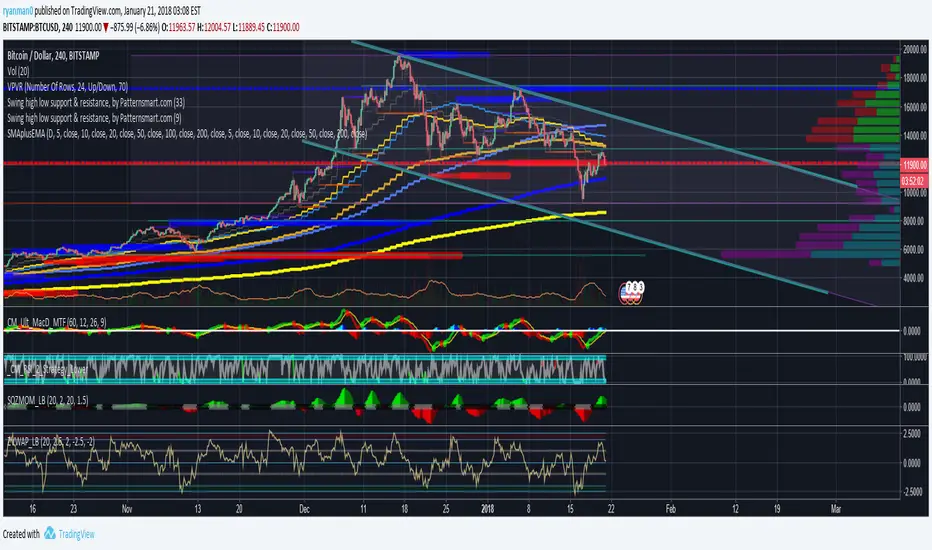
6 Simple Blue & 5 Exponential Yellow Moving Averages6 simple and 5 exponential Moving Averages in one indicator.
I made this because its not always easy to tell what average the price might be bouncing off from when you only have a couple at a time.
For some reason, the defaults aren't working.
To fix this, just open the configuration for the indicator after the first time that you load it.
Then check/uncheck the box and set the time period.
If anyone knows how I can fix this in the code, please let me know.
Blue indicators are simple and the Yellow are exponential.
Thinner more transparent lines are shorter term averages and Thicker lines are longer term averages.
I modeled it after the source of several other scripts which had less averages
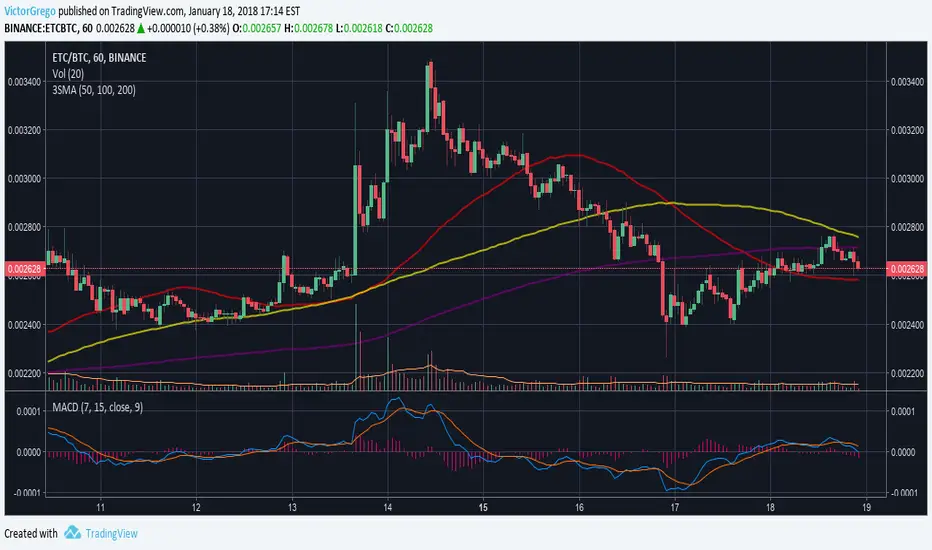
3SMAThis script plots three Simple Moving Averages instead of just one.
Support me going through grad school!
www.linkedin.com
BTC tip jar: 1Mv1s7nLaTsRoLai5WXEGg8doisXuiPUXy
ETH tip jar: 0x6113DDD23D0D5aCad3d1f8640A8A571E9Cb86cB8
LTC tip jar: LYvyoqTSWxa22TQw3E7818xy4AfYNi6xcm
BCH tip jar: 1GC7oZ7MhLkamKCDdZFnUfV21SKWq84VdY

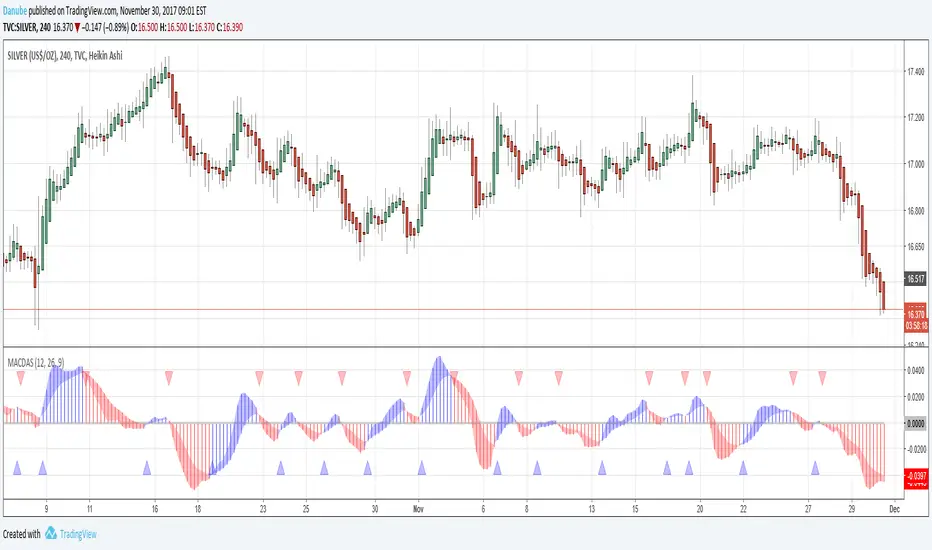
MACDAS by KIVANCfr3762 with Plots and AlertsMACDAS script by KIVANCfr3762, i added Plots and Alerts
original script
Dual Exponential Moving AveragesJust like the regular "Moving Average Exponential" indicator except this allows you to show 2 with custom time intervals, saving non-subscribers to Trading View an indicator slot. Enjoy.

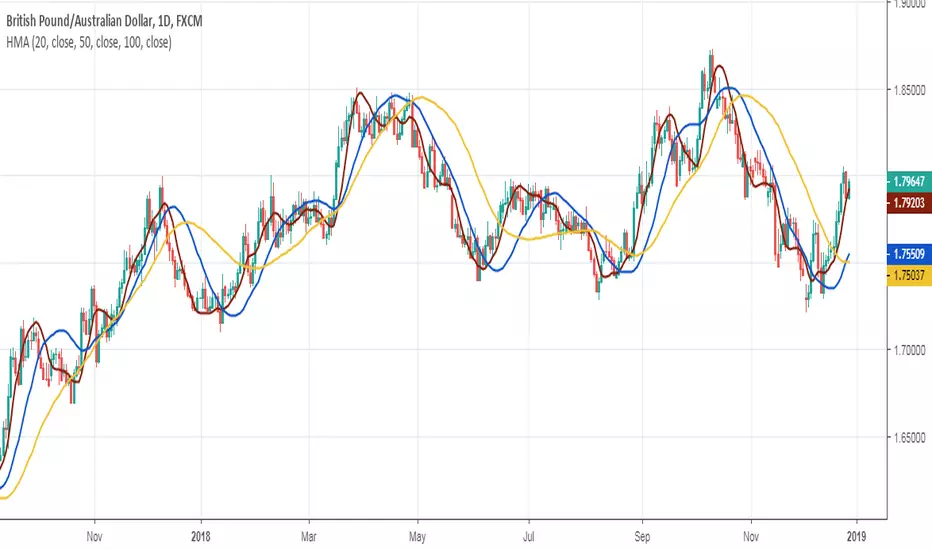
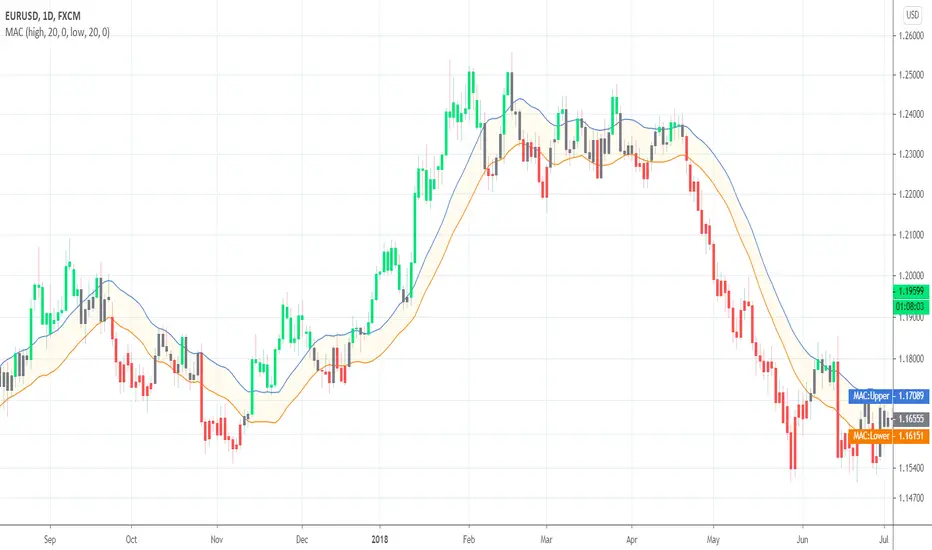
Magic Moving Averages!Magic Moving Averages! is an indicator that comes standard in many forex trading platforms, and now on Tradingview designed for comfortable readability! It incorporates a series of simple moving averages plotted together with increasing periods. Finding a good trade with this is easily found with a set of rules. I took a course with Alex du Plooy on these rules and am using his suggested default values, however there are many more teachers of this method that have various rules that may be similar. If you desire a greater MA spread simply increase the MA Separation value in the input. Best for 15 mins or longer charts.
Happy trading

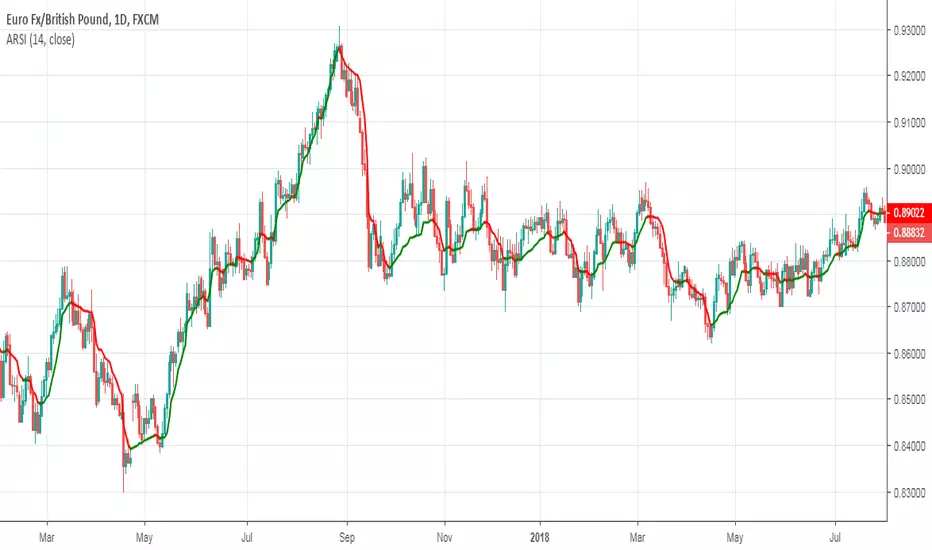
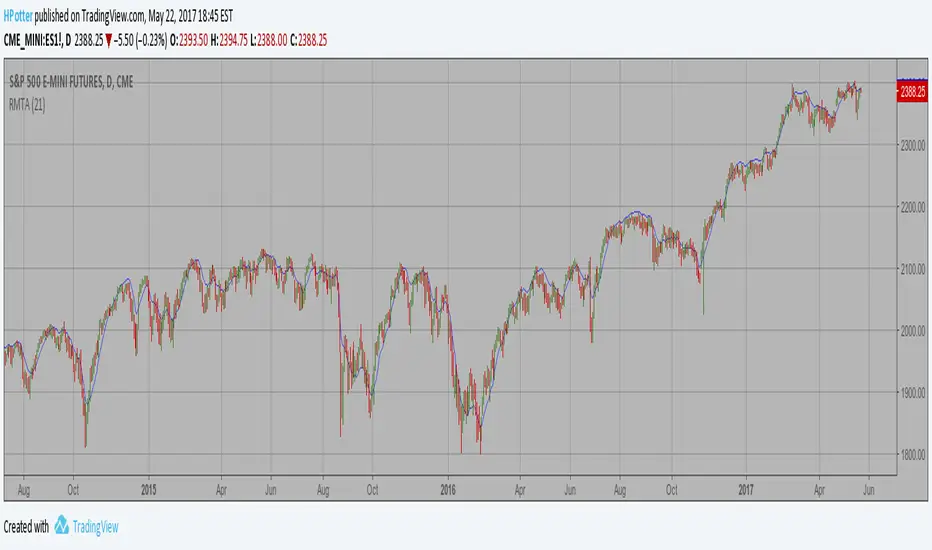
Recursive Moving Trend Average Taken from an article "The Yen Recused" in the December 1998 issue of TASC,
written by Dennis Meyers. He describes the Recursive MA in mathematical terms
as "recursive polynomial fit, a technique that uses a small number of past values
of the estimated price and today's price to predict tomorrows price."
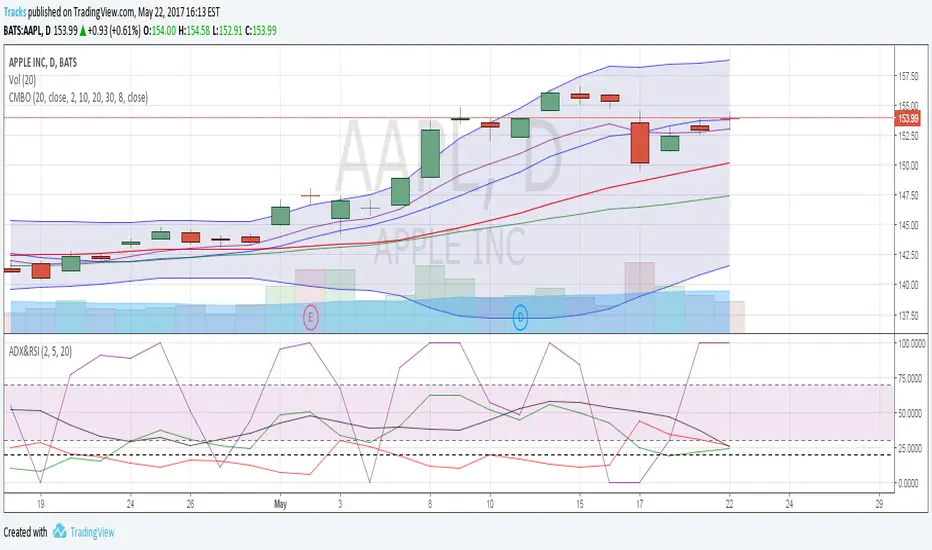
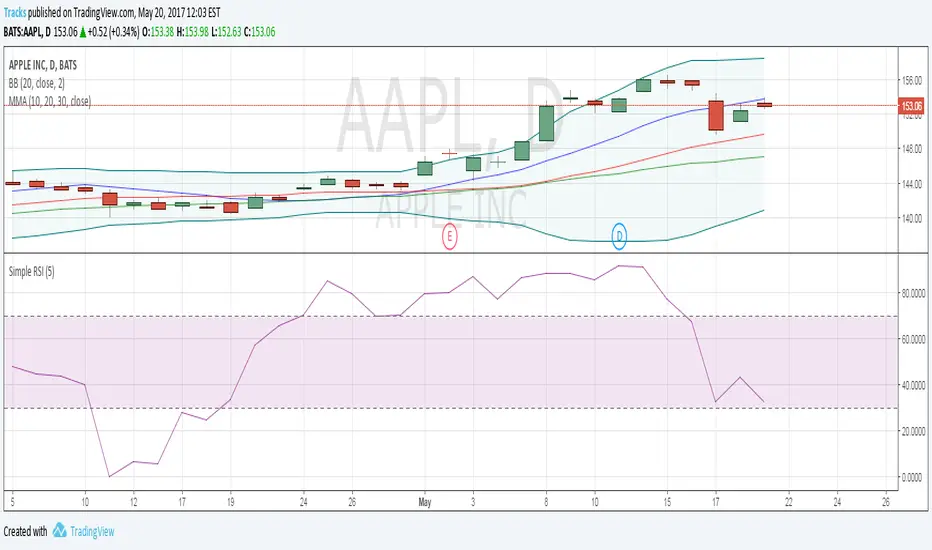
Combo IndicatorFor easier setup, this script combines 5 indicators. 3 simple moving averages, 1 EMA and Bollinger Bands. These are common indicators that are that often used and discussed on OptionsPlayers.com
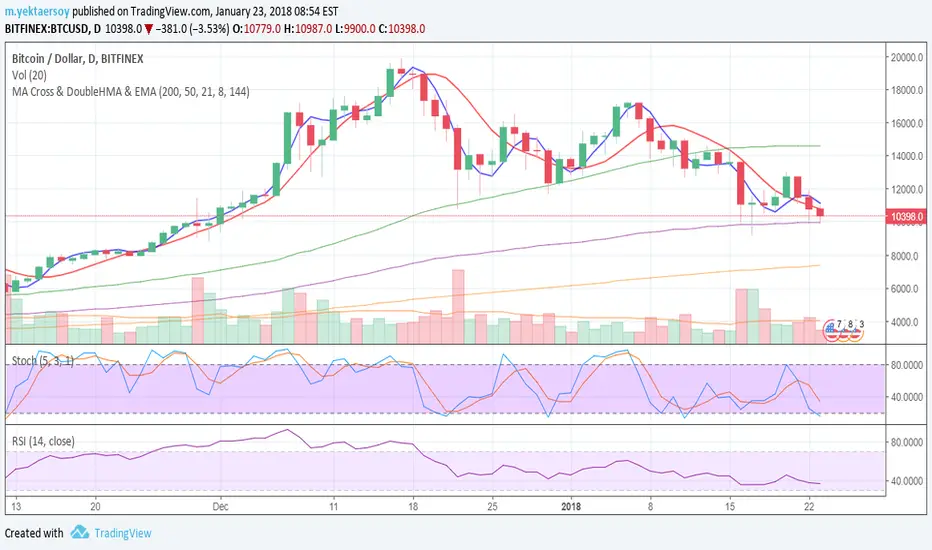
Multiple Moving AverageCombines 3 moving average plot lines into one indicator for easy configuration
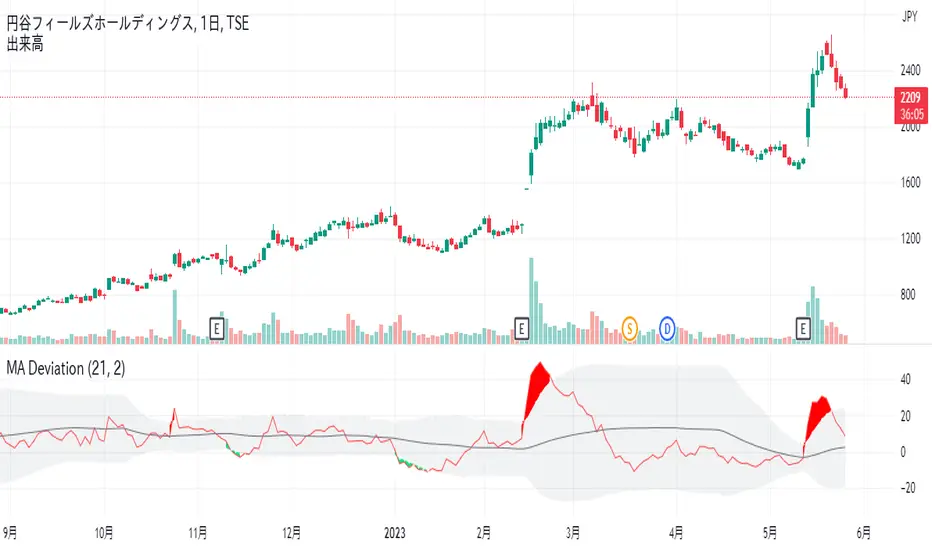
Moving average deviation rateMoving average deviation rate
Simple moving average deviation rate and standard deviation.
The bollinger band is momentum value standard devition.
Bat the bollinger band is not normal distribution to close price.
Moving average deviation rate is normal distribution.
This indicator is draw Moving average deviation rate and fill area 2σ standard devition.
If it exceeds 2σ, it is a trading opportunity.
移動平均かい離率と、2σのバンドです。
ボリンジャーバンドは移動量の標準偏差を描画しますが、終値はボリンジャーバンドに対して正規分布を描きません。
移動平均かい離率は、標準偏差に対して正規分布を示します。
かい離率2σを超えた場合、トレードチャンスです。
Super Guppy MMA [MFWIC]I compiled the new and improved Guppy Multiple Moving Averages. Hope it has some value. Plan your trade and trade your plan!
Easy Multiple Moving AveragesFor easy one on/off clicking. Don't waste your time clicking multiple times.