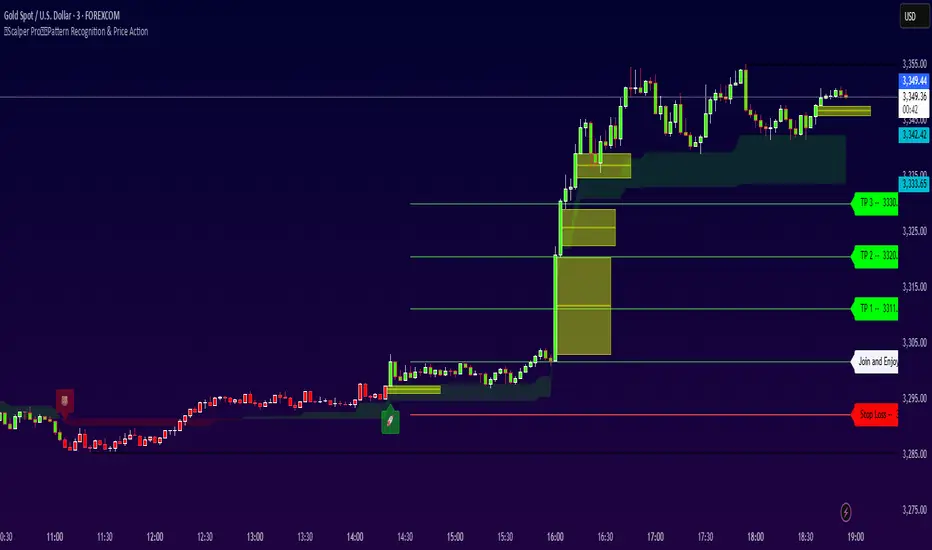
Scalper Pro Pattern Recognition & Price Action👑Scalper Pro®👑Pattern Recognition & Price Action
i.postimg.cc
Introducing the ultimate trading robot designed for serious investors! Our advanced bot analyzes market cycles, tracks targets, sets stop losses, and expertly manages your capital. With powerful algorithms and real-time insights, it identifies opportunities and delivers accurate signals, ensuring you never miss a market move. Take control of your trading strategy and maximize your profits with our cutting-edge technology. Join the future of trading today—your expert assistant is ready to help you succeed!
💡 This is not just another indicator — it's a complete trading assistant that identifies structure, signals strength, and simplifies decision-making.
🚀 Plug it into your TradingView chart today and start seeing the market in a whole new way.
💬 Need help with access, backtesting, or have any questions about our indicators?
Our support team is available 24/7 on Telegram.
Just reach out through the link below: 👉 t.me
Moving Averages
HMA Strategy HMA Strat (Hull Moving Average Strategy) Indicator Description
The HMA Strat is a trend-following strategy that uses a dual Hull Moving Average system. It helps identify continuation and high-probability reversal signals in both bullish and bearish market conditions. The strategy aims to reduce noise while maintaining sensitivity to changes in price momentum by comparing the standard Hull Moving Average (HMA) to a smoothed version.
This strategy is ideal for traders who focus on systematic backtesting, momentum entry, and simple charts. It features integrated plotting, color-zoning, and strategic actions based on TradingView's strategy engine. The system provides dynamic long and short signals based on crossover logic.
Key Features
Dual HMA Framework: To improve signal quality and reduce choppy trend identification, it compares a regular HMA with a smoothed version (HMA3).
Entries Based on Crossover
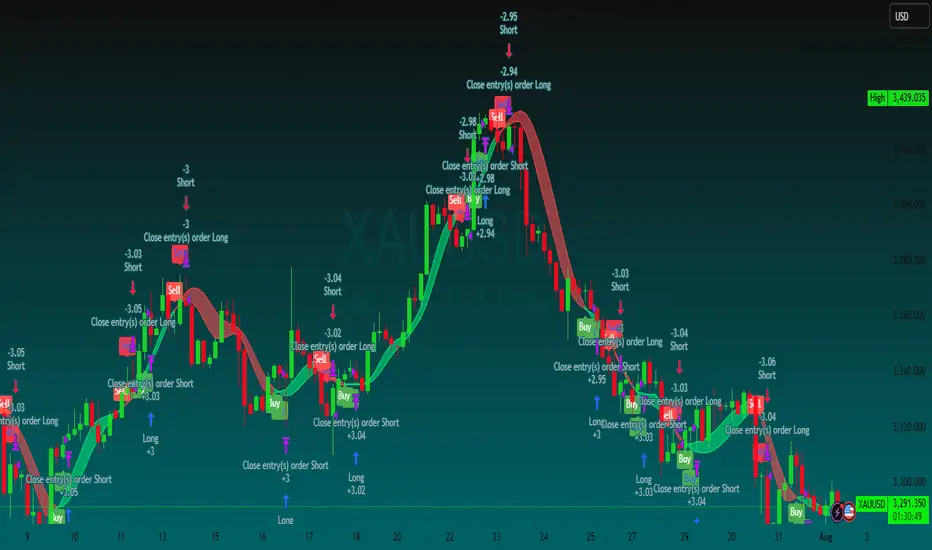
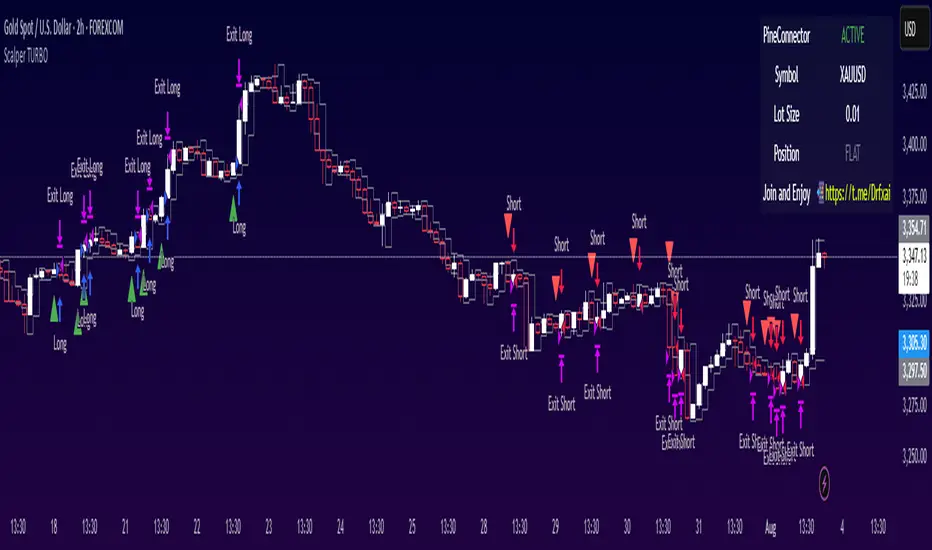
GOD Scalper TURBO Pattern Recognition & Price Action🚀 Introducing: 👑Scalper TURBO👑 – Your Ultimate TradingView Companion for High-Speed Scalping & Auto-Trading!
Trade Smarter. Trade Faster. Trade Automated.
The world's fastest scalper robot with the ability to analyze and trade in second-by-second time frames with an incredible 900% monthly profitability.
🔥 What is 👑Scalper TURBO👑?
Scalper TURBO is a high-performance Pine Script 5 strategy designed for aggressive and intelligent scalping on TradingView. It combines breakout detection, multi-indicator confirmation, time-based filtering, and full PineConnector integration for automated live trading with MetaTrader 5 (MT5). Whether you want to backtest, trade manually, or connect with MT5 via PineConnector – this tool is your edge.
⚙️ Key Features
✅ Fast Execution Logic — Uses real-time tick data with calc_on_every_tick=true
✅ EMA, SMA, RSI & ATR Filters — Combines trend, momentum, and volatility in one strategy
✅ Breakout Strategy — Trades breakouts above resistance or below support
✅ Multi-Time Filter Zones — 4 customizable intraday trading windows to avoid choppy hours
✅ PineConnector-Ready — Seamless alerts for auto-trading with MT5, customizable lot sizes
✅ Dynamic Stop Loss / Take Profit — Based on ATR multipliers for adaptable risk
✅ Trail Stop Support — Optional trailing stop-loss system
✅ Built-in Risk Labels — Live performance and signal info right on the chart
✅ Minimal Resource Usage — Pre-computed constants and cached indicators for speed
✅ Recommended Use Cases:
XAUUSD / Gold scalping (default)
1m to 5m charts (for high-frequency setups)
Live auto-trading via PineConnector
Backtesting and optimization with historical data
🧠 Pro Tips
For best results, run it during high-volume market hours (enable time filters like London/NY session).
Use trailing stop in volatile assets for maximizing gains.
Integrate with PineConnector Pro for seamless MT5 execution.
Combine with your own overlays or confirmation tools.
📣 Join the Movement
💬 Created by @DrFXAi – follow on TradingView for updates, improvements, and more elite scripts.
🚀 Ready to Automate Your Edge?
📌 Add 👑Scalper TURBO👑 to your chart today and take control of your scalping game with automation, speed, and intelligence!
💬 Need help with access, backtesting, or have any questions about our indicators?
Our support team is available 24/7 on Telegram.
Just reach out through the link below: 👉 t.me
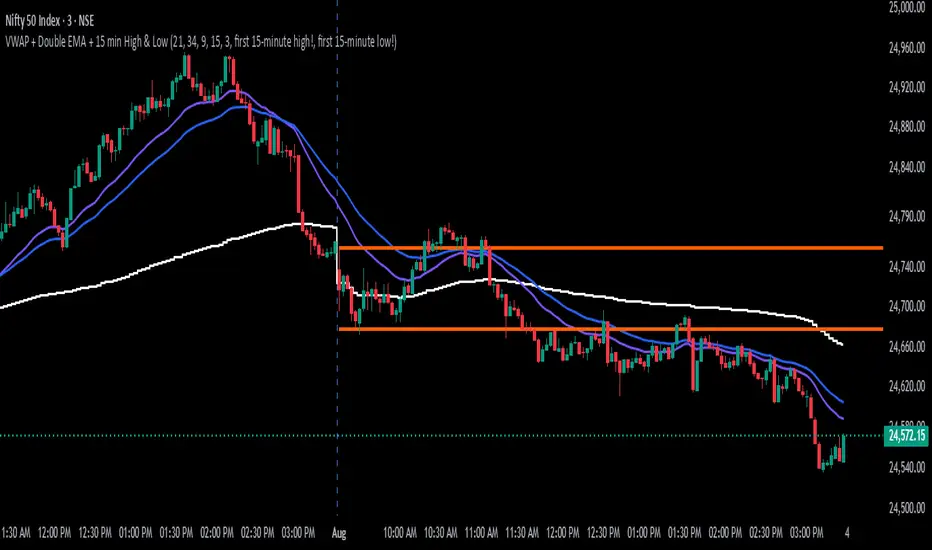
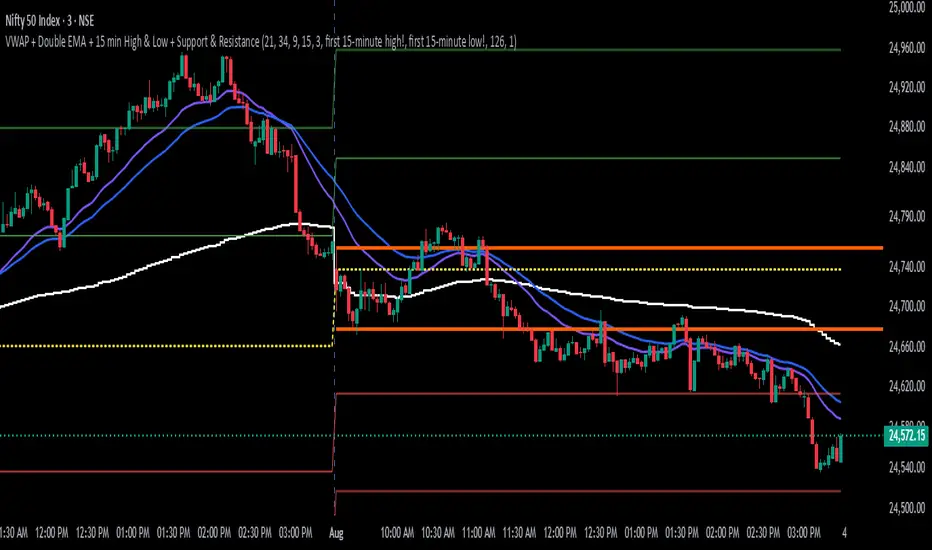
Intraday SmartVWAP + Double EMA + 15 min High & Low
The indicator is for intraday, shows the below.
1. VWAP
2. EMA's
3. First 15 mins High and Low
Recommended time frame is 3 minutes.
Intraday Smart PlusIntraday Smart Plus
The indicator is for intraday day, shows the below.
1. VWAP
2. Day Open Line
3. First 15 minutes High and Low
4. Support and Resistance Lines
Recommended time frame is 3 minutes
Golden Launch Pad🔰 Golden Launch Pad
This indicator identifies high-probability bullish setups by analyzing the relationship between multiple moving averages (MAs). A “Golden Launch Pad” is formed when the following five conditions are met simultaneously:
📌 Launch Pad Criteria (all must be true):
MAs Are Tightly Grouped
The selected MAs must be close together, measured using the Z-score spread — the difference between the highest and lowest Z-scores of the MAs.
Z-scores are calculated relative to the average and standard deviation of price over a user-defined window.
This normalizes MA distance based on volatility, making the signal adaptive across different assets.
MAs Are Bullishly Stacked
The MAs must be in strict ascending order: MA1 > MA2 > MA3 > ... > MA(n).
This ensures the short-term trend leads the longer-term trend — a classic sign of bullish structure.
All MAs Have Positive Slope
Each MA must be rising, based on a lookback period that is a percentage of its length (e.g. 30% of the MA’s bars).
This confirms momentum and avoids signals during sideways or weakening trends.
Price Is Above the Fastest MA
The current close must be higher than the first (fastest) moving average.
This adds a momentum filter and reduces false positives.
Price Is Near the MA Cluster
The current price must be close to the average of all selected MAs.
Proximity is measured in standard deviations (e.g. within 1.0), ensuring the price hasn't already made a large move away from the setup zone.
⚙️ Customization Options:
Use 2 to 6 MAs for the stack
Choose from SMA, EMA, WMA, VWMA for each MA
Adjustable Z-score window and spread threshold
Dynamic slope lookback based on MA length
Volatility-adjusted price proximity filter
🧠 Use Case:
This indicator helps traders visually and systematically detect strong continuation setups — often appearing before breakouts or sustained uptrends. It works well on intraday, swing, and positional timeframes across all asset classes.
For best results, combine with volume, breakout structure, or multi-timeframe confirmation.

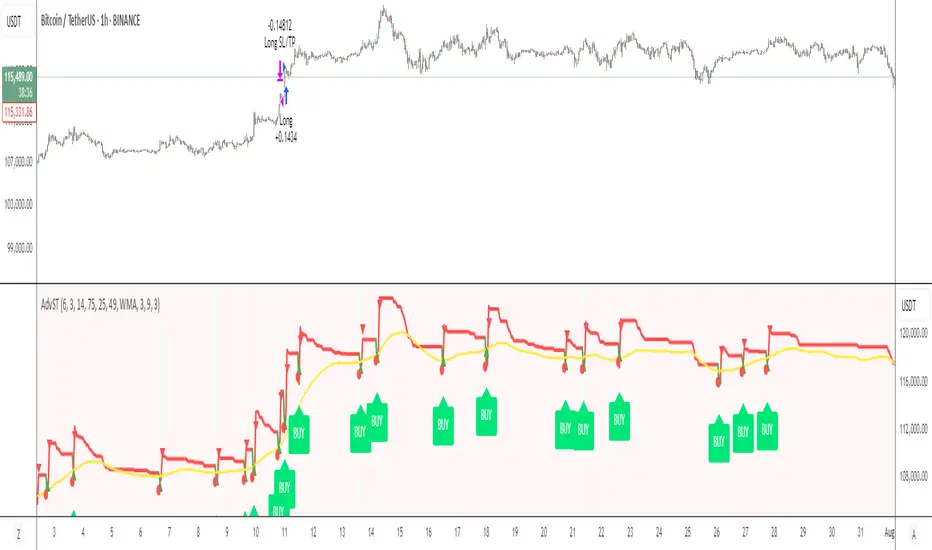
Advanced Supertrend StrategyA comprehensive Pine Script v5 strategy featuring an enhanced Supertrend indicator with multiple technical filters, risk management, and advanced signal confirmation for automated trading on TradingView.
## Features
- **Enhanced Supertrend**: Configurable ATR-based trend following with improved accuracy
- **RSI Filter**: Optional RSI-based signal filtering to avoid overbought/oversold conditions
- **Moving Average Filter**: Trend confirmation using SMA/EMA/WMA with customizable periods
- **Risk Management**: Built-in stop-loss and take-profit based on ATR multiples
- **Trend Strength Analysis**: Filters weak signals by requiring minimum trend duration
- **Breakout Confirmation**: Optional price breakout validation for stronger signals
- **Visual Interface**: Comprehensive chart plotting with multiple indicator overlays
- **Advanced Alerts**: Multiple alert conditions with detailed signal information
- **Backtesting**: Full strategy backtesting with commission and realistic execution
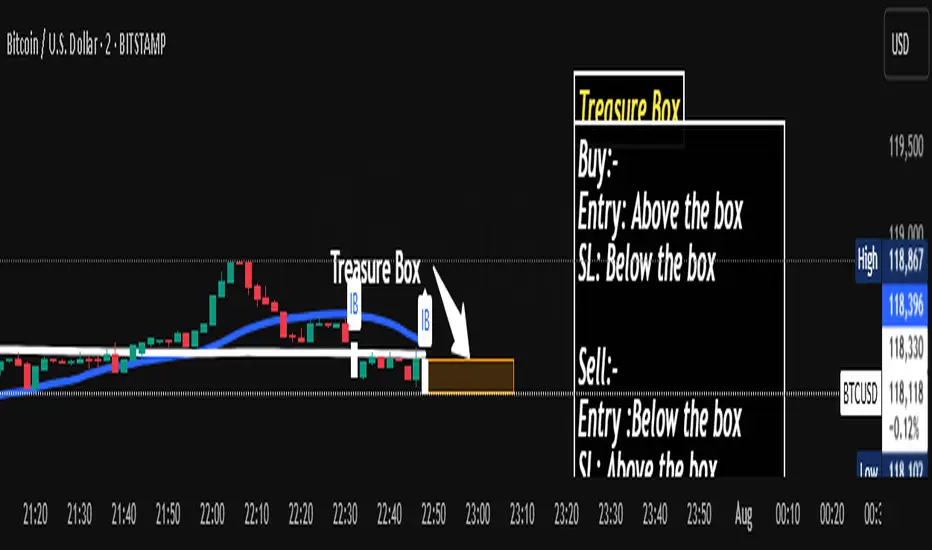
Wx2 Treasure Box – Institutional EntryBuy:-
Entry: Above the box
SL: Below the box
Sell:-
Entry :Below the box
SL: Above the box
RRR: 1:2
Best Location near 200MA
TF: Any TF
Watch My Video:
youtu.be
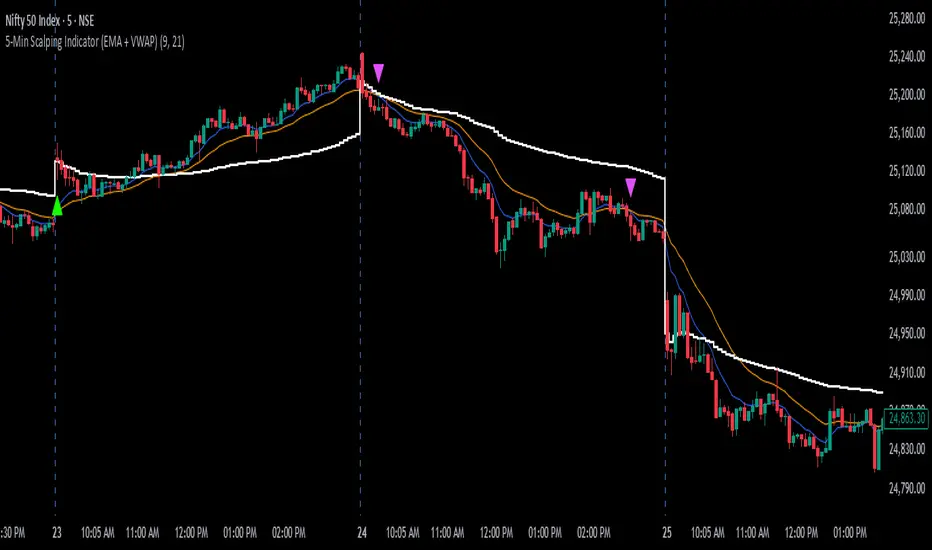
5-Min Scalping Indicator (EMA + VWAP)5-Min Scalping Indicator (EMA + VWAP)
Strategy Logic (for 5-min timeframe):
Long Entry: Price above VWAP, EMA Fast crosses above EMA Slow.
Short Entry: Price below VWAP, EMA Fast crosses below EMA Slow.
Exit: On opposite EMA cross or trailing stop (optional for strategy).
How to Use:
Apply this on a 5-minute chart.
Look for buy signals when:
Fast EMA crosses above Slow EMA.
Price is above VWAP.
Look for sell signals when:
Fast EMA crosses below Slow EMA.
Price is below VWAP.
Combine with price action or volume confirmation for best results.
Wx2 Treasure Box – Institutional Entry🧩 Indicator Overview: Wx2 Treasure Box – Institutional Entry
Designed to detect Institutional Bars (IBs) and visualize high-probability entry zones, this script helps traders align with potential smart-money activity.
Institutional Bars are defined as Entry of Smart Money
⚙️ How It Works
20-period and 200-period Simple Moving Averages are plotted to show short‑ and long‑term trend direction.
On identification of an IB:
A label “IB” is placed above the bar.
A rectangular box is drawn around its high–low range, extending several bars to the right to mark the trade zone
Trade Signals & Setup Guidelines
Buy Entry:
Trigger: Price breaks above the box.
Stop Loss (SL): Set just below the box bottom.
Sell Entry:
Trigger: Price piercing below the box.
SL: Placed above the box top.
Risk-to-Reward Ratio (RRR):
Target RRR of 1:2 is recommended
Best Execution Zone:
Treasure Box is the best with 20SMA+200 SMA+Price in it.
📽️ Video Link
You’ve linked a YouTube video for explanation:
Watch Here

BTC 1m Chop Top/Bottom Reversal (Stable Entries)Strategy Description: BTC 5m Chop Top/Bottom Reversal (Stable Entries)
This strategy is engineered to capture precise reversal points during Bitcoin’s choppy or sideways price action on the 5-minute timeframe. It identifies short-term tops and bottoms using a confluence of volatility bands, momentum indicators, and price structure, optimized for high-probability scalping and intraday reversals.
Core Logic:
Volatility Filter: Uses an EMA with ATR bands to define overextended price zones.
Momentum Divergence: Confirms reversals using RSI and MACD histogram shifts.
Price Action Filter: Requires candle confirmation in the direction of the trade.
Locked Signal Logic: Prevents repaints and disappearing trades by confirming signals only once per bar.
Trade Parameters:
Short Entry: Above upper band + overbought RSI + weakening MACD + bearish candle
Long Entry: Below lower band + oversold RSI + strengthening MACD + bullish candle
Take Profit: ±0.75%
Stop Loss: ±0.4%
This setup is tuned for traders using tight risk control and leverage, where execution precision and minimal drawdown tolerance are critical.

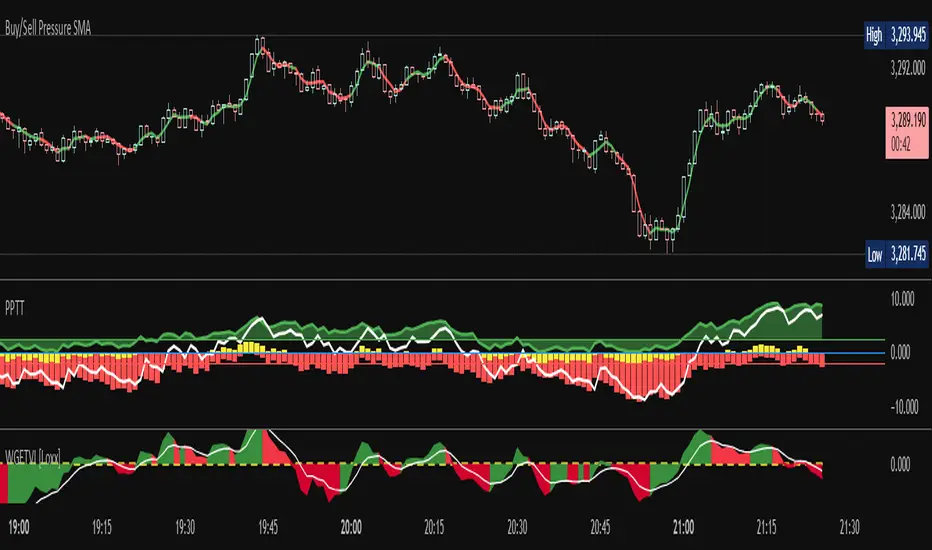
Buy/Sell Demand Pressure SMAThis indicator shows when competing buying and selling pressure has changed.
When bullish buying offsets bearish transaction volume, the indicator turns green. When bearish selling pressure offsets bullish buying volume the indicator is red.
Can be used as a normal SMA or to confirm buy/sell signals of other indicators.
Works best at the start of trades...and not exits but if set properly, it is a good indicator of when a trend has reversed.
~ jb tuttle
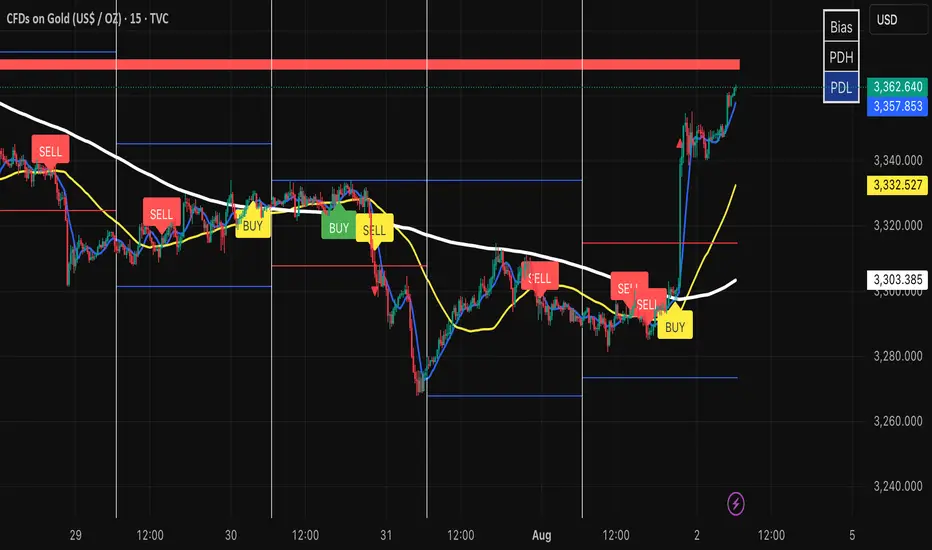
Triple MA Buy & Sell SignalsTriple MA Buy & Sell Signals Indicator
This indicator is designed to help traders identify high-probability entry points based on the combination of three moving averages (8, 50, and 200) while filtering signals in the direction of the main trend.
How It Works
Trend Filter (200 MA)
If the price is above the 200 MA, only BUY signals are displayed.
If the price is below the 200 MA, only SELL signals are displayed.
8 MA and 50 MA Cross (Regular Signals)
BUY (Green): When the 8 MA crosses above the 50 MA, and the price is above the 200 MA.
SELL (Red): When the 8 MA crosses below the 50 MA, and the price is below the 200 MA.
8 MA and 200 MA Cross (Major Trend Signals)
BUY (Yellow): When the 8 MA crosses above the 200 MA.
SELL (Yellow): When the 8 MA crosses below the 200 MA.
Purpose
This indicator is particularly useful for traders who follow Smart Money Concepts (SMC) or ICT-based strategies, as it helps:
Identify trend direction with the 200 MA.
Spot short-term trade entries using the 8/50 MA cross.
Highlight major trend reversals using the 8/200 MA cross.
CnagdaCnagda Indicator ek comprehensive trading tool hai jo multiple technical analysis concepts ko combine karta hai:
special thanks to - tradingview.sweetlogin.com because its modify version of Breaks and Retests with Volatility Stop
Support & Resistance Detection - Dynamic pivot-based levels
Breakout & Retest System - Precise entry/exit signals
Anchored VWAP - Volume-weighted average price from swing points
Volatility Stop - Trend-following mechanism
Moving Average Crossovers - EMA/WMA signals
Smart Alerts - Real-time notifications
🔧 Key Features
Support & Resistance System
Lookback Range: 20 bars (customizable) se pivot points detect karta hai
Dynamic Boxes: Support/resistance levels ko visual boxes ke saath display
Auto-Extension: Levels ko future bars tak extend kar sakta hai
Color Coding: Support (Red) aur Resistance (Green) ke liye alag colors
Anchored VWAP System
Swing High/Low Anchoring: Major swing points se VWAP calculate karta hai
Volume Integration: Price aur volume dono consider karta hai
Dynamic Updates: Har naye swing point par reset hota hai
Visual Markers: Anchor points ko clearly mark karta hai
Breakout Detection
Real-time Alerts: Support/resistance break hone par instant notification
Confirmation Options: Candle close confirmation ya high/low based
Repainting Control: 3 modes - On/Off with different confirmation methods
📈 Entry/Exit Strategy Guide
BUY SIGNALS (Long Entry)
Primary Entry Conditions:
Support Retest Confirmed + Price Above Anchored VWAP
Entry: Support level ka successful retest
Stop Loss: Support level ke neeche 5-10 pips
Target: Next resistance level ya 1:2 Risk-Reward
Bullish MA Crossover + Above Volatility Stop (Green)
Entry: EMA(20) crosses above WMA(50)
Stop Loss: Volatility stop level
Target: Next resistance ya swing high
Resistance Breakout + Volume Confirmation
Entry: Clean breakout above resistance box
Stop Loss: Resistance level (ab support ban gaya)
Target: Measured move ya next major level
Confirmation Filters:
✅ Anchored VWAP upward trending
✅ Volatility Stop showing green (uptrend)
✅ Price above both moving averages
✅ Volume increase during breakout
SELL SIGNALS (Short Entry)
Primary Entry Conditions:
Resistance Retest Confirmed + Price Below Anchored VWAP
Entry: Resistance level ka successful retest
Stop Loss: Resistance level ke upar 5-10 pips
Target: Next support level ya 1:2 Risk-Reward
Bearish MA Crossover + Below Volatility Stop (Red)
Entry: EMA(20) crosses below WMA(50)
Stop Loss: Volatility stop level
Target: Next support ya swing low
Support Breakout + Volume Confirmation
Entry: Clean breakdown below support box
Stop Loss: Support level (ab resistance ban gaya)
Target: Measured move ya next major level
Confirmation Filters:
✅ Anchored VWAP downward trending
✅ Volatility Stop showing red (downtrend)
✅ Price below both moving averages
✅ Volume increase during breakdown
⚠️ Risk Management Rules
Position Sizing
Maximum Risk: 1-2% per trade
Stop Loss: Always mandatory
Position Size: Calculate based on stop distance
Exit Strategy
Profit Targets:
Target 1: 1:1 Risk-Reward (book 50%)
Target 2: 1:2 Risk-Reward (book remaining)
Trailing Stops:
Use Volatility Stop as trailing mechanism
Move stop to breakeven after 1:1 achieved
Time-based Exit:
Exit if no momentum within 5-10 bars
Avoid holding overnight without clear trend
🚨 Alert System
Available Alerts:
New Support/Resistance Levels
Breakout Confirmations
Retest Signals (Potential + Confirmed)
MA Crossovers (Bullish/Bearish)
Anchored VWAP Crosses
Volatility Stop Changes
Alert Messages (Hindi):
"EMA/WMA Bullish crossover hua hai, BUY!"
"EMA/WMA Bearish crossover hua hai, SELL!"
"Price Anchored VWAP ke upar break kar gaya!"
"Naya Anchored VWAP anchor point set hua hai!"
⚙️ Customization Options
Visual Settings:
Label Types: Full descriptions ya Simple (Br, Re, P.Re)
Label Sizes: Tiny to Huge
Colors: Fully customizable for all elements
Line Styles: Dotted, Dashed, Solid
Extensions: None, Right, Left, Both
Technical Parameters:
Lookback Range: 1-100 bars
Retest Detection: 1-20 bars
MA Lengths: Customizable EMA/WMA periods
Volatility Stop: Length aur multiplier adjustable
VWAP Anchoring: Swing detection sensitivity
📋 Best Timeframes
Recommended Usage:
Scalping: 1M, 5M (quick signals)
Day Trading: 15M, 30M, 1H (balanced approach)
Swing Trading: 4H, 1D (major levels)
Market Conditions:
Trending Markets: Excellent for breakout trades
Range-bound: Perfect for retest strategies
High Volatility: Volatility stop works best
Low Volume: Wait for volume confirmation
🎯 Performance Tips
Multi-timeframe Analysis: Higher timeframe trend + lower timeframe entry
Volume Confirmation: Always check volume during breakouts
Market Context: Consider overall market sentiment
News Events: Avoid trading during major announcements
Backtesting: Test on historical data before live trading

DEMACROSSOVA BY FLACODouble EMAs for entry signals
ATR Bands for stoploss
Fibonacci bollinger bands for early exit confirmation

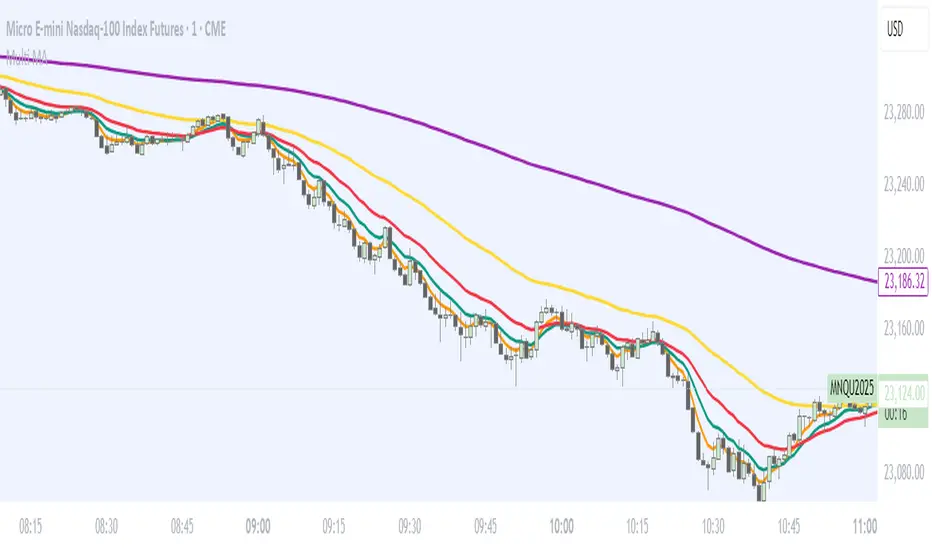
Moving Average RibbonMoving Averages creating a what I call internally a "ribbon". Rename as see fit.

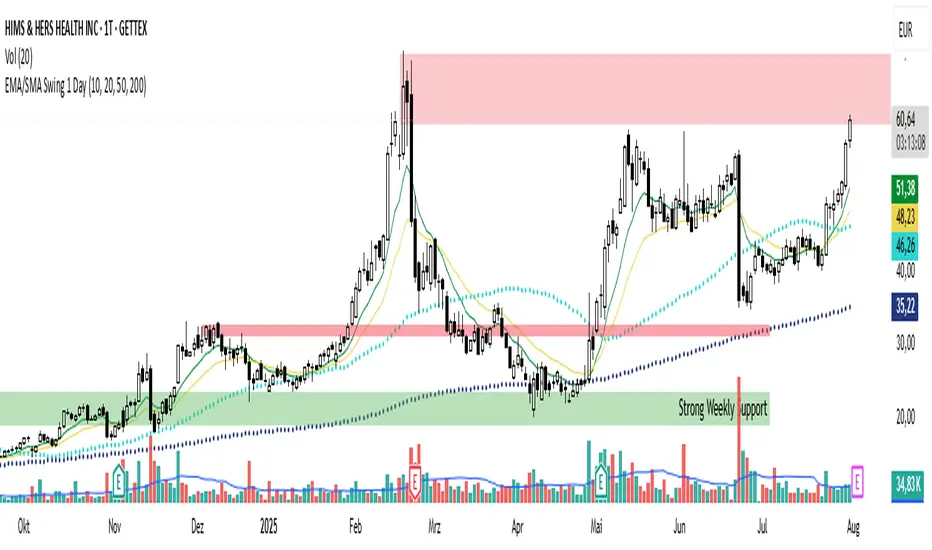
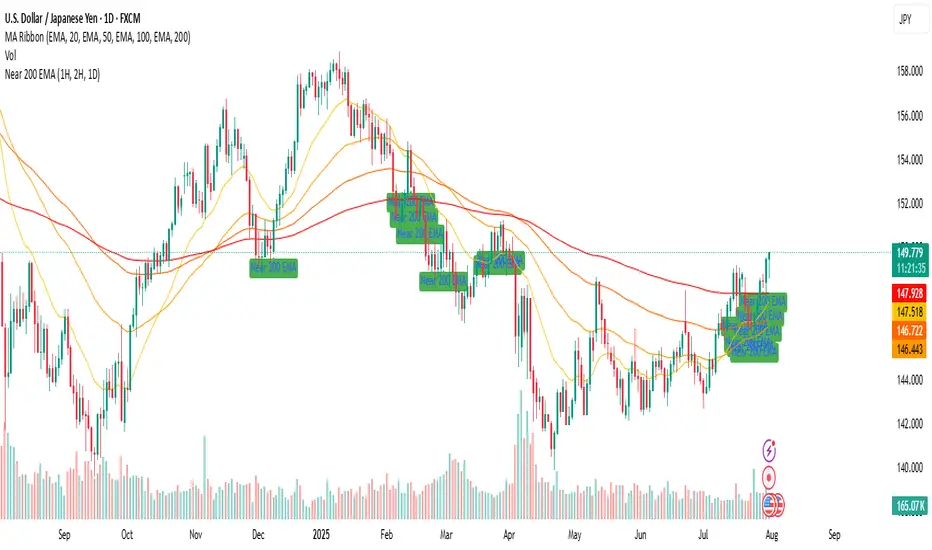
EMA 10,20 SMA 50, 200This indicator is very helpful for swing traders who plan their trades using EMAs and SMAs. It is used on the daily chart and displays the 10- and 20-EMA, as well as the 50- and 200-SMA.
Multi Averages - CustomizableThis script adds up to 5 moving averages to your plot!
Both type and length are customizable.
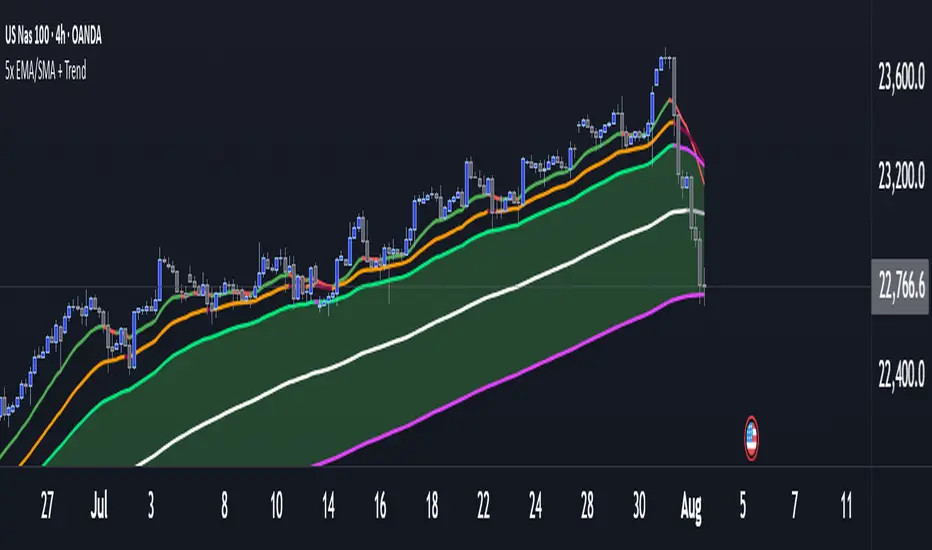
Multi 5x EMA/SMA Colored + EMA Trend Cloud- Ok so these are the settings to the ema's
15
30
50
115
200
Remember these ema's change color depending if the market is bullish or bearish, so choose what colors you want to see bullish and what colors you want to see Bearish
You can also toggle them on or off if you want.
- These are the setting to the trend cloud so you know if the market is bullish or Bearish
50
200
200
Toggle off all plots and only have plots background on
Near 200 EMA (1H, 2H, 1D) (Aditi Varshney )it will show if the price of script is near 1 h , 2 h , and 1 D or not .
MA wiht Logistic [Jsk]This script is published for educational purposes only and does not constitute financial advice. Past performance does not guarantee future results. Trade at your own risk; the author accepts no liability for any financial loss incurred.
Concept
• Direction is defined by the relationship between price and two moving averages (Fast & Slow).
Long: Close > Fast MA > Slow MA
Short: Close < Fast MA < Slow MA
• Three independent exit modes are available:
1) None – positions are closed only when an opposite signal appears.
2) Percentage – fixed take-profit / stop-loss expressed in % of entry price (default +20 % / –5 %).
3) Logistic – a dynamic take-profit / stop-loss based on a logistic transformation of unrealised P&L.
Key Inputs
• MA Type: EMA, SMA or WMA
• Fast / Slow MA length
• Exit Mode: None | Percentage | Logistic
• Percentage TP / SL values (active when Exit Mode = Percentage)
• Logistic settings: slope k, midpoint, TP / SL probability thresholds (active when Exit Mode = Logistic)
Recommended Use
The script works on any market or timeframe, but MA-based trend filters usually perform better in assets with smooth, directional moves. Always verify results in the Strategy Tester and account for commissions and slippage.
