AymaN Entry Signal – With HTF + Pin Bar + Multi TP + BE + V1Ayman Entry Signal – Indicator Description
Overview
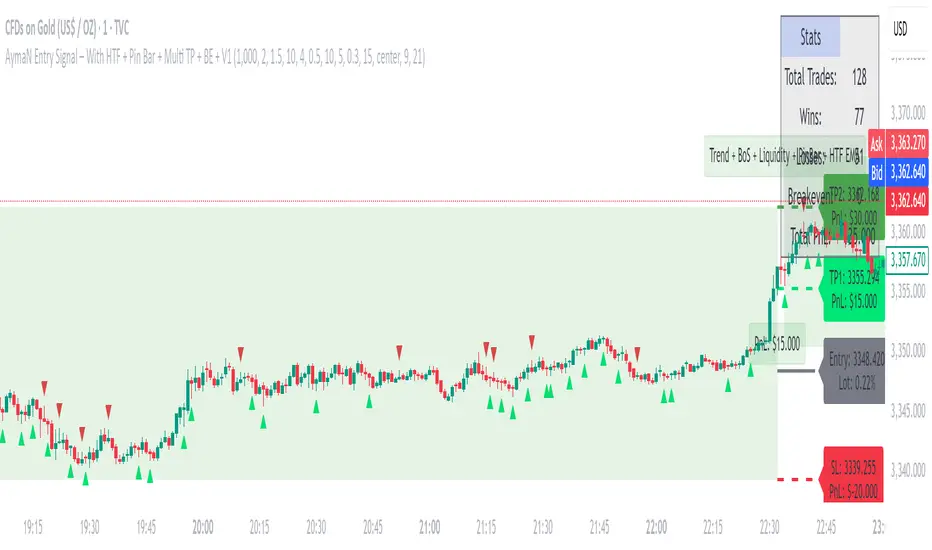
Ayman Entry Signal – With HTF + Pin Bar + Multi TP + BE + Stats Panel (V1)
This is a professional-grade Pine Script indicator designed for scalping and intraday trading, with full trade management, multi-confirmation logic, and advanced visualization. The tool is ideal for traders focused on XAUUSD (Gold), Forex, and other volatile instruments who seek both precision entries and structured exits with dynamic risk control.
Main Features
Advanced Entry Logic:
- EMA fast/slow crossovers (configurable)
- Optional conditions: Break of Structure (BoS), Order Block (OB), Fair Value Gap (FVG), Liquidity sweeps, Pin Bars
- HTF confirmation using EMA or BoS
- Real-time entry condition display
Trade Management:
- Dynamic calculation of Entry, SL (with ATR buffer), TP1, TP2
- Supports Partial Close and Break Even logic after TP1
- Visual PnL label (dynamic and color-coded)
Statistics Panel:
- Shows total trades, win/loss/breakeven count, cumulative PnL
- Filter by custom date or session
- Fully customizable panel appearance
Trade Visualization:
- Trade box includes all trade levels (Entry, SL, TP1, TP2)
- Visual display of trade conditions and PnL result
- Option to keep previous trades on chart
Alert System:
- Alerts for Buy and Sell entries
- Compatible with webhook automation systems like MT5/MT4
Customization & Inputs
- Capital & risk per trade
- Value per pip/point
- SL buffer (ATR-based)
- Manual EMA override
- Enable/disable: EMA, BoS, OB, FVG, Liquidity, Pin Bars
- HTF: timeframe + confirmation logic
- Trade box/labels visibility
- Full color customization
- PnL label position: top, center, or bottom
Recommended Use
- Ideal for Gold scalping (XAUUSD), also effective for Forex
- Best on 1m–15m charts; use HTF confirmation from 15m–4H
- Pairs well with semi-automated systems using alerts and webhooks
Disclaimer
Note: This is a non-executing indicator. It does not place trades but provides visual and statistical guidance for professional manual or semi-automated trading.
Moving Averages
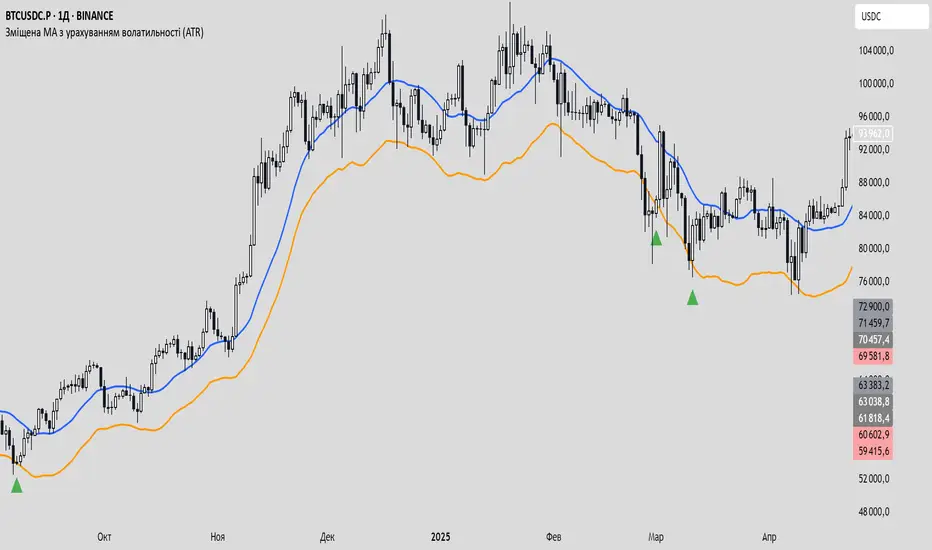
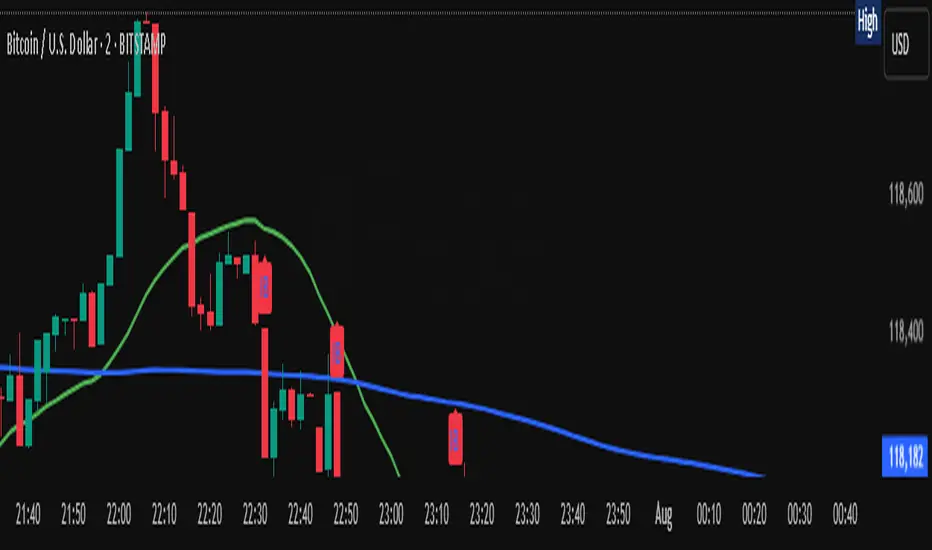
Зміщена MA з урахуванням волатильності (ATR)This is an experimental script designed to mark potential entry points for spot or long futures trades.
It uses a moving average (SMA or EMA) that is dynamically shifted downward based on current ATR (volatility). When the price crosses above this adjusted MA, a potential long entry signal is generated.
A stoploss line is plotted below the adjusted MA — offset
Zero Lag Moving AverageThis indicator is a trend detection tool that highlights significant momentum shifts with reduced lag. It uses two smoothed moving averages—fast and medium ZLEMAs—optionally enhanced with a Kalman filter to reduce noise. The indicator defines a bullish trend when the price is above both ZLEMAs, and bearish when it is below both. Rather than signaling every crossover, it focuses on trend changes, triggering buy or sell signals only when the trend flips (e.g., from bearish to bullish) and confirms those shifts with two filters: rising volume (above the 20-bar average) and a strong trend based on the ADX indicator. Visual features include optional candle coloring to reflect trend direction and signal markers (triangles) plotted only during a user-defined trading session. This setup helps traders act only on confirmed, high-quality momentum shifts, reducing false positives in low-volume or ranging markets.
EMA Cross Approach ScreenerWorks best on D/4H. Signals when the price of a stock is below the 200ema and the 9 and 20 are sloping up approaching the 200 while being 5% or less than from the 200. Helps the trader find a good buying point while keeping risk minimum.

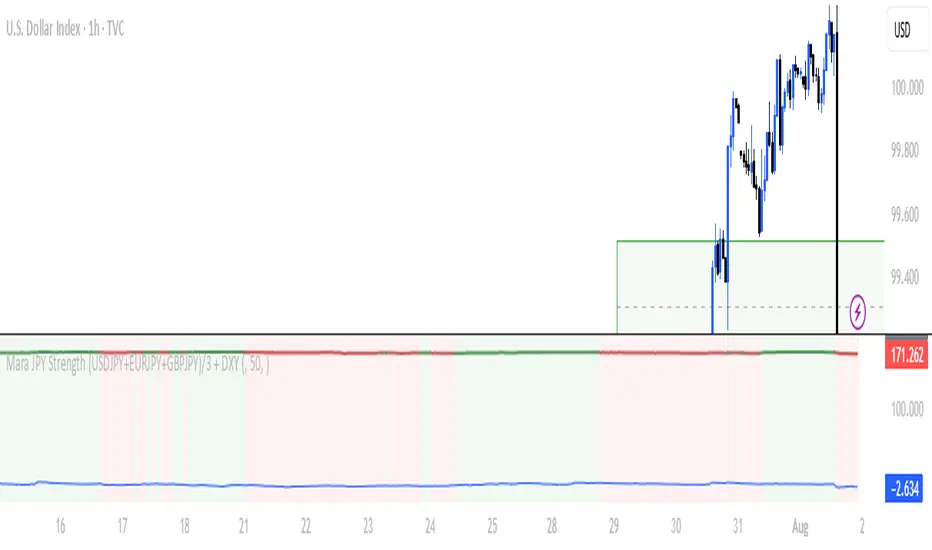
Mara JPY Bias ProMara JPY Bias Pro™ is a precision tool built for serious traders who focus on JPY and USD pairs.
This synthetic index combines USDJPY + EURJPY + GBPJPY, generating a smooth and dynamic representation of JPY strength or weakness. When the line turns green, JPY is weakening — time to look for LONG setups on XXX/JPY pairs. When red, JPY is strengthening — ideal moment for SHORT trades.
Built-in bias logic with adjustable MA-based trend detection or slope/momentum view lets you customize signals based on your strategy.
Plus, we’ve included a normalized DXY overlay, so you can track USD strength in parallel — perfect for traders working with EUR/USD, GBP/USD, USD/JPY and JPY crosses.
💡 Designed for day traders, scalpers, and smart money traders looking for clean confluence.
✅ Features:
Visual color-coded JPY bias (Green = Long / Red = Short)
Optional USD (DXY) strength overlay
Customizable MA length and bias logic
Built-in alerts for bias shifts & momentum flips
🔔 Alert-ready – never miss a reversal.
Trade smarter. Cut the noise. Stay on the right side of the move.

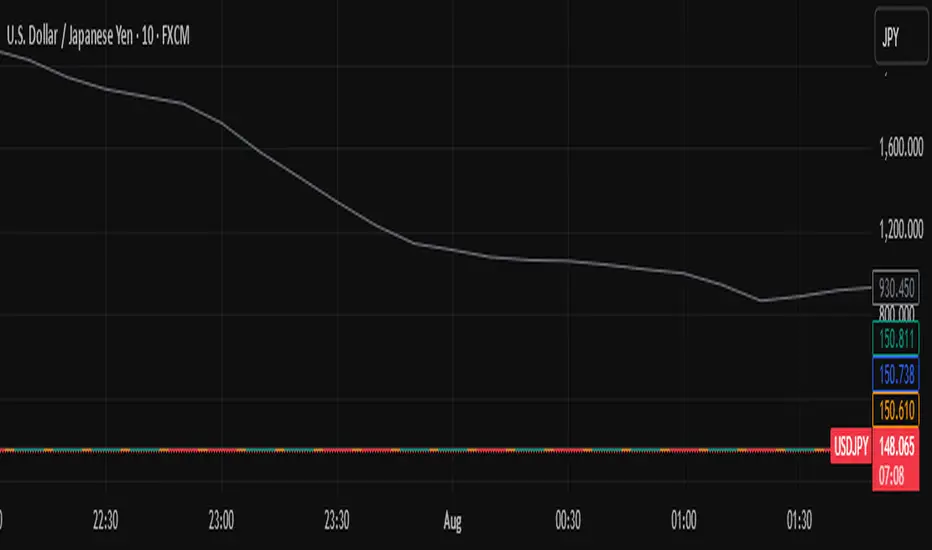
EMA Crossover with Volume + Stacked TP & Trailing SLI am relatively new here. Here is my humble contribution to the community. Simple does it! Ema 21,55 with volume. Surprisingly high win rates and good profit factors on USDJPY, EURJPY, BTCUSD, XAGUSD,XAUUSD, USOIL, USDCAD, EURGBP and AUDNZD. I cannot write a single line of code. I used Copilot for this.
Multi EMA & SMA IndicatorDraws EMA 5/20/50/100 and SMA 200 in different colors and thickness in a single indicator

X1 newbie code trying to create
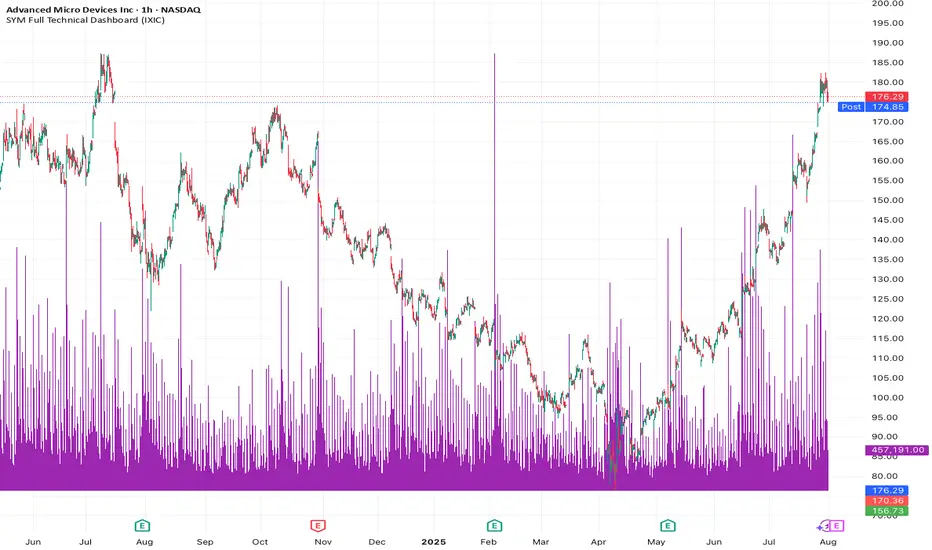
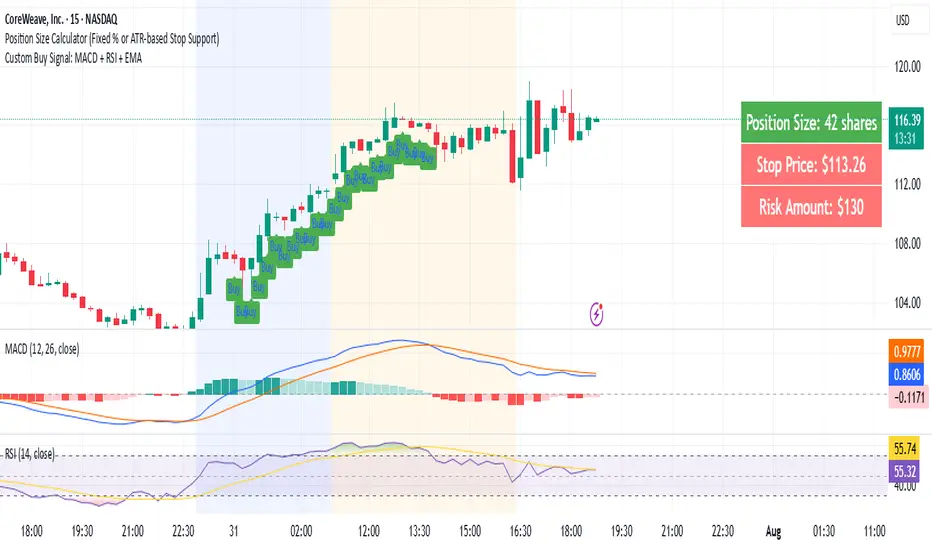
✅ Script Behavior on Other Stocks
• If you’re on a chart for SYM, it calculates indicators using SYM’s data.
• If you switch to NVDA, AVGO, CRDO, etc., it will automatically update to reflect that ticker’s:
• Price
• 50-day moving average
• Volume
• MACD
• RSI
• Index comparison
with 1. 📊 Volume shows in its own pane
2. ✅ MACD and RSI are included in separate panes (as promised)
3. 🎯 Script works cleanly with any ticker
Wx2 Treasure Box Buy- Above the Box and Protect Below the Box
Sell- Below the Box Protect Above the Box
Go for Trigger Order
RRR: 1:2
Best Location is near 200SMA
Time Frame 2Min, 3Min, 5Min, & 15Min
Watch My Video
youtu.be
CnagdaCnagda Indicator ek comprehensive trading tool hai jo multiple technical analysis concepts ko combine karta hai:
special thanks to - tradingview.sweetlogin.com because its modify version of Breaks and Retests with Volatility Stop
Support & Resistance Detection - Dynamic pivot-based levels
Breakout & Retest System - Precise entry/exit signals
Anchored VWAP - Volume-weighted average price from swing points
Volatility Stop - Trend-following mechanism
Moving Average Crossovers - EMA/WMA signals
Smart Alerts - Real-time notifications
🔧 Key Features
Support & Resistance System
Lookback Range: 20 bars (customizable) se pivot points detect karta hai
Dynamic Boxes: Support/resistance levels ko visual boxes ke saath display
Auto-Extension: Levels ko future bars tak extend kar sakta hai
Color Coding: Support (Red) aur Resistance (Green) ke liye alag colors
Anchored VWAP System
Swing High/Low Anchoring: Major swing points se VWAP calculate karta hai
Volume Integration: Price aur volume dono consider karta hai
Dynamic Updates: Har naye swing point par reset hota hai
Visual Markers: Anchor points ko clearly mark karta hai
Breakout Detection
Real-time Alerts: Support/resistance break hone par instant notification
Confirmation Options: Candle close confirmation ya high/low based
Repainting Control: 3 modes - On/Off with different confirmation methods
📈 Entry/Exit Strategy Guide
BUY SIGNALS (Long Entry)
Primary Entry Conditions:
Support Retest Confirmed + Price Above Anchored VWAP
Entry: Support level ka successful retest
Stop Loss: Support level ke neeche 5-10 pips
Target: Next resistance level ya 1:2 Risk-Reward
Bullish MA Crossover + Above Volatility Stop (Green)
Entry: EMA(20) crosses above WMA(50)
Stop Loss: Volatility stop level
Target: Next resistance ya swing high
Resistance Breakout + Volume Confirmation
Entry: Clean breakout above resistance box
Stop Loss: Resistance level (ab support ban gaya)
Target: Measured move ya next major level
Confirmation Filters:
✅ Anchored VWAP upward trending
✅ Volatility Stop showing green (uptrend)
✅ Price above both moving averages
✅ Volume increase during breakout
SELL SIGNALS (Short Entry)
Primary Entry Conditions:
Resistance Retest Confirmed + Price Below Anchored VWAP
Entry: Resistance level ka successful retest
Stop Loss: Resistance level ke upar 5-10 pips
Target: Next support level ya 1:2 Risk-Reward
Bearish MA Crossover + Below Volatility Stop (Red)
Entry: EMA(20) crosses below WMA(50)
Stop Loss: Volatility stop level
Target: Next support ya swing low
Support Breakout + Volume Confirmation
Entry: Clean breakdown below support box
Stop Loss: Support level (ab resistance ban gaya)
Target: Measured move ya next major level
Confirmation Filters:
✅ Anchored VWAP downward trending
✅ Volatility Stop showing red (downtrend)
✅ Price below both moving averages
✅ Volume increase during breakdown
⚠️ Risk Management Rules
Position Sizing
Maximum Risk: 1-2% per trade
Stop Loss: Always mandatory
Position Size: Calculate based on stop distance
Exit Strategy
Profit Targets:
Target 1: 1:1 Risk-Reward (book 50%)
Target 2: 1:2 Risk-Reward (book remaining)
Trailing Stops:
Use Volatility Stop as trailing mechanism
Move stop to breakeven after 1:1 achieved
Time-based Exit:
Exit if no momentum within 5-10 bars
Avoid holding overnight without clear trend
🚨 Alert System
Available Alerts:
New Support/Resistance Levels
Breakout Confirmations
Retest Signals (Potential + Confirmed)
MA Crossovers (Bullish/Bearish)
Anchored VWAP Crosses
Volatility Stop Changes
Alert Messages (Hindi):
"EMA/WMA Bullish crossover hua hai, BUY!"
"EMA/WMA Bearish crossover hua hai, SELL!"
"Price Anchored VWAP ke upar break kar gaya!"
"Naya Anchored VWAP anchor point set hua hai!"
⚙️ Customization Options
Visual Settings:
Label Types: Full descriptions ya Simple (Br, Re, P.Re)
Label Sizes: Tiny to Huge
Colors: Fully customizable for all elements
Line Styles: Dotted, Dashed, Solid
Extensions: None, Right, Left, Both
Technical Parameters:
Lookback Range: 1-100 bars
Retest Detection: 1-20 bars
MA Lengths: Customizable EMA/WMA periods
Volatility Stop: Length aur multiplier adjustable
VWAP Anchoring: Swing detection sensitivity
📋 Best Timeframes
Recommended Usage:
Scalping: 1M, 5M (quick signals)
Day Trading: 15M, 30M, 1H (balanced approach)
Swing Trading: 4H, 1D (major levels)
Market Conditions:
Trending Markets: Excellent for breakout trades
Range-bound: Perfect for retest strategies
High Volatility: Volatility stop works best
Low Volume: Wait for volume confirmation
🎯 Performance Tips
Multi-timeframe Analysis: Higher timeframe trend + lower timeframe entry
Volume Confirmation: Always check volume during breakouts
Market Context: Consider overall market sentiment
News Events: Avoid trading during major announcements
Backtesting: Test on historical data before live trading

EMA 20/50/200 - M3EDGE Clean Mode™The M3EDGE Clean Mode™ indicator is designed to spot the cleanest, most aligned market phases.
It filters out market noise and highlights only the high-probability trending zones where the odds are in your favor.
How it works:
• Tracks 3 key EMAs (20, 50, 200)
• Confirms directional alignment across short, medium, and long-term trends
• Colors optimal market phases to identify high-probability setups
• Optional display of the dynamic EMA50/EMA200 zone to visualize the trend’s core
Purpose:
🎯 Avoid choppy, sideways market conditions
🎯 Focus only on smooth, directional price moves
🎯 Reduce false signals and improve chart clarity
Best use cases:
• Ideal for scalping, day trading, and swing trading
• Works on all markets: indices, commodities, forex, crypto
• Perfect when combined with macro analysis and other M3EDGE™ setups
💡 Pro tip: The M3EDGE Clean Mode™ isn’t just another indicator — it’s a quality filter that keeps you out of messy conditions. When it lights up, you know the road ahead is clear.
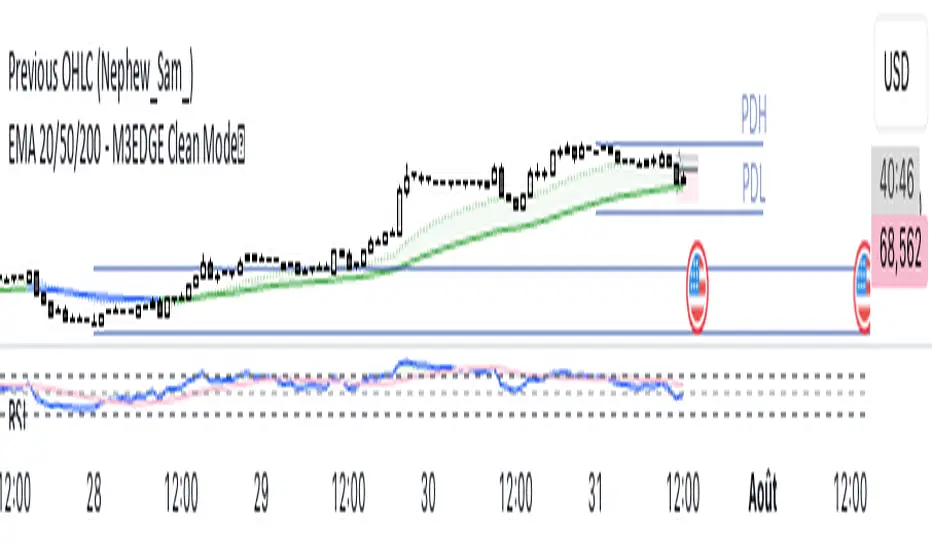
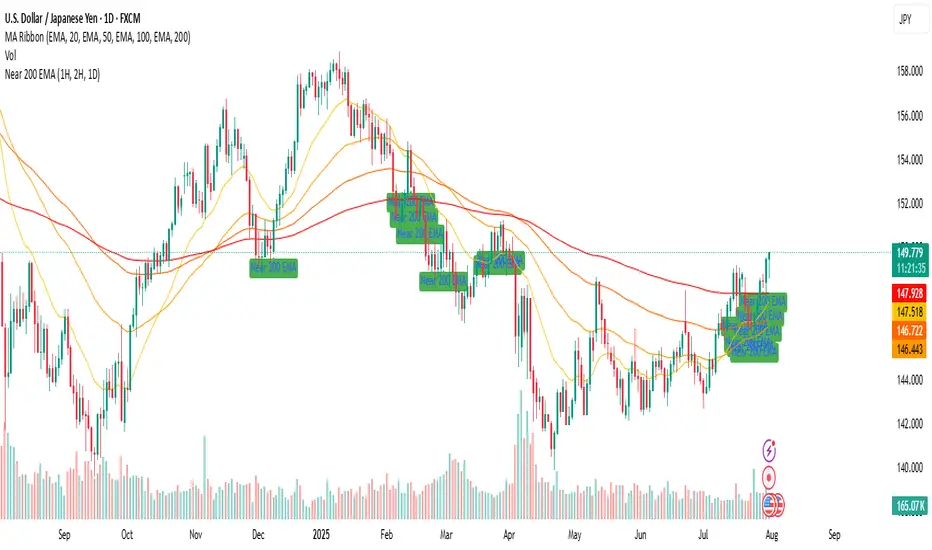
Near 200 EMA (1H, 2H, 1D) (Aditi Varshney )it will show if the price of script is near 1 h , 2 h , and 1 D or not .
MA wiht Logistic [Jsk]This script is published for educational purposes only and does not constitute financial advice. Past performance does not guarantee future results. Trade at your own risk; the author accepts no liability for any financial loss incurred.
Concept
• Direction is defined by the relationship between price and two moving averages (Fast & Slow).
Long: Close > Fast MA > Slow MA
Short: Close < Fast MA < Slow MA
• Three independent exit modes are available:
1) None – positions are closed only when an opposite signal appears.
2) Percentage – fixed take-profit / stop-loss expressed in % of entry price (default +20 % / –5 %).
3) Logistic – a dynamic take-profit / stop-loss based on a logistic transformation of unrealised P&L.
Key Inputs
• MA Type: EMA, SMA or WMA
• Fast / Slow MA length
• Exit Mode: None | Percentage | Logistic
• Percentage TP / SL values (active when Exit Mode = Percentage)
• Logistic settings: slope k, midpoint, TP / SL probability thresholds (active when Exit Mode = Logistic)
Recommended Use
The script works on any market or timeframe, but MA-based trend filters usually perform better in assets with smooth, directional moves. Always verify results in the Strategy Tester and account for commissions and slippage.

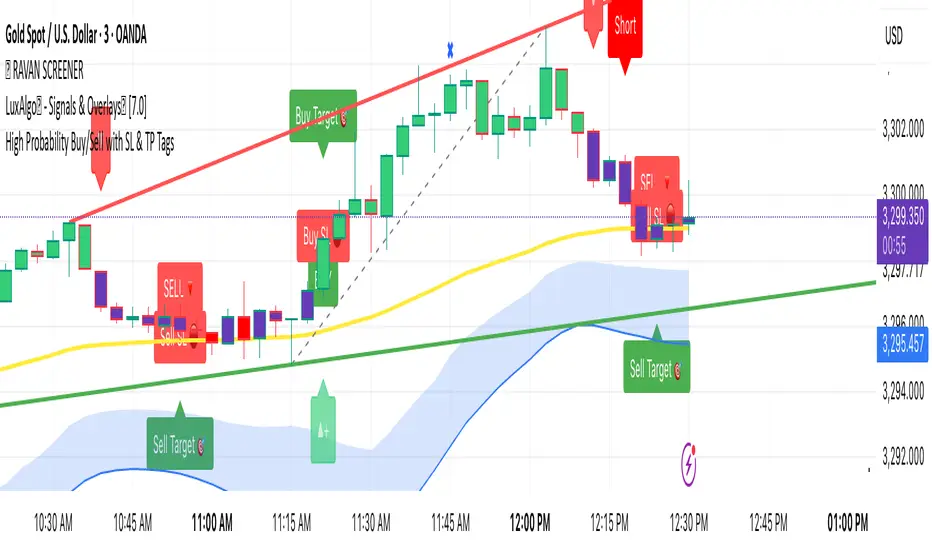
High Probability Buy/Sell with SL & TP High-accuracy Buy/Sell signals with dynamic SL & Target—perfect for scalpers and swing traders,Smart trading signals with built-in risk management. Never miss a move.Auto Buy/Sell entries with real-time SL & TP levels—trade with confidence.Turn signals into strategy. Precision entries, clear exits.Your all-in-one trading assistant: entry, stop loss, and take profit—automated.Built for serious traders: Clean signals, sharp exits, and solid risk-reward.
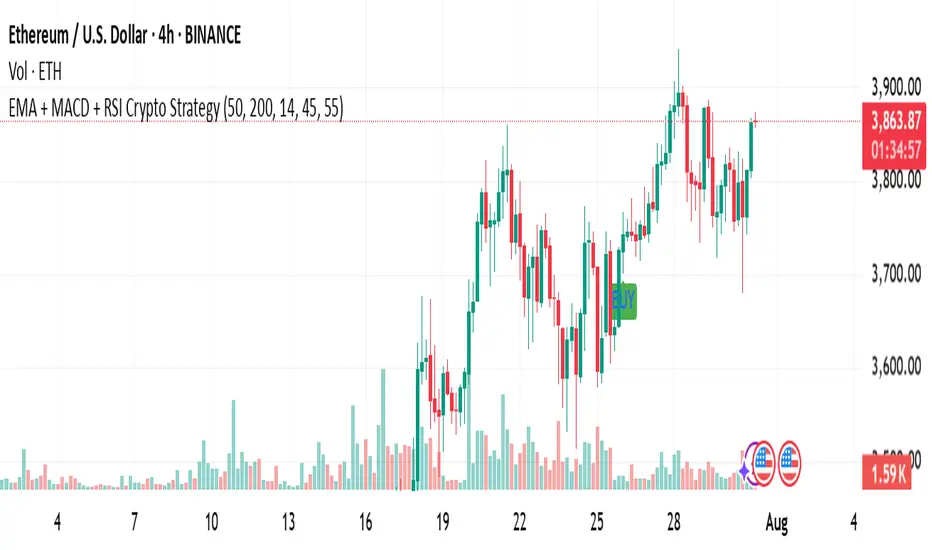
1EMA + 1MACD + 1RSI Crypto Strategy AB 092Title: EMA + MACD + RSI Crypto Strategy
Overview:
This is a trend-following and momentum-based crypto trading strategy built for 1H, 4H, and 1D timeframes, combining three proven indicators:
EMA 50 & EMA 200 Crossover – identifies long-term trend direction.
MACD Crossover (12, 26, 9) – confirms momentum shift.
RSI Filter (14) – avoids overbought/oversold traps and refines entries.
Buy Entry Conditions:
EMA 50 > EMA 200 (Golden Cross)
MACD line crosses above signal line
RSI is between 45 and 70
Sell Entry Conditions:
EMA 50 < EMA 200 (Death Cross)
MACD line crosses below signal line
RSI is between 30 and 55
Risk Management:
Configurable Take Profit and Stop Loss percentages via inputs.
Default: 3% TP, 1.5% SL (adjustable based on timeframe and asset volatility).
Best For:
Intraday trades on 1H (BTC, ETH, SOL)
Swing trades on 4H
Position entries on 1D (top 50 altcoins)
This script includes visual Buy/Sell signals, alert conditions, and customizable SL/TP logic — making it a clean, actionable, and reliable strategy for crypto traders.
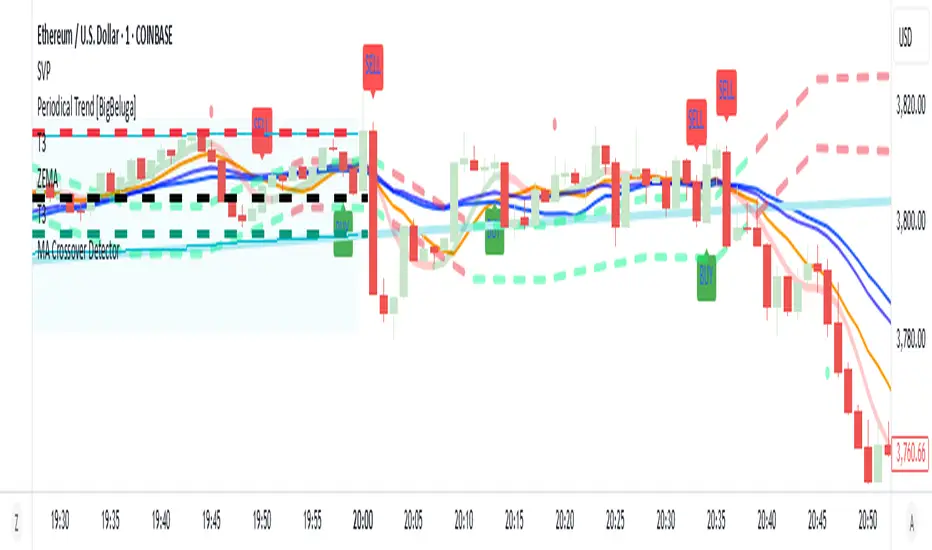
MA Crossover Detector
The Moving Average Crossover Detector is a custom indicator that visually shows buy and sell signals clearly on the chart. based on the crossing of two moving averages — a popular and beginner-friendly tool in technical analysis.
It plots two moving averages — One fast (short period) and one slow (long period) — and highlights crossover points:
✅ Buy Signal (Golden Cross) – When the fast MA crosses above the slow MA.
❌ Sell Signal (Death Cross) – When the fast MA crosses below the slow MA.
✅ Features
Visual: Clearly shows crossovers on the chart.
Customizable: Choose periods, types, styles, etc.
Alert-ready: You can set alerts for crossovers.
The Moving Average (MA) Crossover Strategy is one of the simplest and most widely used strategies in technical analysis for trading stocks, forex, crypto, and other markets. It relies on the interaction between two moving averages to generate buy and sell signals.
Core Components
Short-Term Moving Average (Fast MA) : Reacts quickly to price changes (e.g., 9-period or 20-period).
Long-Term Moving Average (Slow MA) : Reacts more slowly to price changes (e.g., 21-period or 200-period).
How the Strategy Works
Bullish Crossover (Golden Cross):
Occurs when the fast MA crosses above the slow MA. Interpreted as a buy signal, indicating a potential uptrend.
Bearish Crossover (Death Cross):
Occurs when the fast MA crosses below the slow MA. Interpreted as a sell signal, indicating a potential downtrend.
Common Variants
Short-term trading
9 EMA
21 EMA
Swing trading
20 SMA
50 SMA
Long-term investing
50 SMA
200 SMA
Pros
Easy to understand and implement
Works well in trending markets
Can be automated for backtesting and execution
Cons
Lagging indicator: MAs are based on past prices, so signals come after the move has started.
Choppy markets = whipsaws: Generates false signals in sideways/range-bound conditions.
May underperform in volatile or mean-reverting environments
Tips for Improvement
Use confirmation tools : e.g., RSI, MACD, volume analysis, price action
Add filters : Trend filter (ADX), volatility filter (ATR), or time filter (session-based)
Combine with price structure : Support/resistance, breakouts, pullbacks
MACD + EMA Zone Filter (with EMAs)How it works:
It plots 4 EMAs (Exponential Moving Averages):
EMA 20 (orange)
EMA 50 (yellow)
EMA 100 (blue)
EMA 200 (red)
A Buy signal is triggered when:
All three EMAs (20, 50, 100) are above EMA 200 (indicating an uptrend)
The MACD line crosses above the Signal line (bullish momentum)
A Sell signal is triggered when:
All three EMAs (20, 50, 100) are below EMA 200 (indicating a downtrend)
The MACD line crosses below the Signal line (bearish momentum)
📊 Visual Features:
Buy/Sell arrows directly on the chart
Background turns green in strong uptrends and red in strong downtrends
Built-in alerts for automation or notifications
🕒 Works on any timeframe, using the current chart's data.
use with fractals indicator for SL, aim for 1:2 RR

MultiMa FxGMulti Moving Average v1
SMA 8 + EMA 21 + EMA 50
Cet indicateur permet de condenser 3 indicateurs en 1 seul.
C'est un test permettant de voir comment cela se comporte dans la réalité de TradingView
================================================================================
Multi Moving Average v1
This indicator is designed for draw 3 moving average with this custom indicator.
This is my first try on TradingView Pine Script.
Color Change EMA 200 (3 Min)- EMA 200 locked on 3 minute time frame
- Color changes red when bearish, and green when bullish.
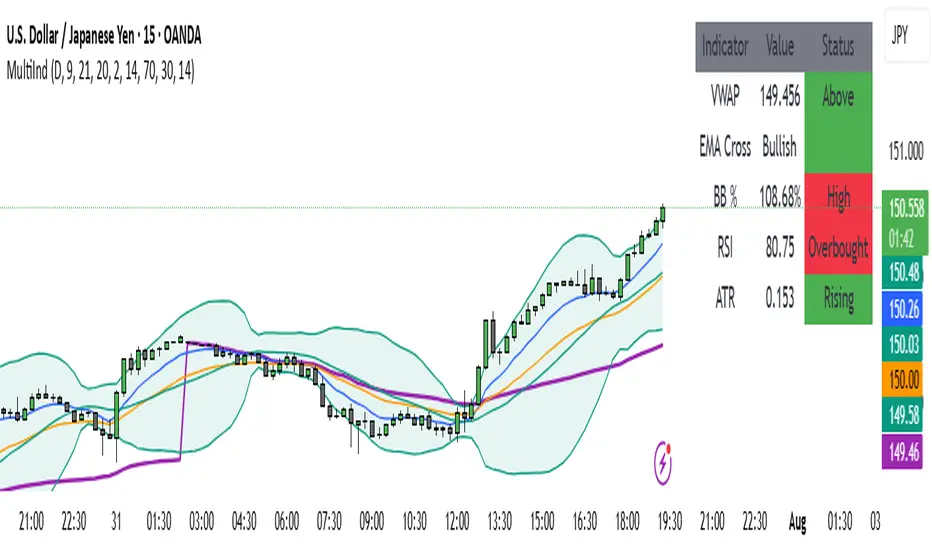
GCM Volatility-Adaptive Trend ChannelScript Description
Name: GCM Volatility-Adaptive Trend Channel (GCM VATC)
Overview
The GCM Volatility-Adaptive Trend Channel (VATC) is a comprehensive trading tool that merges the low-lag, smooth-trending capabilities of the Jurik Moving Average (JMA) with the classic volatility analysis of Bollinger Bands (BB).
By displaying both trend and volatility in a single, intuitive interface, this indicator aims to help traders see when a trend is stable versus when it's becoming volatile and might be poised for a change.
Core Components:
JMA Trend System: At its core are three dynamically colored JMA lines (Baseline, Fast, and Slow) that provide a clear view of trend direction. The lines change color based on their slope, offering immediate visual feedback on momentum. A colored ribbon between the Baseline and Fast JMA visualizes shorter-term momentum shifts.
Standard Bollinger Bands: Layered on top are standard Bollinger Bands. Calculated from the price, these bands serve as a classic measure of market volatility. They help identify periods where the market is expanding (high volatility) or contracting (low volatility).
How to Use It
By combining these two powerful concepts, this indicator provides a unified view of both trend and volatility. It can help traders to:
Identify the primary trend direction using the smooth JMA lines.
Gauge the strength and stability of that trend.
See when the market is becoming volatile (bands widening) or consolidating (bands contracting), which can often precede a significant price move or a change in trend.
A Note on Originality & House Rules Compliance
This indicator does not introduce a new mathematical formula. Instead, its strength lies in the thoughtful combination of two well-respected, publicly available concepts: the Jurik Moving Average and Bollinger Bands. The JMA implementation is a standard public version. The goal was to create a practical, all-in-one tool for trend and volatility analysis.
This script is published as fully open-source in compliance with TradingView's House Rules. It utilizes standard, publicly available algorithms and does not contain any protected or hidden code.
Settings
All lengths, sources, and colors for the JMA lines and Bollinger Bands are fully customizable in the settings menu, allowing you to tailor the indicator to your specific trading style and asset.
I hope with this indicator Traders even Beginner can can control their emotions which increase the probabilities of the winning rates and cutting the losing strength
Purposely I Didn't plant the High low or Buy Sell signals in the chart. Because everything is in the chart where volatility Signal with the Bollinger Band and Buy Sell Signal in the JMA Dynamic colors. and that's enough to decide when to take trade and when not to.
Thank You and Happy Trading