Moving Averages

3x Multi EMA/SMA ColoredThis is a Multi-Colored EMA/SMA Script with 3 ema's that can be toggled on/off and 3 sma's that can be toggled on/off.
Giving you more visibility where price is actually going using 3 ema's at the same time or 3 sma's at the same time allowing you to change the colors when Bearish or Bullish.

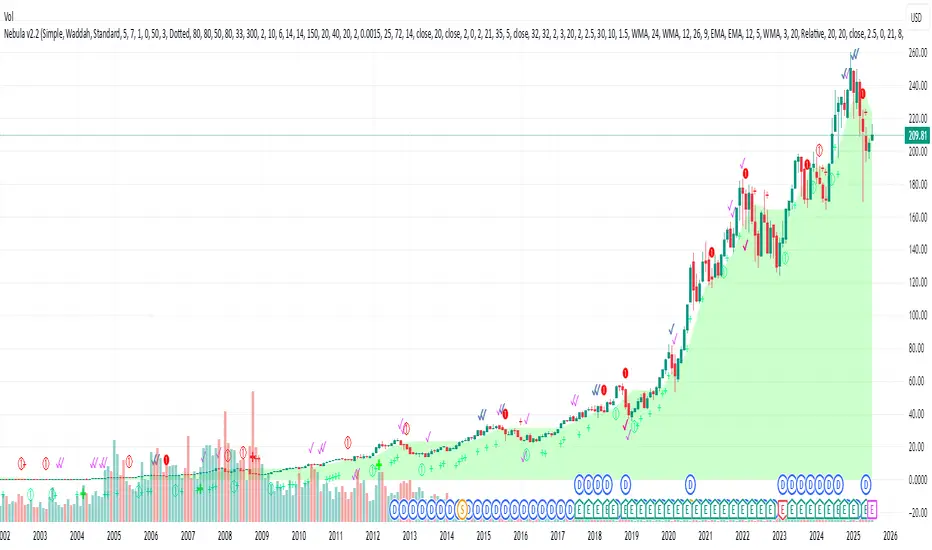
Nebula by CatboyCatboy buy and sell. This indicator will show buy and sell signals on market direction
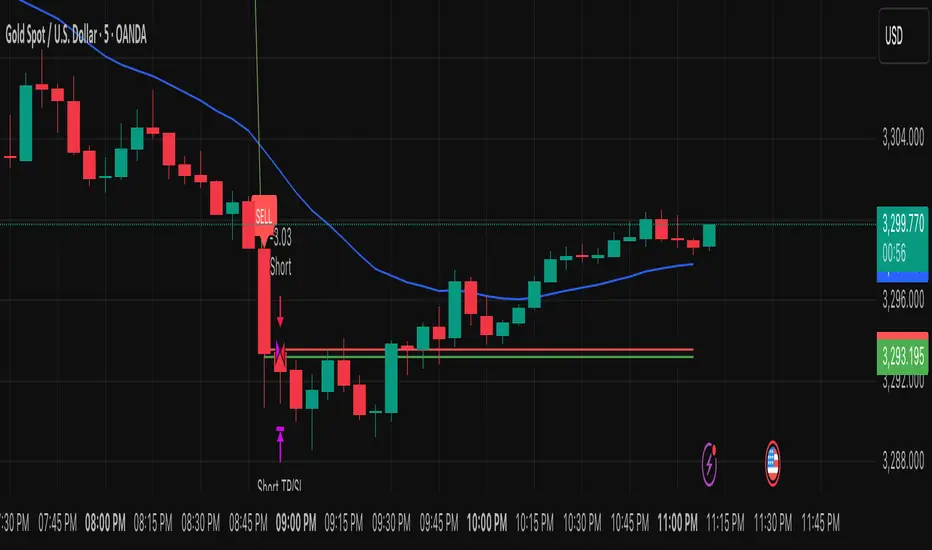
TPC Strategy XAUUSD - M5 with Fixed SL/TPThis script implements a trend-following strategy for XAUUSD on the 5-minute chart, using 200 EMA and 21 EMA to filter direction. Entries are triggered based on RSI, MACD crossovers, and price action alignment. It includes fixed Stop Loss (15 pips) and Take Profit (22.5 pips) with visual SL/TP lines, BUY/SELL labels, and alert conditions for automated notifications. Designed for intraday scalping and low-risk entries during trending conditions.
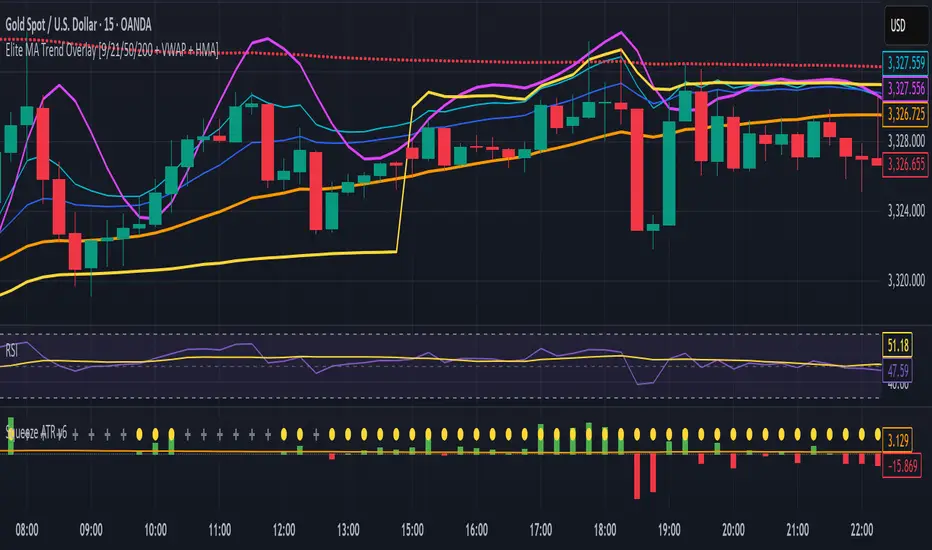
Elite MA Trend Overlay [9/21/50/200 + VWAP + HMA]🔍 What It Is:
The Elite MA Trend Overlay is a professional-grade moving average system built for day traders, scalpers, and swing traders who need clear, visual trend confirmation and precise entry zones across all timeframes.
This overlay combines 5 industry-proven tools into one compact indicator for sniper-level decision making:
EMA 9 – Entry momentum
EMA 21 – Microstructure guide
EMA 50 – Trend bias filter
EMA 200 – Institutional macro direction
VWAP – Intraday fair value (used by pros)
Hull MA (HMA) – Early shift detector
It also features auto-detected trend zones using color-coded background shading to help you instantly know if the market is in a bullish or bearish regime.
🧠 How It Works:
The script dynamically plots the short-term to long-term moving averages to reflect real-time market structure. When all EMAs are aligned in one direction, a colored background highlights the dominant trend:
✅ Green background = Bullish trend (9 > 21 > 50 > 200)
🔻 Red background = Bearish trend (9 < 21 < 50 < 200)
The VWAP line acts as a magnet and decision zone—traders use it for intraday entries or exits. The Hull Moving Average adapts quickly to price shifts, making it perfect for spotting early reversals before the EMAs cross.
🎯 Why It Helps Traders Succeed:
This indicator:
Removes guesswork: Know instantly if you’re in a strong trend or chop zone.
Filters bad trades: Avoid entering against structure or into volatility traps.
Improves timing: Use pullbacks to EMAs or Hull MA flips for sniper entries.
Works across timeframes: From scalping 1-minute to swing trading daily charts.
Whether you're trading gold, forex, stocks, or crypto — this overlay gives you clean, professional structure that keeps you disciplined and sharp.
⚙️ Features:
On/off toggles for VWAP & Hull MA
Minimalist, clutter-free plotting
Auto background color zones
Supports Pine Script v6 (latest version)
👑 Recommended Use:
Confirm trend with background + EMA alignment
Enter on pullbacks to EMA 21 or 50
Use Hull MA or RSI for early reversal detection
Exit at VWAP reversion or trend exhaustion
💬 “Structure is everything. Trade with the flow, not against it.”
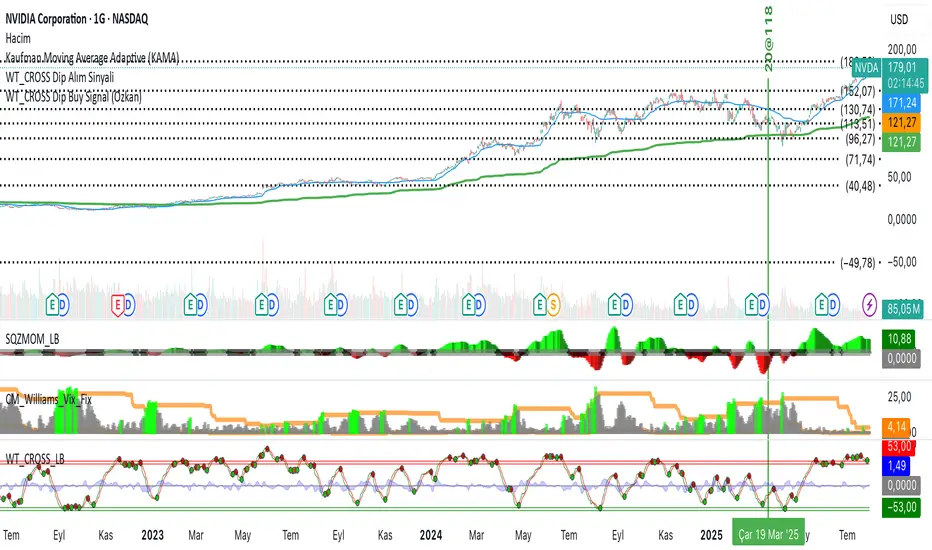
WT_CROSS Dip Buy Signal(ozkan)This script identifies potential buy opportunities based on WaveTrend (WT_CROSS) momentum crossing below the -60 level — often indicating oversold conditions.
Additional filters include price being above the Kaufman Adaptive Moving Average (KAMA) and volume below the 5-period average, which helps isolate pullbacks within an uptrend.
Buy Signal Conditions:
WT1 < -60
Price > KAMA
Volume < 5-period SMA of volume
Purpose:
To capture early entries at possible local bottoms during bullish trends while avoiding high-volume breakdown traps.
🔔 You can also set an alert based on this condition.
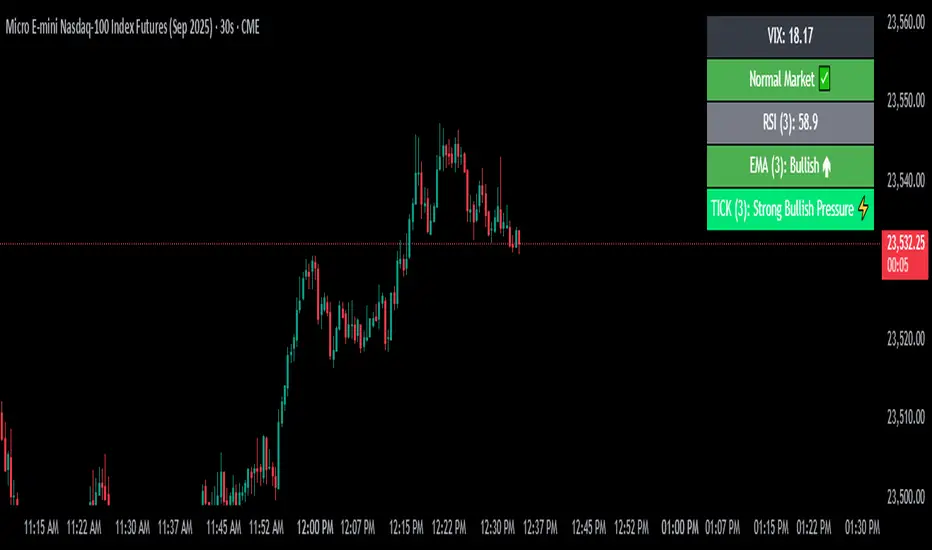
VIX Filter/RSI/EMA Bias/Cum-TICK w/ Exhaustion Zone DashboardThis all-in-one dashboard gives intraday traders a real-time visual read of market conditions, combining volatility regime, trend bias, momentum exhaustion, and internal strength — all in a fully customizable overlay that won’t clutter your chart.
📉 VIX Market Regime Detector
Identifies "Weak", "Normal", "Volatile", or "Danger" market states based on customizable VIX ranges and symbol (e.g., VXN or VIX).
📊 RSI Momentum Readout
Displays real-time RSI from any selected timeframe or symbol, with adjustable length, OB/OS thresholds, and color-coded exhaustion alerts.
📈 EMA Trend Bias Scanner
Compares fast and slow EMAs to define bullish or bearish bias, using your preferred timeframe, symbol, and EMA lengths — ideal for multi-timeframe setups.
🧠 Cumulative TICK Pressure & Exhaustion Engine
Analyzes internal market strength using cumulative TICK data to classify conditions as:
-Strong / Mild Bullish or Bearish Pressure
-Choppy / No Edge
-⚠️ Exhaustion Zones — when raw TICK values hit extreme highs/lows, a separate highlight box appears in the dashboard, warning of potential turning points
All logic is customizable, including TICK symbol, timeframes, thresholds, and lookback periods.
Scalpers and day traders who want fast, visual insight into market internals, exhaustion, and trend bias.
Combo 2/20 EMA & Bandpass Filter by TamarokDescription:
This strategy combines a 2/20 exponential moving average (EMA) crossover with a custom bandpass filter to generate buy and sell signals.
Use the Fast EMA and Slow EMA inputs to adjust trend sensitivity, and the Bandpass Filter Length, Delta, and Zones to fine-tune momentum turns.
Signals occur when both EMA and BPF agree in direction, with optional reversal and time filters.
How to use:
1. Add the script to your chart in TradingView.
2. Adjust the EMA and BP Filter parameters to match your asset’s volatility.
3. Enable ‘Reverse Signals’ to trade counter-trend, or use the time filter to limit sessions.
4. Set alerts on Long Alert and Short Alert for automated notifications.
Inspiration:
Based on HPotter’s original combo strategy (Stocks & Commodities Mar 2010).
Updated to Pine Script v6 with streamlined code and alerts.
WARNING:
For purpose educate only

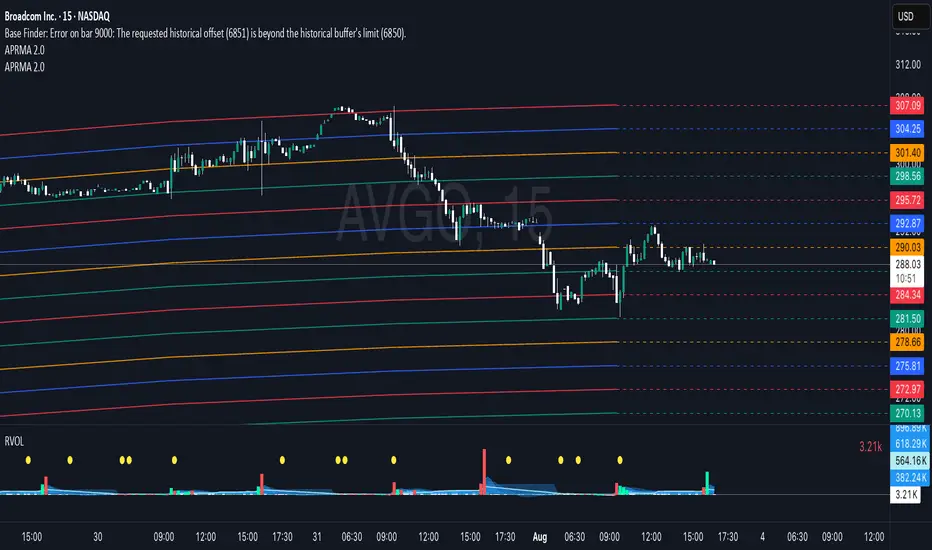
Adjustable Percentage Range Moving Average - Add'l LinesThe Adjustable Percentage Range Moving Average (APRMA), originally developed by @ReallyWendy, is a versatile PineScript indicator designed for traders and market analysts to analyze market volatility and identify trends dynamically. Building on the original concept, this updated version plots a central moving average (MA) with four customizable percentage-based range bands around it. Users can select the MA type (SMA, EMA, HMA, RMA, SWMA, TMA, WMA, VWMA), timeframe, and length, tailoring the indicator to their trading style. Each range band (upper and lower) is calculated as a percentage offset from the MA, with adjustable colors and transparency settings for enhanced visual clarity. Extension lines project the latest values forward, with customizable styles (solid, dashed, dotted). The indicator includes toggleable display options for the MA and each range pair, making it an effective tool for identifying price ranges, support/resistance levels, and trend dynamics.
Credit to @ReallyWendy for the foundational concept.
RSI Divergence(CompactFX)This is the standard "RSI" with "divergence" displayed. Additionally, it has the following features:
- The line color shifts above and below the RSI 50 threshold.
- The MA can be displayed on the RSI.
- Signs of an expected reversal are displayed.
**Examples of Use**
*For Swing Traders
In addition to using the standard RSI, the divergence display can serve as a trigger for further consideration.
*For Scalpers
For athletic traders who prefer intuition over logic and calculation, we recommend customizing the RSI color to your liking for bulls and bears. Consider extending the price until the RSI color changes. Below is my example.
-One-Minute Scalping
When prices are moving above the long-term and short-term MAs, you can hold a position as long as the RSI is above 55 (below 45 for bears). In this case, pivot signs can also be used as a guide for closing positions. Of course, this is best done during periods of high momentum. Five- and 15-minute scalping also works well. However, these only work if you adhere to my logic. Don't forget to adhere to your own logic and framework.
The above is just an example. Feel free to use it as you like.

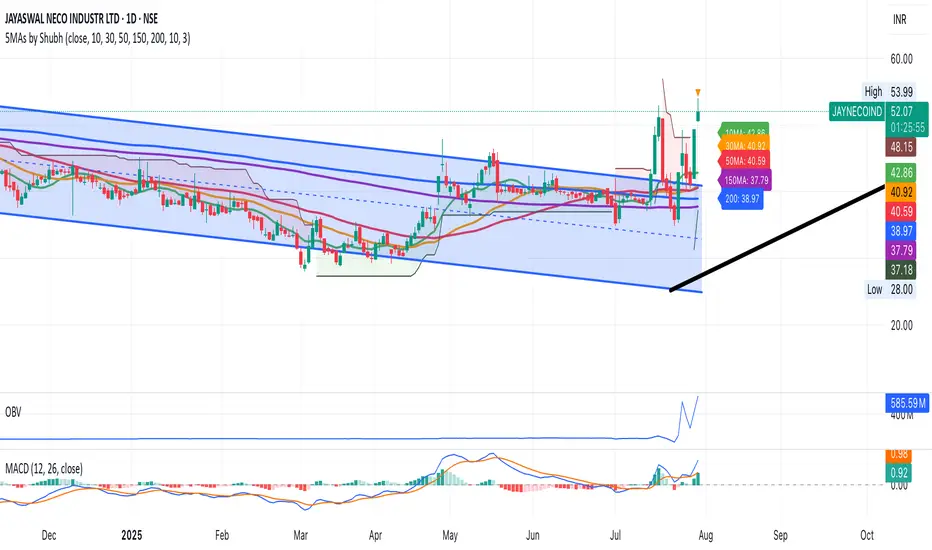
Simple 5 Moving Averages 5 MAs - Shubhashish DixitEnjoy the 5 Moving Average to Support your analysis deeper
Swing Strategy MTF with Auto SL/TP + Weekly Pivotsested and Working Notes:
Works on any intraday chart (like 1H or 4H)
Uses Daily trend for confirmation by default
Adjust trend EMAs or pivot TF if needed
Wait for a signal label after candle close
Targets and SL are drawn automatically
—

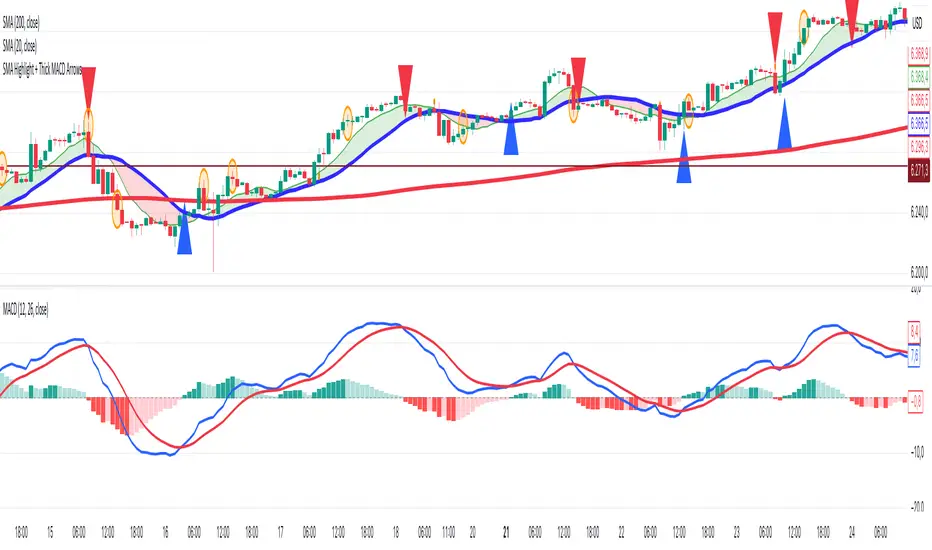
SMA Highlight + MACD Crossover ArrowsDraw blue arrow for bullish entries when MACD line crosses above the signal line and red arrow for bearish entries when MACD line crosses below the signal line
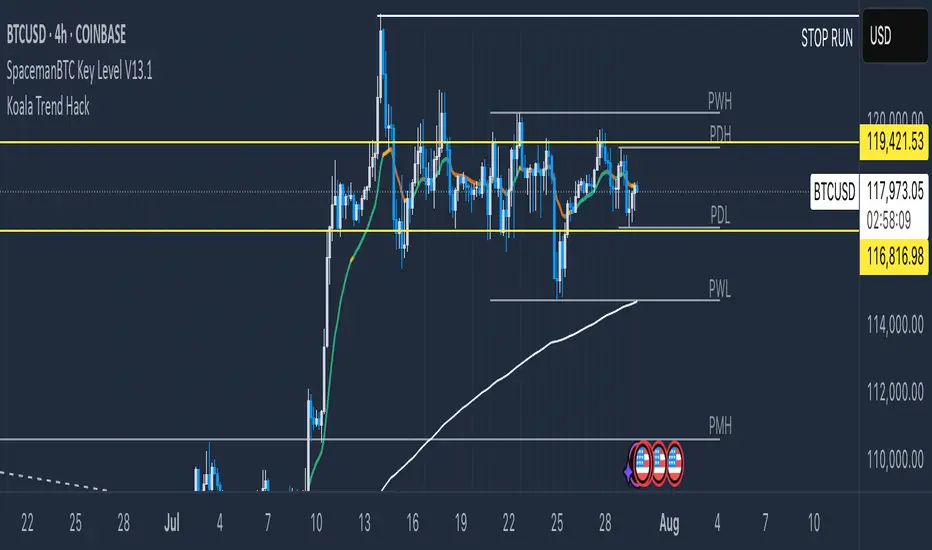
Koala Trend HackWhat this indicator is
A minimal, “ tweet‑faithful ” trend read with just two visuals:
1. H4 EMA200 (white): the macro/regime line pulled onto any timeframe.
2. Trend Line (colored): the average of EMA‑8 and EMA‑21; its color shows the current state.
How it works (state → color)
Priority is macro first, then short‑term momentum—so it’s simple but still reactive above H4:
Below H4 200 → Red (Be Bearish).
Above H4 200 with wick into it → Yellow (Be Bullish & Pray / Watch the retest).
Above H4 200 and above both 8 & 21 → Green (Be Bullish).
Above H4 200 but below both 8 & 21 → Orange (Be Cautious).
If none of the above applies, it falls back to the 8/21 cluster (above both = green, below both = orange) or stays Yellow (Neutral/Watch).
How it aligns with the tweet’s 5 rules
1. Reclaim EMAs = Long → close > 8 & 21 → Green.
2. Close below EMAs = Be cautious* → close < 8 & 21 → Orange.
3. Retest of H4 EMA200 = Be bullish and pray → close > H4 and low ≤ H4 → Yellow.
4. Lose H4 EMA200 = Be bearish* → close < H4 → Red.
5. Reclaim H4 EMA200 = Be bullish again* → back above H4 (and ideally > 8/21) → Green.
How to use
Green favors longs; Orange means lighten up or wait; Yellow says “watch the level” after a retest; Red warns against longs until H4 200 is reclaimed.
Notes:
The H4 EMA200 is a higher‑timeframe value fetched with request.security; on sub‑H4 charts it updates during the current 4‑hour candle (responsive but can shift slightly until that candle closes).
EMAs 8 & 21 are used internally to color the line; they’re not plotted, keeping the chart clean.
What would make this better? Modify it and show me what you built!
MACD Signal with Williams %R ColoringA simple fused indicator of 2, 1) MACD signal lines made colouring when 2) Williams % R is in overbought or oversold. not my own coding, just took two readily available indicators and coded them together.

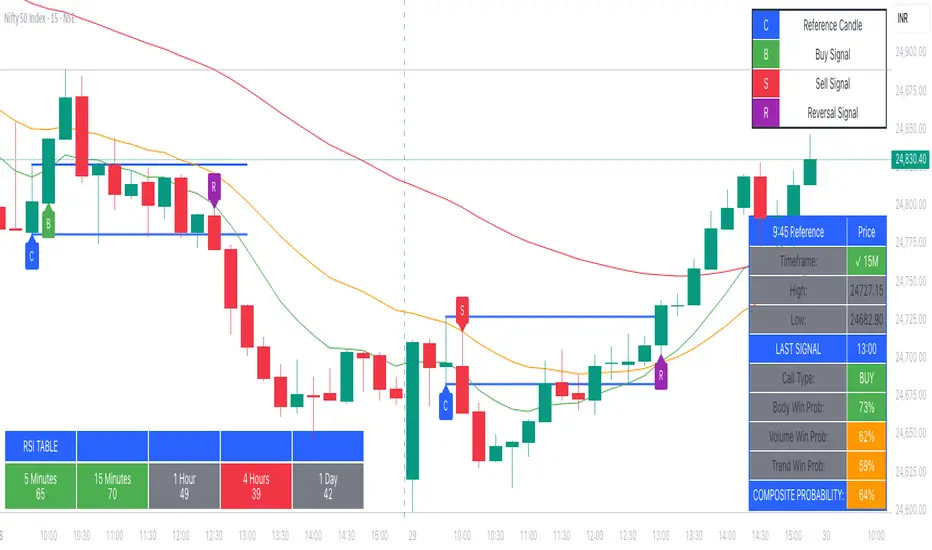
9:45am NIFTY TRADINGTime Frame: 15 Minutes | Reference Candle Time: 9:45 AM IST | Valid Trading Window: 3 Hours
📌 Introduction
This document outlines a structured trading strategy for NIFTY & BANKNIFTY Options based on a 15-minute timeframe with a 9:45 AM IST reference candle. The strategy incorporates technical indicators, probability analysis, and strict trading rules to optimize entries and exits.
📊 Core Features
1. Reference Time Trading System
9:45 AM IST Candle acts as the reference for the day.
All signals (Buy/Sell/Reversal) are generated based on price action relative to this candle.
The valid trading window is 3 hours after the reference candle.
2. Signal Generation Logic
Signal Condition
Buy (B) Price breaks above reference candle high with confirmation
Sell (S) Price breaks below reference candle low with confirmation
Reversal (R) Early trend reversal signal (requires strict confirmation)
3. Probability Analysis System
The strategy calculates Win Probability (%) using 4 components:
Component Weight Calculation
Body Win Probability 30% Based on candle body strength (body % of total range)
Volume Win Probability 30% Current volume vs. average volume strength
Trend Win Probability 40% EMA crossover + RSI momentum alignment
Composite Probability - Weighted average of all 3 components
Probability Color Coding:
🟢 Green (High Probability): ≥70%
🟠 Orange (Medium Probability): 50-69%
🔴 Red (Low Probability): <50%
4. Timeframe Enforcement
Strictly 15-minute charts only (no other timeframes allowed).
System auto-disables signals if the wrong timeframe is selected.
📈 Technical Analysis Components
1. EMA System (Trend Analysis)
Short EMA (9) – Fast trend indicator
Middle EMA (20) – Intermediate trend
Long EMA (50) – Long-term trend confirmation
Rules:
Buy Signal: Price > 9 EMA > 20 EMA > 50 EMA (Bullish trend)
Sell Signal: Price < 9 EMA < 20 EMA < 50 EMA (Bearish trend)
2. Multi-Timeframe RSI (Momentum)
5M, 15M, 1H, 4H, Daily RSI values are compared for divergence/confluence.
Overbought (≥70) / Oversold (≤30) conditions help in reversal signals.
3. Volume Analysis
Volume Strength (%) = (Current Volume / Avg. Volume) × 100
Strong Volume (>120% Avg.) confirms breakout/breakdown.
4. Body Percentage (Candle Strength)
Body % = (Close - Open) / (High - Low) × 100
Strong Bullish Candle: Body > 60%
Strong Bearish Candle: Body < 40%
📊 Visual Elements
1. Information Tables
Reference Data Table (9:45 AM Candle High/Low/Close)
RSI Values Table (5M, 15M, 1H, 4H, Daily)
Signal Legend (Buy/Sell/Reversal indicators)
2. Chart Overlays
Reference Lines (9:45 AM High & Low)
EMA Lines (9, 20, 50)
Signal Labels (B, S, R)
3. Color Coding
High Probability (Green)
Medium Probability (Orange)
Low Probability (Red)
⚠️ Important Usage Guidelines
✅ Best Practices:
Trade only within the 3-hour window (9:45 AM - 12:45 PM IST).
Wait for confirmation (closing above/below reference candle).
Use probability score to filter high-confidence trades.
❌ Avoid:
Trading outside the 15-minute timeframe.
Ignoring volume & RSI divergence.
Overtrading – Stick to 1-2 high-probability setups per day.
🎯 Conclusion
This NIFTY Trading Strategy is optimized for 15-minute charts with a 9:45 AM IST reference candle. It combines EMA trends, RSI momentum, volume analysis, and probability scoring to generate high-confidence signals.
🚀 Key Takeaways:
✔ Reference candle defines the day’s bias.
✔ Probability system filters best trades.
✔ Strict 15M timeframe ensures consistency.
Happy Trading! 📈💰
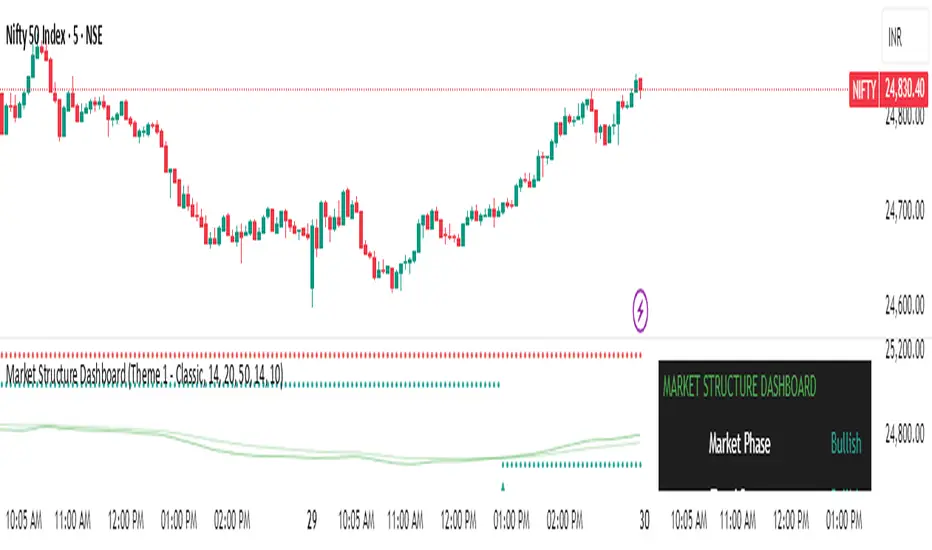
Market Structure Dashboard @darshakssc📌 Market Structure Dashboard by @darshakssc is a comprehensive visual analysis tool designed to assist traders and analysts in understanding market conditions by presenting multiple key technical insights in one place.
This script does not provide buy or sell signals, but helps you interpret essential elements of market behavior — such as structure shifts, momentum conditions, trend direction, and volatility — for informed decision-making.
🔍 What This Dashboard Displays:
✅ Market Phase Detection
Identifies the current market condition as Bullish, Bearish, Accumulation, or Distribution, based on trend logic and RSI thresholds.
✅ Trend Direction (EMA-Based)
Uses customizable Fast and Slow Exponential Moving Averages (EMAs) to evaluate whether the market is trending upward or downward.
✅ Key Support & Resistance Levels
Highlights potential support and resistance areas based on structural highs and lows and pivot logic.
✅ RSI Momentum State
Tracks whether momentum is Overbought, Oversold, or Neutral, using the classic RSI indicator.
✅ Volatility Overview
Detects high or low volatility zones using ATR (Average True Range) compared to a moving average baseline.
✅ Structure Shift Markers
Displays triangle markers on the chart when a structural trend shift is detected.
✅ Custom Themes and Design
Choose between three clean themes — Classic, Modern, and Dark — for enhanced readability and aesthetics.
📊 Visual Elements
1). An intuitive table-style dashboard appears in the top-right of the chart.
2). Colored EMA overlays and plotted support/resistance circles on the price chart.
3). Structure shift indicators help visually mark potential change zones.
⚠️ Important Notice:
This tool is intended for educational and informational purposes only. It does not provide financial advice, trade recommendations, or guaranteed outcomes. Always use your own discretion and analysis, and consult a qualified financial professional before making investment decisions.
Trading involves risk and past performance does not guarantee future results.
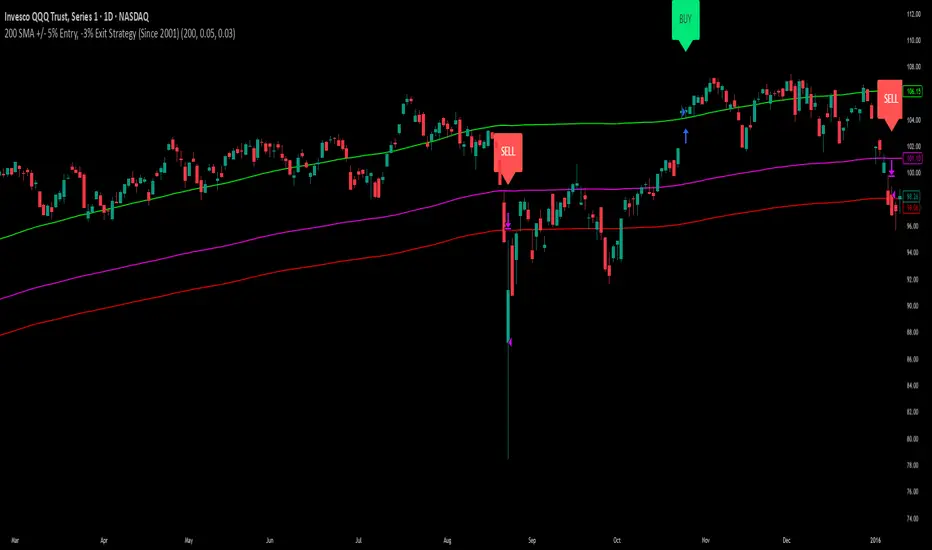
200 SMA (5%/-3% Buffer) for SPY & QQQ In my testing TQQQ is an absolute monster of an ETF that performs extremely well even from a buy and hold standpoint over long periods of time, its largest drawback is the massive drawdown exposure that it faces which can be easily sidestepped with this strategy.
This strategy is meant to basically abuse TQQQ's insane outperformance while augmenting the typical 200SMA strategy in a way that uses all of its strengths while avoiding getting whipsawed in sideways markets.
The strategy BUYS when price crosses 5% over the 200SMA and then SELLS when price drops 3% below the 200SMA. Between trades I'll be parking my entire account in SGOV.
So maximizing profit while minimizing risk.
You use the strategy based off of QQQ and then make the trades on TQQQ when it tells you to BUY/SELL.
Here are some reasons why I will be using this strategy:
Simple emotionless BUY and SELL signals where I don't care who the president is, what is happening in the world, who is bombing who, who the leadership team is, no attachment to individual companies and diversified across the NASDAQ.
~85% win percentage and when it does lose the loses are nothing compared to the wins and after a loss you're basically set up for a massive win in the next trade.
Max drawdown of around 53% when using TQQQ
You benefit massively when the market is doing well and when there is a recession you basically sit in SGOV for a year and then are set up for a monster recovery with a clear easy BUY signal. So as long as you're patient you win regardless of what happens.
The trades are often very long term resulting in you taking advantage of Long Term Capital Gains tax advantage which could mean saving up to 15-20% in taxes.
With only a few trades you can spend time doing other stuff and don't have to track or pay attention to anything that is happening.
Simple, easy, and massively profitable.
NAIFCHART_NAS Ultimate Algo | Remastered+# NAIFCHART NAS Ultimate Algo Remastered+: Advanced Trend Following System
## Overview
The NAIFCHART NAS Ultimate Algo Remastered+ represents a sophisticated trend-following system that combines Supertrend analysis with multiple moving average confirmations. This comprehensive indicator was developed and shared by the trading community at t.me designed specifically for identifying high-probability trend continuation and reversal opportunities.
## Core Algorithm Components
**Supertrend Foundation**: The primary signal generation relies on a customizable Supertrend indicator with adjustable sensitivity (1-20 range). This adaptive trend-following tool uses Average True Range calculations to establish dynamic support and resistance levels that respond to market volatility.
**SMA Confirmation Matrix**: Multiple Simple Moving Averages (SMA 4, 5, 9, 13) provide layered confirmation for signal strength. The algorithm distinguishes between regular signals and "Strong" signals based on SMA 4 vs SMA 5 relationship, offering traders different conviction levels for position sizing.
**Trend Ribbon Visualization**: SMA 21 and SMA 34 create a visual trend ribbon that changes color based on their relationship. Green ribbon indicates bullish momentum while red signals bearish conditions, providing immediate visual trend context.
**RSI-Based Candle Coloring**: Advanced 61-tier RSI system colors candles with gradient precision from deep red (RSI ≤20) through purple transitions to bright green (RSI ≥79). This visual enhancement helps traders instantly assess momentum strength and overbought/oversold conditions.
## Signal Generation Logic
**Buy Signal Criteria**:
- Price crosses above Supertrend line
- Close price must be above SMA 9 (trend confirmation)
- Signal strength determined by SMA 4 vs SMA 5 relationship
- "Strong Buy" when SMA 4 ≥ SMA 5
- Regular "Buy" when SMA 4 < SMA 5
**Sell Signal Criteria**:
- Price crosses below Supertrend line
- Close price must be below SMA 9 (trend confirmation)
- Signal strength based on SMA relationship
- "Strong Sell" when SMA 4 ≤ SMA 5
- Regular "Sell" when SMA 4 > SMA 5
## Advanced Risk Management System
**Automated TP/SL Calculation**: The indicator automatically calculates stop loss and take profit levels using ATR-based measurements. Risk percentage and ATR length are fully customizable, allowing traders to adapt to different market conditions and personal risk tolerance.
**Multiple Take Profit Targets**:
- 1:1 Risk-Reward ratio for conservative profit taking
- 2:1 Risk-Reward for balanced trade management
- 3:1 Risk-Reward for maximum profit potential
**Visual Risk Display**: All risk management levels appear as both labels and optional trend lines on the chart. Customizable line styles (solid, dashed, dotted) and positioning ensure clear visualization without chart clutter.
**Dynamic Level Updates**: Risk levels automatically recalculate with each new signal, maintaining current market relevance throughout position lifecycles.
## Visual Enhancement Features
**Customizable Display Options**: Toggle trend ribbon, TP/SL levels, and risk lines independently. Decimal precision adjustments (1-8 decimal places) accommodate different instrument price formats and personal preferences.
**Professional Label System**: Clean, informative labels show entry points, stop losses, and take profit targets with precise price levels. Labels automatically position themselves for optimal chart readability.
**Color-Coded Momentum**: The gradient RSI candle coloring system provides instant visual feedback on momentum strength, helping traders assess market energy and potential reversal zones.
## Implementation Strategy
**Timeframe Optimization**: The algorithm performs effectively across multiple timeframes, with higher timeframes (4H, Daily) providing more reliable signals for swing trading. Lower timeframes work well for day trading with appropriate risk adjustments.
**Sensitivity Adjustment**: Lower sensitivity values (1-5) generate fewer but higher-quality signals, ideal for conservative approaches. Higher sensitivity (15-20) increases signal frequency for active trading styles.
**Risk Management Integration**: Use the automated risk calculations as baseline parameters, adjusting risk percentage based on account size and market conditions. The 1:1, 2:1, 3:1 targets enable systematic profit-taking strategies.
## Market Application
**Trend Following Excellence**: Primary strength lies in capturing significant trend movements through the Supertrend foundation with SMA confirmation. The dual-layer approach reduces false signals common in single-indicator systems.
**Momentum Assessment**: RSI-based candle coloring provides immediate momentum context, helping traders assess signal strength and potential continuation probability.
**Range Detection**: The trend ribbon helps identify ranging conditions when SMA 21 and SMA 34 converge, alerting traders to potential breakout opportunities.
## Performance Optimization
**Signal Quality**: The requirement for both Supertrend crossover AND SMA 9 confirmation significantly improves signal reliability compared to basic trend-following approaches.
**Visual Clarity**: The comprehensive visual system enables rapid market assessment without complex calculations, ideal for traders managing multiple instruments.
**Adaptability**: Extensive customization options allow fine-tuning for specific markets, trading styles, and risk preferences while maintaining the core algorithm integrity.
## Community Resources
Join the active trading community at t.me for ongoing discussions about optimization techniques, market analysis, and strategy refinements using this advanced algorithm system.
The collaborative environment provides valuable insights into parameter adjustments for different market conditions and real-world performance feedback from experienced traders.
## Conclusion
The NAIFCHART NAS Ultimate Algo Remastered+ combines proven trend-following principles with modern visual enhancements and comprehensive risk management. The algorithm's strength lies in its multi-layered confirmation approach and automated risk calculations, providing both novice and experienced traders with clear signals and systematic trade management.
Success with this system requires understanding the relationship between signal strength indicators and adapting sensitivity settings to match current market conditions. The comprehensive visual feedback system enables rapid decision-making while the automated risk management ensures consistent trade parameters.
Practice with different sensitivity settings and timeframes to optimize performance for your specific trading style and risk tolerance. The algorithm's systematic approach provides excellent framework for disciplined trend-following strategies across various market environments.

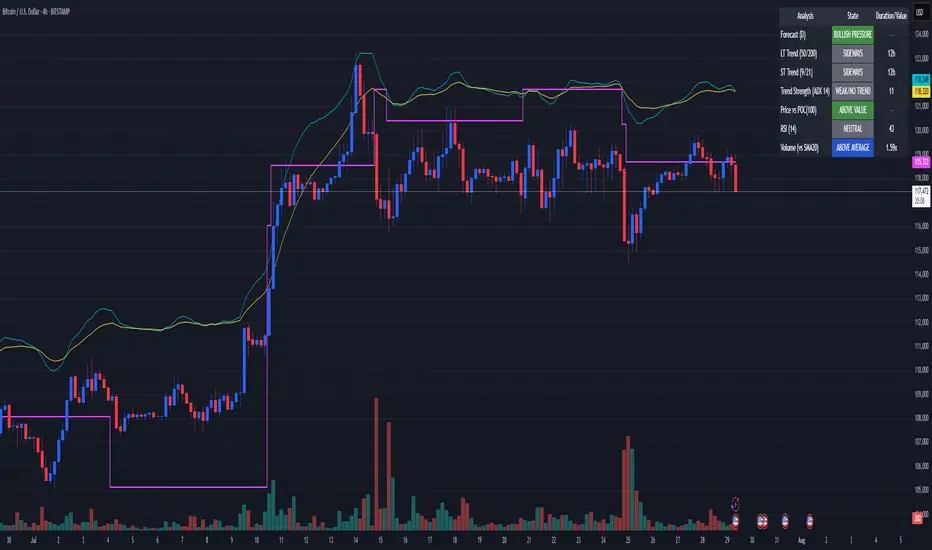
Advanced Trend Panel v3.1This is a comprehensive dashboard indicator designed to give traders a multi-faceted view of the market at a single glance. It combines key indicators across multiple timeframes, calculates trend duration, and presents all information in a clean, color-coded table. This tool is perfect for confirming trade ideas, identifying trend alignment, and understanding the underlying market dynamics.
#### Key Features:
* **All-in-One Dashboard:** A convenient on-chart table summarizes the state of multiple key indicators, saving you screen space and time.
* **Multi-Timeframe (MTF) Forecast:** Analyzes the long-term trend on a higher timeframe (e.g., Daily) to provide context for the current chart's trend.
* **Trend Analysis:** Uses dual sets of EMAs (long-term and short-term) to define the primary and immediate trend directions.
* **Trend Duration:** A unique feature that calculates how long the current short-term and long-term trends have been active, helping you gauge trend maturity.
* **Core Indicators Included:**
* **ADX:** Measures trend strength to differentiate between strong trends and weak or sideways markets.
* **RSI:** Identifies overbought and oversold conditions.
* **Point of Control (POC):** Shows the price level with the highest traded volume over a lookback period, acting as a key level of support/resistance.
* **Volume:** Compares current volume to its moving average to spot unusual activity.
* **Customizable Alerts:** Set up alerts for trend changes (long-term or short-term), RSI crossing into overbought/oversold zones, or shifts in ADX trend strength.
#### How to Use:
1. Apply the indicator to your chart.
2. In the settings, configure the timeframes, indicator lengths, and display options to match your trading style.
3. Use the table to quickly assess if the long-term trend, short-term trend, and momentum are aligned.
4. Enable alerts to be notified of key changes in market conditions without having to watch the chart constantly.
**Disclaimer:** This script is for educational purposes only and should not be considered financial advice. All trading involves risk. Past performance is not indicative of future results. Please backtest and use this tool as part of a comprehensive trading plan with proper risk management.
Feedback is always welcome! If you find this indicator useful, please leave a like.
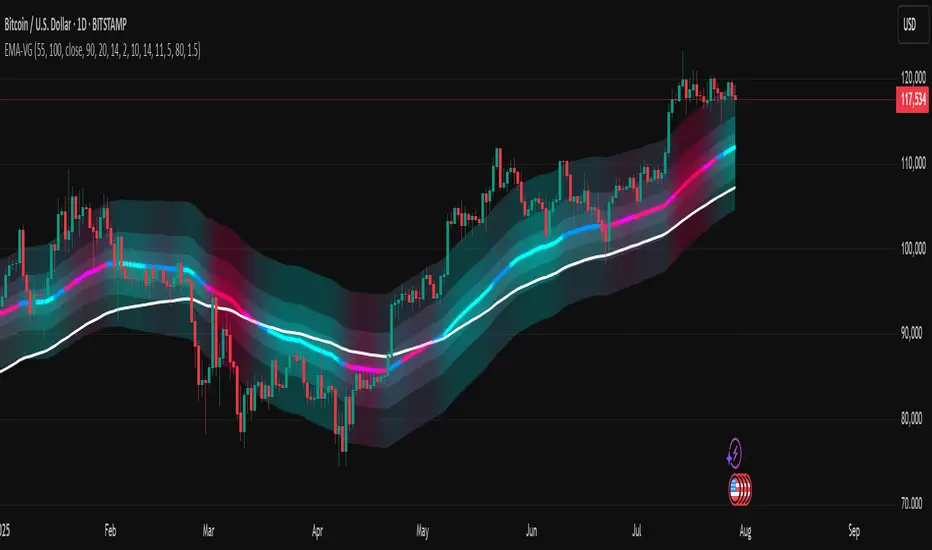
[LeonidasCrypto]EMA with Volatility GlowEMA Volatility Glow - Advanced Moving Average with Dynamic Volatility Visualization
Overview
The EMA Volatility Glow indicator combines dual exponential moving averages with a sophisticated volatility measurement system, enhanced by dynamic visual effects that respond to real-time market conditions.
Technical Components
Volatility Calculation Engine
BB Volatility Curve: Utilizes Bollinger Band width normalized through RSI smoothing
Multi-stage Noise Filtering: 3-layer exponential smoothing algorithm reduces market noise
Rate of Change Analysis: Dual-timeframe RoC calculation (14/11 periods) processed through weighted moving average
Dynamic Normalization: 100-period lookback for relative volatility assessment
Moving Average System
Primary EMA: Default 55-period exponential moving average with volatility-responsive coloring
Secondary EMA: Default 100-period exponential moving average for trend confirmation
Trend Analysis: Real-time bullish/bearish determination based on EMA crossover dynamics
Visual Enhancement Framework
Gradient Band System: Multi-layer volatility bands using Fibonacci ratios (0.236, 0.382, 0.618)
Dynamic Color Mapping: Five-tier color system reflecting volatility intensity levels
Configurable Glow Effects: Customizable transparency and intensity settings
Trend Fill Visualization: Directional bias indication between moving averages
Key Features
Volatility States:
Ultra-Low: Minimal market movement periods
Low: Reduced volatility environments
Medium: Normal market conditions
High: Increased volatility phases
Extreme: Exceptional market stress periods
Customization Options:
Adjustable EMA periods
Configurable glow intensity (1-10 levels)
Variable transparency controls
Toggleable visual components
Customizable gradient band width
Technical Calculations:
ATR-based gradient bands with noise filtering
ChartPrime-inspired multi-layer fill system
Real-time volatility curve computation
Smooth color gradient transitions
Applications
Trend Identification: Dual EMA system for directional bias assessment
Volatility Analysis: Real-time market stress evaluation
Risk Management: Visual volatility cues for position sizing decisions
Market Timing: Enhanced visual feedback for entry/exit consideration