Sadi's Pocket Pivot Buy Signal (PP-B)Can be used to identify early entries within a basing period or later on as the stock breaks out and heads higher (continuation buy signals).
Helps in identifying low risk entries where the investor can pyramid into the stock and hence manage risk better.
Makes sure you get in when the trade in working in your favor and avoid putting good money after bad.
Moving Averages
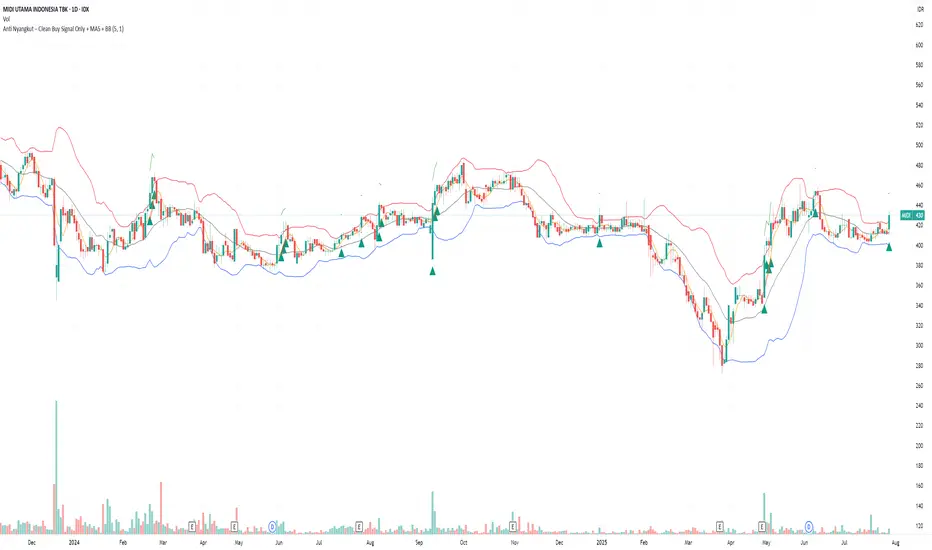
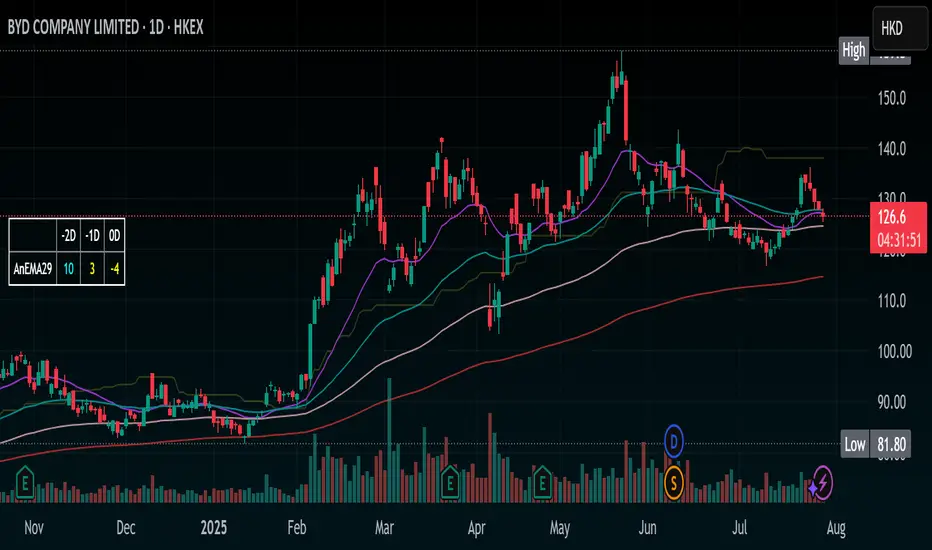
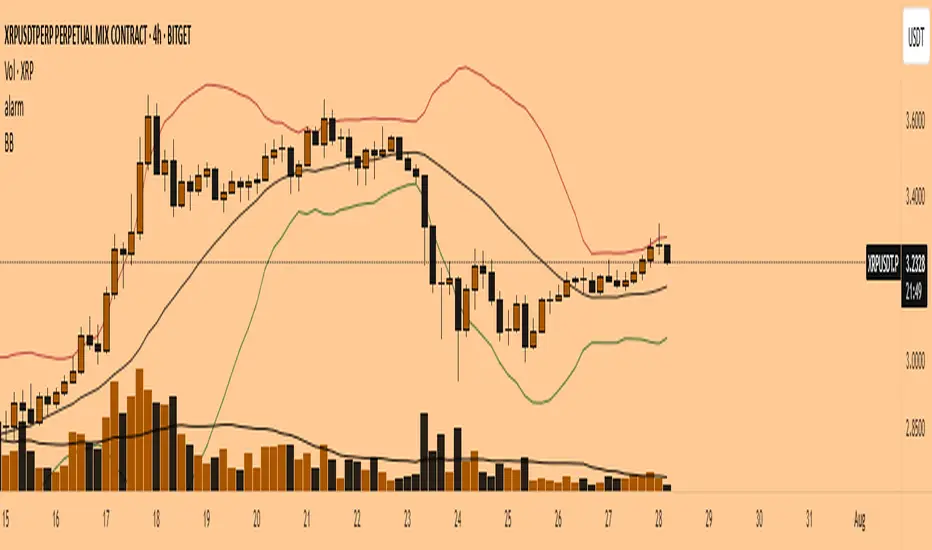
Anti Nyangkut – Indikator Karya Anak Bangsa Anti Nyangkut – Indikator Karya Anak Bangsa
Indikator ini khusus buat kamu yang sering beli di pucuk dan jual di support, lalu akhirnya jadi bahan backtest orang lain.
💡 Sinyal buy only - muncul kalau harga udah:
✅ Di atas MA5
✅ Di atas Bollinger Bands Upper
✅ Di atas VWAP (khusus 1H & 4H)
🟢 TP dan SL otomatis muncul — biar gak cuma "niat hold sampe hijau"
📊 Cocok buat scalping & swing di 1H / 4H / 1D
Gak ada sinyal jual. Exit di tangan masing-nasing, jangan lupa pasang SL.
—
100% gratis. Bayarnya pakai amal jariyah.
—
Anti Nyangkut – An Indicator by the People, for the People
This one's for you if you always buy the top, sell the bottom, and end up becoming someone else's backtest data.
💡 Buy-Only Signals — triggered when price is:
✅ Above MA5
✅ Above Bollinger Bands Upper
✅ Above VWAP (on 1H & 4H only)
🟢 Auto TP & SL lines — so you stop saying "I'll hold until it turns green"
📊 Perfect for scalping & swing trades on 1H / 4H / 1D
There’s no sell signal. Exits are your responsibility — just don’t skip the stop loss.
—
100% free. Just pay with good karma.
Breakout Range Signal with Quality Analysis [Dova Lazarus]📌 Breakout Range Signal with Quality Analysis
🎓 Training-focused indicator for breakout logic, SL & TP behavior and signal quality assessment
🔷 PURPOSE
This tool identifies breakout candles from a calculated channel range and visually simulates entries, stop losses, and take profits, providing live and historical performance metrics.
⚙️ MAIN SETTINGS
1️⃣ Channel Setup
channel_length = 10 → how many candles are averaged to form channel boundaries
channel_multiplier = 0.0 → adds expansion above/below the base channel
channel_smoothing_type = SMA → smoothing method for high/low averaging
📊 The channel consists of two moving averages: one from highs, the other from lows. When expanded (via multiplier), it creates a buffer range for breakout validation.
2️⃣ Signal Detection
Body > Channel % = 50 → a breakout candle's body must exceed 150% of the channel width
Signal Mode:
• Weak → every valid breakout candle is highlighted
• Strong → only the first signal in a sequence is shown (helps reduce noise)
🟦 Bullish signals (blue):
• Candle opens inside the channel
• Closes above the channel
• Body is large enough
• Optional: confirms with trend (if enabled)
🟨 Bearish signals (yellow):
• Candle opens inside the channel
• Closes below the channel
• Body is large enough
• Optional: confirms with trend
3️⃣ Trend Filter (optional)
Enabled via checkbox
Uses a higher timeframe MA to filter signals
Bullish signals are allowed only if price is below the trend MA
Bearish signals only if price is above it
⏱️ trend_timeframe = 1D (typically set higher than the chart's timeframe)
🟢 Trend line is plotted if enabled
🎯 ENTRY, STOP LOSS & TAKE PROFIT LOGIC
SL and TP are based on channel width, not fixed pip/tick size:
📍 Entry Price = close of the breakout candle
🛑 Stop Loss:
• Bullish → below the lower channel border (minus offset)
• Bearish → above the upper channel border (plus offset)
🎯 Take Profit:
• Bullish → entry + channel width × profit multiplier
• Bearish → entry − channel width × profit multiplier
You can control:
Profit Target Multiplier (e.g., 1.0 → TP = 1×channel width)
Stop Loss Target Multiplier (e.g., 0.5 → SL = 0.5×channel width)
Signals to Show = how many historical SL/TP setups to display
📈 Lines and labels ("TP", "SL") are drawn on the chart for clarity.
🧪 QUALITY ANALYSIS MODULE
If enabled, the indicator will:
Track each new signal (entry, SL, TP)
Analyze outcomes:
• Win = TP hit before SL
• Loss = SL hit before TP
• Expired = signal unresolved after N bars
Display statistics in a table (top-right corner):
📋 Table fields:
✅ Overall win rate
📈 Bullish win rate
📉 Bearish win rate
🔢 Total signals
🕓 Pending (still active trades)
Maximum bars to wait for outcome is customizable (max_bars_to_analyze).
📐 VISUALIZATION TOOLS
TP / SL lines per signal
Labels “TP” and “SL”
Optional channel lines and trendline for better context
Colored bars for valid signals (blue/yellow)
📌 BEST USE CASES
Understand how breakout signals are formed
Learn SL/TP logic based on dynamic range
Test how volatility affects trade outcomes
Use as a visual simulation of trade behavior over time

EMA+ATR Band MTF Trend EntryThis is a Multi-Timeframe Trend Trading indicator strategy adapted from Sahil Rohmehtra’s Mentorship programme. The trading decision is made by first accessing the trend in higher timeframe (say Monthly) by using TWO EMAs. If the faster EMA (say 20 period) is above Slower EMA (say 50 period) and the price is above slower EMA then the trend is suitable for buyers. Similarly if faster EMA is below slow EMA and the price is below that then trend is suitable for sellers.
Once we access the trend in the higher timeframe we move to the lower timeframe (say Weekly) and access the 5-period RSI value. If RSI is below 30 then we can prepare for possible buy entry in lower (Daily) timeframe if entry conditions are met in daily timeframe. Similarly sell bias can be initiated when the higher timeframe EMA trend is down, daily RSI is above 70 and sell entry condition is met in daily timeframe. The RSI thresholds can be changed by the user.
Once we identified the RSI bias then wait for the confirmation candle in the lower timeframe (say 1 hour). In the entry timeframe we plot a band of 20 EMA of LOWs ± 1 ATR lines. Here,we wait for a candle to close above the 20 EMA of LOWs + 1 ATR for a buy signal with an increase in On Balance Volume (OBV) value. Similarly for sell signal we should get a candle close below the 20 EMA of LOWs - 1 ATR with corresponding change in OBV. This candle is the signal candle.
Once we get a Buy or Sell signal the corresponding stop loss is the nearest LOW - 1 ATR or HIGH + 1 ATR. The ATR scaling may be changed by the user. Now if another candle closes above the high of the buy signal candle then enter on buy. If the low of the buy signal candle is broken then it is a potential short-term sell entry. Similarly if another candle closes below the sell signal candle then enter short and if there is a close above high of the signal candle then it is a potential buy entry.
Pi Cycle | AlchimistOfCryptoPi Cycle Top Indicator - A Powerful Market Phase Detector
Developed by AlchimistOfCrypto
🧪 The Pi Cycle uses mathematical harmony to identify Bitcoin market cycle tops
with remarkable precision. Just as elements react at specific temperatures,
Bitcoin price behaves predictably when these two moving averages converge! 🧬
⚗️ The formula measures when the 111-day SMA crosses below the 350-day SMA × 2,
creating a perfect alchemical reaction that has successfully identified the
major cycle tops in 2013, 2017, and 2021.
🔬 Like the Golden Ratio in nature, this indicator reveals the hidden
mathematical structure within Bitcoin's chaotic price movements.
🧮 When the reaction occurs, prepare for molecular breakdown! 🔥

Keltner Channels MTFKeltner Channels MTF | Adapted 🌌
Navigate the market’s wild waves with these Keltner Channels, a sleek spin on AlchimistOfCrypto’s Bollinger Bands! This Pine Script v6 indicator tracks price action like a radar, highlighting trends with scientific precision. 🧪
Key Features:
Customizable Channels: Adjust period and multiplier to map market volatility, signaling potential reversals when prices hit the upper or lower bands. 📈
MA Options: Switch between Exponential or Simple Moving Average for trend clarity. ⚙️
Band Styles: Select Average True Range, True Range, or Range to define volatility edges. 📏
Glow Effect: Illuminate bands with 8 vibrant themes (Neon, Grayscale, etc.) for visual pop. ✨
Trend Signals: Spot bullish/bearish shifts with glowing circles, flagging momentum changes. 💡
Alerts: Catch price breakouts or trend reversals at band edges, warning of potential market U-turns. 🚨
Perfect for traders decoding market trends with a touch of cosmic style! 🌠

ZFT ClassicThis is the classic ZFT MAs that can be used by ZFT students to determine if a chart is in an uptrend, downtrend, or sideways movement within a short, medium, or long term timeframe.

SMAs Ghost in the Machine v3SMAs Ghost in the Machine v3
Created by: MecarderoAurum
Overview
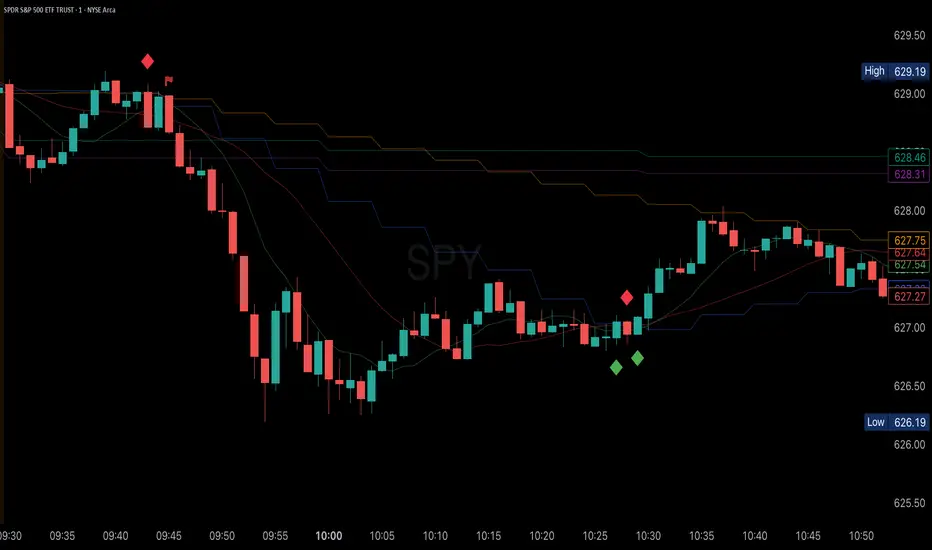
The "SMAs Ghost in the Machine" is a powerful multi-timeframe analysis tool designed for traders who want to align their entries and exits with the trend on several different chart periods simultaneously. At its core, the indicator plots the 9-period and 20-period Simple Moving Averages (SMAs) from up to three user-defined timeframes directly onto your active chart.
Its most powerful feature is the Combined Crossover Signal, which allows you to create highly specific, custom trading setups by defining conditions that must occur at the same time across any of the enabled timeframes. This eliminates guesswork and helps you visually confirm when your precise market conditions are met.
Important Note on Line Drawing
This indicator allows you to see trends of other timeframes. A specific design choice was made not to smooth the moving average lines. This is to ensure that the crossover signals appear on the exact candle where the cross occurs in real-time. Smoothing the lines can cause a delay and shift the signal to a later candle.
The side effect of this accuracy is that the lines will appear "stepped." As new data comes in on your current chart, you may need to refresh the chart to keep the higher timeframe lines updated. We are working on a solution to this.
Capabilities
Multi-Timeframe Analysis: Plot the 9 and 20 SMAs from three different timeframes (e.g., 1-minute, 5-minute, and 30-minute) on a single chart.
Individual Crossover Signals: Automatically plots a green triangle (▲) for a "Golden Cross" (9 SMA crosses above 20) and a red triangle (▼) for a "Death Cross" (9 SMA crosses below 20) on each individual timeframe.
Combined Crossover Engine: Define a custom bullish or bearish signal by combining multiple events. The indicator will plot a green diamond (◆) for your bullish setup and a red diamond (◆) for your bearish setup when all specified conditions are met on the same candle.
Customizable Alerts: Create alerts for both the individual 9/20 SMA crosses and your custom Combined Crossover Signal to ensure you never miss a potential setup.
How to Use the Indicator
Basic Setup
Add the "SMAs Ghost in the Machine v3" indicator to your TradingView chart.
Open the indicator settings.
Under the Timeframe Settings, enable the timeframes you want to monitor and select the desired period for each (e.g., TF1: '1', TF2: '5', TF3: '30').
Configuring the Combined Crossover Signal
This is the core feature for defining your specific trading setups.
In the settings, go to the "Combined Crossover Signal" group and check the box to "Enable Combined Signal."
Decide if you are building a bullish (long) or bearish (short) setup.
Under the "Bullish Setup" or "Bearish Setup" sections, check the boxes for every event that must happen at the same time for your signal to trigger.
Example Bullish Setup:
Let's say your strategy is to go long when:
On the 1-minute chart (TF1), the price crosses above the 9 SMA.
AND, on the 5-minute chart (TF3), the price also crosses above its 9 SMA.
To configure this, you would check the following two boxes under the "Bullish Setup":
TF1: Price crosses above 9 SMA
TF3: Price crosses above 9 SMA
Now, a green diamond (◆) will only appear on your chart when both of those conditions are true on the exact same bar, giving you a precise entry signal.
Setting Up Alerts
Go to the "Alert Settings" tab in the indicator options.
Check the boxes for the alerts you want to enable (e.g., "Alert on TF1 SMA Cross," "Alert on Combined Signal").
Close the settings. Now, right-click on the chart and choose "Add alert."
In the "Condition" dropdown, select "SMA Ghosts v3."
A second dropdown will appear. Choose the specific event you want an alert for, such as Combined Bullish Signal or TF1 Golden Cross.
Configure the alert options as desired and click "Create."
Trading Strategies
Trend Confirmation: Use the indicator on a 1-minute chart with the 5-minute 9/20 SMA lines enabled to see the 5-minute trend. Only take 1-minute trades that are in the same direction as the 5-minute SMAs.
Multi-Flow Alignment: Keep track of bigger timeframes (like the 30-min or 4-hour) to also match your entries with longer-term market flows.
Avoid Flat Markets: Avoid taking trades when the SMA lines from multiple timeframes are flat or moving sideways, as this indicates a lack of clear trend.
Stochastic Ribbon & EMAsHere's a comprehensive description for publishing your indicator:
---
# **Stochastic Ribbon & EMAs**
A clean and powerful trading indicator that combines **Stochastic Support/Resistance levels** with **Essential Moving Averages** for comprehensive market analysis.
## **📊 What It Does**
This indicator provides **7 key reference lines** on your chart:
- **3 Stochastic levels** (20%, 50%, 80%) - Dynamic support/resistance zones
- **4 Essential EMAs** (20, 50, 100, 200) - Trend direction and momentum
## **🎯 Key Features**
### **Stochastic Ribbon (3 Yellow Lines)**
- **80% Line**: Dynamic resistance level - potential selling zone
- **50% Line**: Market equilibrium - trend direction reference
- **20% Line**: Dynamic support level - potential buying zone
- **Default 50-period lookback** for stable, reliable levels
- **All lines in yellow** for clean, consistent visualization
### **Essential EMAs (4 Colored Lines)**
- **20 EMA** (Purple): Short-term trend and entry timing
- **50 EMA** (Dark Cyan): Medium-term trend direction
- **100 EMA** (Rosy Brown): Long-term trend confirmation
- **200 EMA** (Brown): Major trend and institutional levels
## **📈 How to Use**
### **For Support & Resistance:**
- **Above 80% line**: Look for selling opportunities (overbought zone)
- **Between 50-80%**: Bullish bias, pullbacks to 50% line for entries
- **Around 50% line**: Key equilibrium - watch for direction
- **Between 20-50%**: Bearish bias, bounces to 50% line for exits
- **Below 20% line**: Look for buying opportunities (oversold zone)
### **For Trend Analysis:**
- **EMA Stack Order**: Higher timeframe EMAs above lower = uptrend
- **Price above all EMAs**: Strong bullish momentum
- **Price below all EMAs**: Strong bearish momentum
- **EMA as dynamic support/resistance**: Bounces and rejections
### **For Entry Signals:**
- **Confluence zones**: Where Stochastic levels meet EMA levels
- **Breakouts**: Price breaking through multiple levels simultaneously
- **Reversals**: Price rejection at extreme Stochastic levels with EMA confirmation
## **⚙️ Settings**
### **Stochastic Ribbon**
- **Show/Hide**: Toggle the 3 Stochastic lines
- **Length**: Period for high/low calculation (default: 50)
- **Start**: Multiplier for calculation (default: 1)
### **EMAs**
- **Individual toggles**: Show/hide each EMA separately
- **Custom periods**: Adjust each EMA length (defaults: 20, 50, 100, 200)
- **Custom colors**: Personalize each EMA color
## **🚀 Why This Indicator?**
✅ **Clean & Simple**: No cluttered charts - just essential levels
✅ **Multi-Timeframe**: Works on all timeframes from 1m to 1W
✅ **Versatile**: Suitable for scalping, day trading, and swing trading
✅ **Low Lag**: Dynamic levels that adapt to current market conditions
✅ **Proven Components**: Combines two well-established technical concepts
✅ **Customizable**: Adjust all parameters to fit your trading style
## **💡 Pro Tips**
- **Use multiple timeframes**: Check higher timeframe alignment for stronger signals
- **Combine with volume**: Look for volume confirmation at key levels
- **Watch for confluences**: Best signals occur where multiple levels align
- **Respect the 50% line**: Often acts as the most important level for trend direction
## **📋 Technical Details**
- **Version**: Pine Script v5
- **Overlay**: Yes (displays on main price chart)
- **Plots**: 7 total (well within Pine Script limits)
- **Performance**: Optimized for fast loading and smooth operation
---
**Perfect for traders who want clear, actionable levels without chart clutter. Whether you're a beginner learning support/resistance or an experienced trader looking for clean reference points, this indicator delivers exactly what you need.**
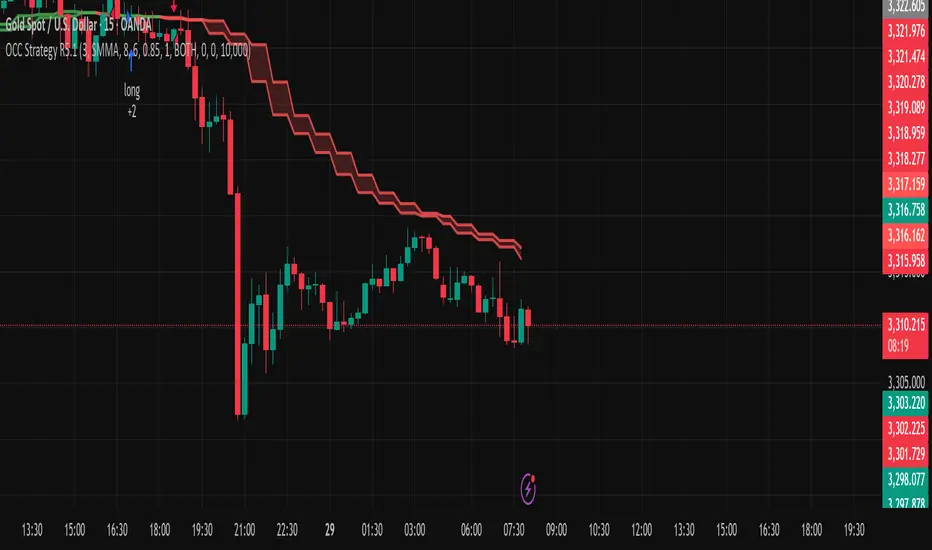
Open Close Cross Strategy R5 Delay//@version=5
//
strategy(title='Open Close Cross Strategy R5.1 revised by JustUncleL', shorttitle='OCC Strategy R5.1', overlay=true, pyramiding=0, default_qty_type=strategy.percent_of_equity, default_qty_value=10, calc_on_every_tick=false)
//
// Revision: 5
// Original Author: @JayRogers
// Revision Author: JustUncleL revisions 3, 4, 5
//
// *** USE AT YOUR OWN RISK ***
// - There are drawing/painting issues in pinescript when working across resolutions/timeframes that I simply
// cannot fix here.. I will not be putting any further effort into developing this until such a time when
// workarounds become available.
// NOTE: Re-painting has been observed infrequently with default settings and seems OK up to Alternate
// multiplier of 5.
// Non-repainting mode is available by setting "Delay Open/Close MA" to 1 or more, but the reported
// performance will drop dramatically.
//
// R5.1 Changes by JustUncleL
// - Upgraded to Version 3 Pinescript.
// - Added option to select Trade type (Long, Short, Both or None)
// - Added bar colouring work around patch.
// - Small code changes to improve efficiency.
// - NOTE: To enable non-Repainting mode set "Delay Open/Close MA" to 1 or more.
// 9-Aug-2017
// - Correction on SuperSmooth MA calculation.
//
// R5 Changes by JustUncleL
// - Corrected cross over calculations, sometimes gave false signals.
// - Corrected Alternate Time calculation to allow for Daily,Weekly and Monthly charts.
// - Open Public release.
// R4 Changes By JustUncleL
// - Change the way the Alternate resolution in selected, use a Multiplier of the base Time Frame instead,
// this makes it easy to switch between base time frames.
// - Added TMA and SSMA moving average options. But DEMA is still giving the best results.
// - Using "calc_on_every_tick=false" ensures results between backtesting and real time are similar.
// - Added Option to Disable the coloring of the bars.
// - Updated default settings.
//
// R3 Changes by JustUncleL:
// - Returned a simplified version of the open/close channel, it shows strength of current trend.
// - Added Target Profit Option.
// - Added option to reduce the number of historical bars, overcomes the too many trades limit error.
// - Simplified the strategy code.
// - Removed Trailing Stop option, not required and in my opion does not work well in Trading View,
// it also gives false and unrealistic performance results in backtesting.
//
// R2 Changes:
// - Simplified and cleaned up plotting, now just shows a Moving Average derived from the average of open/close.
// - Tried very hard to alleviate painting issues caused by referencing alternate resolution..
//
// Description:
// - Strategy based around Open-Close Crossovers.
// Setup:
// - I have generally found that setting the strategy resolution to 3-4x that of the chart you are viewing
// tends to yield the best results, regardless of which MA option you may choose (if any) BUT can cause
// a lot of false positives - be aware of this
// - Don't aim for perfection. Just aim to get a reasonably snug fit with the O-C band, with good runs of
// green and red.
// - Option to either use basic open and close series data, or pick your poison with a wide array of MA types.
// - Optional trailing stop for damage mitigation if desired (can be toggled on/off)
// - Positions get taken automagically following a crossover - which is why it's better to set the resolution
// of the script greater than that of your chart, so that the trades get taken sooner rather than later.
// - If you make use of the stops, be sure to take your time tweaking the values. Cutting it too fine
// will cost you profits but keep you safer, while letting them loose could lead to more drawdown than you
// can handle.
// - To enable non-Repainting mode set "Delay Open/Close MA" to 1 or more.
//
// === INPUTS ===
useRes = input(defval=true, title='Use Alternate Resolution?')
intRes = input(defval=3, title='Multiplier for Alernate Resolution')
stratRes = timeframe.ismonthly ? str.tostring(timeframe.multiplier * intRes, '###M') : timeframe.isweekly ? str.tostring(timeframe.multiplier * intRes, '###W') : timeframe.isdaily ? str.tostring(timeframe.multiplier * intRes, '###D') : timeframe.isintraday ? str.tostring(timeframe.multiplier * intRes, '####') : '60'
basisType = input.string(defval='SMMA', title='MA Type: ', options= )
basisLen = input.int(defval=8, title='MA Period', minval=1)
offsetSigma = input.int(defval=6, title='Offset for LSMA / Sigma for ALMA', minval=0)
offsetALMA = input.float(defval=0.85, title='Offset for ALMA', minval=0, step=0.01)
scolor = input(false, title='Show coloured Bars to indicate Trend?')
delayOffset = input.int(defval=1, title='Delay Open/Close MA (Forces Non-Repainting)', minval=0, step=1)
tradeType = input.string('BOTH', title='What trades should be taken : ', options= )
// === /INPUTS ===
// Constants colours that include fully non-transparent option.
green100 = #008000FF
lime100 = #00FF00FF
red100 = #FF0000FF
blue100 = #0000FFFF
aqua100 = #00FFFFFF
darkred100 = #8B0000FF
gray100 = #808080FF
// === BASE FUNCTIONS ===
// Returns MA input selection variant, default to SMA if blank or typo.
variant(type, src, len, offSig, offALMA) =>
v1 = ta.sma(src, len) // Simple
v2 = ta.ema(src, len) // Exponential
v3 = 2 * v2 - ta.ema(v2, len) // Double Exponential
v4 = 3 * (v2 - ta.ema(v2, len)) + ta.ema(ta.ema(v2, len), len) // Triple Exponential
v5 = ta.wma(src, len) // Weighted
v6 = ta.vwma(src, len) // Volume Weighted
v7 = 0.0
sma_1 = ta.sma(src, len) // Smoothed
v7 := na(v7 ) ? sma_1 : (v7 * (len - 1) + src) / len
v8 = ta.wma(2 * ta.wma(src, len / 2) - ta.wma(src, len), math.round(math.sqrt(len))) // Hull
v9 = ta.linreg(src, len, offSig) // Least Squares
v10 = ta.alma(src, len, offALMA, offSig) // Arnaud Legoux
v11 = ta.sma(v1, len) // Triangular (extreme smooth)
// SuperSmoother filter
// © 2013 John F. Ehlers
a1 = math.exp(-1.414 * 3.14159 / len)
b1 = 2 * a1 * math.cos(1.414 * 3.14159 / len)
c2 = b1
c3 = -a1 * a1
c1 = 1 - c2 - c3
v12 = 0.0
v12 := c1 * (src + nz(src )) / 2 + c2 * nz(v12 ) + c3 * nz(v12 )
type == 'EMA' ? v2 : type == 'DEMA' ? v3 : type == 'TEMA' ? v4 : type == 'WMA' ? v5 : type == 'VWMA' ? v6 : type == 'SMMA' ? v7 : type == 'HullMA' ? v8 : type == 'LSMA' ? v9 : type == 'ALMA' ? v10 : type == 'TMA' ? v11 : type == 'SSMA' ? v12 : v1
// security wrapper for repeat calls
reso(exp, use, res) =>
security_1 = request.security(syminfo.tickerid, res, exp, gaps=barmerge.gaps_off, lookahead=barmerge.lookahead_on)
use ? security_1 : exp
// === /BASE FUNCTIONS ===
// === SERIES SETUP ===
closeSeries = variant(basisType, close , basisLen, offsetSigma, offsetALMA)
openSeries = variant(basisType, open , basisLen, offsetSigma, offsetALMA)
// === /SERIES ===
// === PLOTTING ===
// Get Alternate resolution Series if selected.
closeSeriesAlt = reso(closeSeries, useRes, stratRes)
openSeriesAlt = reso(openSeries, useRes, stratRes)
//
trendColour = closeSeriesAlt > openSeriesAlt ? color.green : color.red
bcolour = closeSeries > openSeriesAlt ? lime100 : red100
barcolor(scolor ? bcolour : na, title='Bar Colours')
closeP = plot(closeSeriesAlt, title='Close Series', color=trendColour, linewidth=2, style=plot.style_line, transp=20)
openP = plot(openSeriesAlt, title='Open Series', color=trendColour, linewidth=2, style=plot.style_line, transp=20)
fill(closeP, openP, color=trendColour, transp=80)
// === /PLOTTING ===
//
//
// === ALERT conditions
xlong = ta.crossover(closeSeriesAlt, openSeriesAlt)
xshort = ta.crossunder(closeSeriesAlt, openSeriesAlt)
longCond = xlong // alternative: longCond ? false : (xlong or xlong ) and close>closeSeriesAlt and close>=open
shortCond = xshort // alternative: shortCond ? false : (xshort or xshort ) and close 0 ? tpPoints : na
SL = slPoints > 0 ? slPoints : na
// Make sure we are within the bar range, Set up entries and exit conditions
if (ebar == 0 or tdays <= ebar) and tradeType != 'NONE'
strategy.entry('long', strategy.long, when=longCond == true and tradeType != 'SHORT')
strategy.entry('short', strategy.short, when=shortCond == true and tradeType != 'LONG')
strategy.close('long', when=shortCond == true and tradeType == 'LONG')
strategy.close('short', when=longCond == true and tradeType == 'SHORT')
strategy.exit('XL', from_entry='long', profit=TP, loss=SL)
strategy.exit('XS', from_entry='short', profit=TP, loss=SL)
// === /STRATEGY ===
// eof
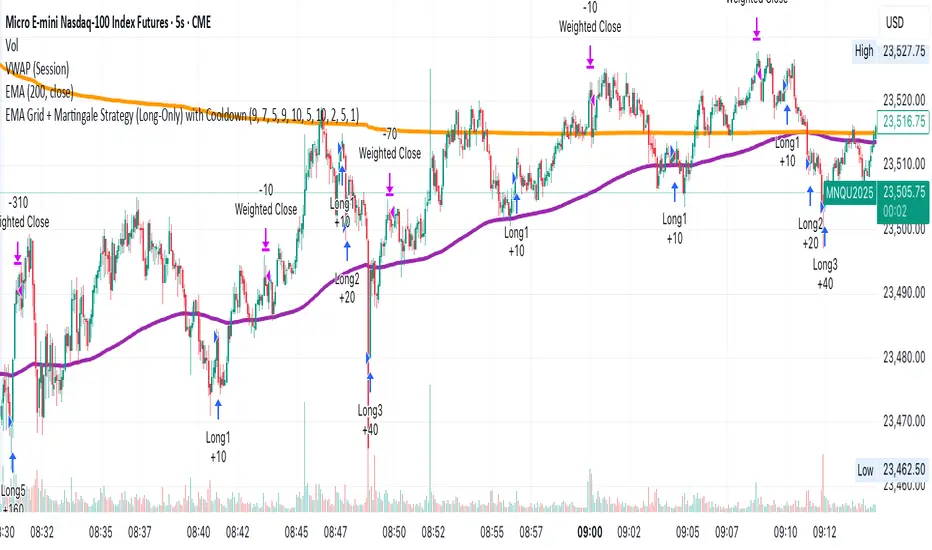
EMA Grid + Martingale Strategy (Long-Only) with CooldownTitle:
EMA Grid + Martingale Strategy (Long-Only) with Cooldown
Short Summary:
A long-only strategy combining EMA trend filters, grid-based entries, optional martingale sizing, and a cooldown feature to manage position timing and exits.
Full Description:
This strategy uses a 4-EMA trend confirmation system to detect bullish momentum, then deploys a grid-style entry method with optional martingale position sizing. It includes a cooldown mechanism to prevent reentry too soon after a completed trade cycle.
How It Works
1. Trend Confirmation: Two EMA groups (fast/slow) determine whether market conditions are bullish.
2. Initial Entry: A new position is entered when both EMA groups confirm an uptrend and no position is currently active.
3. Grid Entries: Additional long entries are placed when price drops by a defined pip distance from the last entry, respecting the maximum number of entries.
4. Martingale Sizing (Optional): Grid orders can increase in size with each level using a customizable multiplier.
5. Weighted-Average Exit: All positions close once price reaches or exceeds the average entry price plus a buffer.
6. Cooldown Timer: After closing a position set, the strategy waits a defined number of bars before opening a new grid.
Key Features
• 4 customizable EMAs for trend confirmation.
• Dynamic grid-style long entries based on pip intervals.
• Optional martingale-style position sizing.
• Weighted-average price exit logic with buffer control.
• Cooldown bar period to limit overtrading.
• Suitable for optimization and backtesting with full control over inputs.
Use Cases
• Designed for trending markets where pullbacks present entry opportunities.
• Helps manage staged entries while avoiding premature reentry.
• Ideal for testing martingale and grid-based strategies with exit precision.
Note: This strategy is for testing and educational purposes only. It does not guarantee profits and is not financial advice.
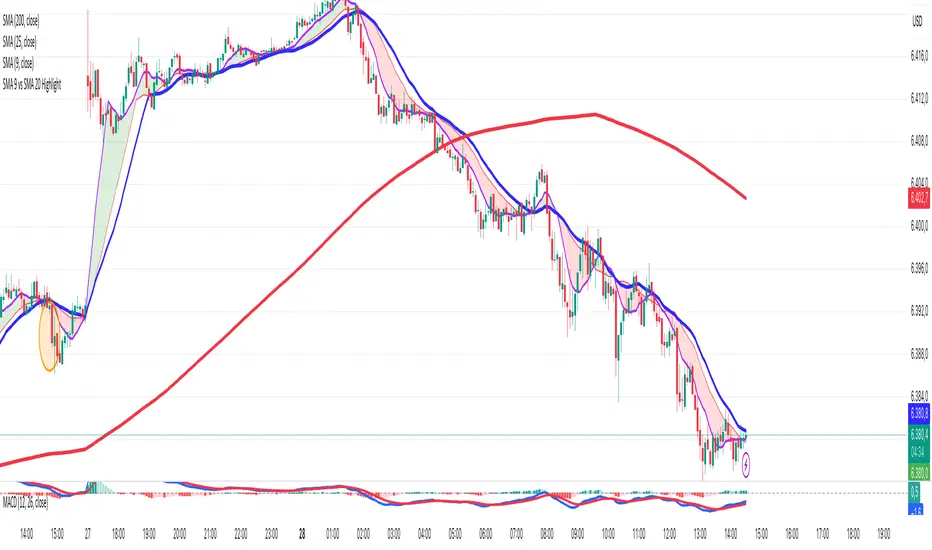
SMA 9 vs SMA 20 Highlight CrossoverHighlight in green the area in between the two SMA do that when the SMA cross above the SMA 20 periods the area is colored in green and when the SMA cross below the SMA 20 periods the area is colored in red
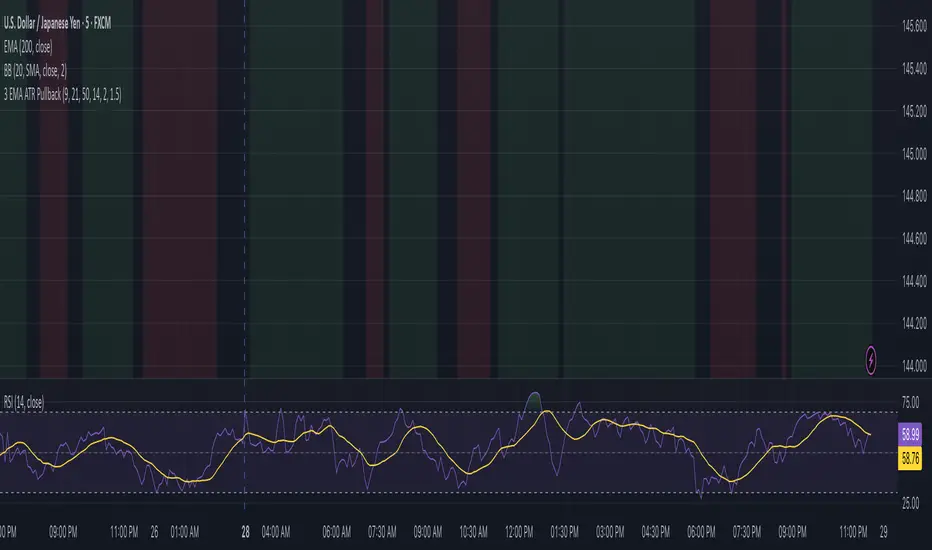
Advanced Swing Breakout + RSI + EMA + Smart Volume SpikeThis indicator is designed to identify high-probability swing trade setups using a confluence of:
Swing High/Low Breakouts
RSI Trend Strength
EMA Directional Bias
Smart Volume Spike Confirmation
It combines key price action levels with volume and momentum filters to generate clean, actionable breakout alerts. It’s perfect for both intraday and swing traders looking to trade breakouts with confirmation from multiple technical layers.
⚙️ How It Works:
✅ Swing Detection:
Plots Swing Highs and Swing Lows based on the past N candles.
Highlights breakouts above highs or breakdowns below lows.
💪 RSI Filter:
Confirms whether the breakout is supported by RSI momentum.
Bullish breakout requires RSI > 50 and price above EMA.
Bearish breakdown requires RSI < 50 and price below EMA.
📈 EMA Trend Bias:
EMA (default 20-period) shows directional bias.
Used as a filter to confirm trade direction.
🔊 Smart Volume Spike:
Detects significant volume spikes above a moving average threshold.
Color-coded bars show whether volume is bullish, bearish, or neutral.
Ensures breakout is not on weak or average volume.
🚨 Alerts Included:
✅ Break Above Swing High: Only triggers when RSI, EMA, and Volume all confirm the move.
⚠️ Break Below Swing Low: Triggered only when bearish conditions are met.
📊 Visual Output:
Swing Highs: 🔴 Red Dots
Swing Lows: 🟢 Green Dots
EMA Line: 🟠 Orange Line
Volume Spike Bars: Appears in separate pane with dynamic color logic.
🧠 Best Use Cases:
Intraday Scalping (5m–15m timeframes)
Swing Trading (1H–4H)
Breakout Confirmation
Volume-Supported Entry Filtering

3 EMA Pullback Strategy with ATRThis script will not only plot the moving averages but also identify potential trade setups by highlighting trend conditions, marking entry points, and dynamically plotting the corresponding Stop Loss and Take Profit levels directly on your chart.
Here is the Pine Script code for your strategy.
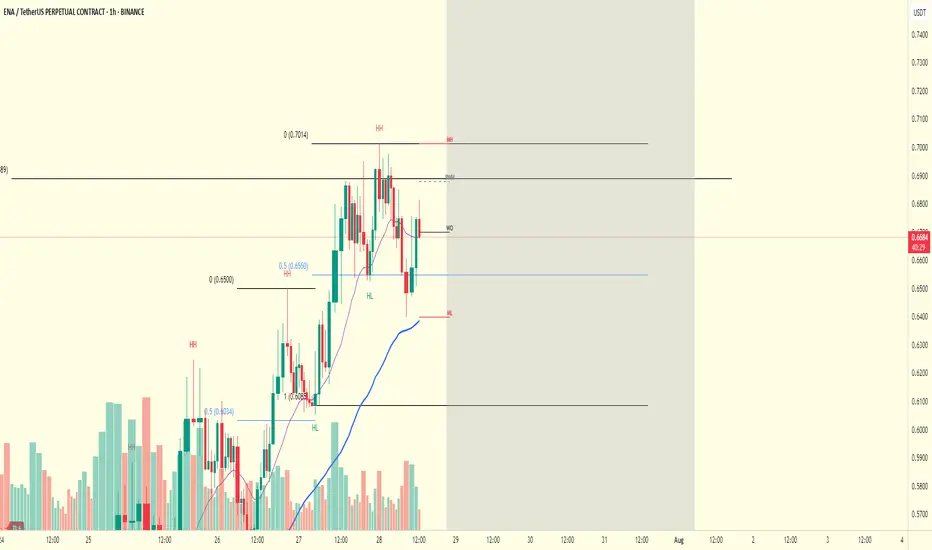
Givemepeace EMA + Market Structure//@version=6
indicator("Givemepeace EMA + Market Structure", overlay=true, max_lines_count=20, max_labels_count=50)
//Settings
length = input.int(21, "Swing Length", minval=5, maxval=50)
ema_length = input.int(55, "EMA Length", minval=1)
show_ema = input.bool(true, "Show EMA Lines")
show_swing = input.bool(true, "Show Swing Points")
show_fibo = input.bool(true, "Show Fibonacci Levels")
show_weekly = input.bool(true, "Show Weekly Levels")
show_monday = input.bool(true, "Show Monday High/Low")
show_prev_weekly = input.bool(true, "Show Previous Weekly Levels")
//Style
swinghCss = input.color(color.red, 'Swing High Color', group = 'Style')
swinglCss = input.color(color.teal, 'Swing Low Color', group = 'Style')
// EMA Lines
ema_15m = request.security(syminfo.tickerid, "15", ta.ema(close, ema_length))
ema_1h = request.security(syminfo.tickerid, "60", ta.ema(close, ema_length))
ema_4h = request.security(syminfo.tickerid, "240", ta.ema(close, ema_length))
// Plot EMA lines
plot(show_ema ? ema_15m : na, title="EMA 15m", color=color.purple, linewidth=1)
plot(show_ema ? ema_1h : na, title="EMA 1H", color=color.blue, linewidth=2)
plot(show_ema ? ema_4h : na, title="EMA 4H", color=color.red, linewidth=3)
// Weekly Levels
weekly_open = request.security(syminfo.tickerid, "1W", open, lookahead=barmerge.lookahead_on)
prev_weekly_open = request.security(syminfo.tickerid, "1W", open , lookahead=barmerge.lookahead_on)
prev_weekly_high = request.security(syminfo.tickerid, "1W", high , lookahead=barmerge.lookahead_on)
prev_weekly_low = request.security(syminfo.tickerid, "1W", low , lookahead=barmerge.lookahead_on)
// Monday High/Low (first day of week)
is_monday = dayofweek == dayofweek.monday
var float monday_high = na
var float monday_low = na
if is_monday and na(monday_high )
monday_high := high
monday_low := low
else if is_monday
monday_high := math.max(monday_high, high)
monday_low := math.min(monday_low, low)
// Reset Monday levels on new week
if ta.change(time("1W")) != 0
monday_high := na
monday_low := na
// Draw horizontal lines with labels (only latest ones)
var line wo_line = na
var line mh_line = na
var line ml_line = na
var line pwo_line = na
var line pwh_line = na
var line pwl_line = na
var label wo_label = na
var label mh_label = na
var label ml_label = na
var label pwo_label = na
var label pwh_label = na
var label pwl_label = na
if show_weekly and not na(weekly_open) and barstate.islast
if not na(wo_line)
line.delete(wo_line)
label.delete(wo_label)
wo_line := line.new(bar_index, weekly_open, bar_index + 10, weekly_open, color=color.black, width=1, style=line.style_solid)
wo_label := label.new(bar_index + 10, weekly_open, "WO", style=label.style_none, color=color(na), textcolor=color.black, size=size.small)
if show_monday and not na(monday_high) and barstate.islast
if not na(mh_line)
line.delete(mh_line)
label.delete(mh_label)
mh_line := line.new(bar_index, monday_high, bar_index + 10, monday_high, color=color.red, width=1, style=line.style_solid)
mh_label := label.new(bar_index + 10, monday_high, "MH", style=label.style_none, color=color(na), textcolor=color.red, size=size.small)
if show_monday and not na(monday_low) and barstate.islast
if not na(ml_line)
line.delete(ml_line)
label.delete(ml_label)
ml_line := line.new(bar_index, monday_low, bar_index + 10, monday_low, color=color.red, width=1, style=line.style_solid)
ml_label := label.new(bar_index + 10, monday_low, "ML", style=label.style_none, color=color(na), textcolor=color.red, size=size.small)
// Previous Weekly Levels
if show_prev_weekly and not na(prev_weekly_open) and barstate.islast
if not na(pwo_line)
line.delete(pwo_line)
label.delete(pwo_label)
pwo_line := line.new(bar_index, prev_weekly_open, bar_index + 10, prev_weekly_open, color=color.gray, width=1, style=line.style_dashed)
pwo_label := label.new(bar_index + 10, prev_weekly_open, "PWO", style=label.style_none, color=color(na), textcolor=color.gray, size=size.small)
if show_prev_weekly and not na(prev_weekly_high) and barstate.islast
if not na(pwh_line)
line.delete(pwh_line)
label.delete(pwh_label)
pwh_line := line.new(bar_index, prev_weekly_high, bar_index + 10, prev_weekly_high, color=color.gray, width=1, style=line.style_dashed)
pwh_label := label.new(bar_index + 10, prev_weekly_high, "PWH", style=label.style_none, color=color(na), textcolor=color.gray, size=size.small)
if show_prev_weekly and not na(prev_weekly_low) and barstate.islast
if not na(pwl_line)
line.delete(pwl_line)
label.delete(pwl_label)
pwl_line := line.new(bar_index, prev_weekly_low, bar_index + 10, prev_weekly_low, color=color.gray, width=1, style=line.style_dashed)
pwl_label := label.new(bar_index + 10, prev_weekly_low, "PWL", style=label.style_none, color=color(na), textcolor=color.gray, size=size.small)
// Swing Detection (LuxAlgo style)
var float phy = na // Previous high
var float ply = na // Previous low
var float last_hh = na // Last Higher High
var float last_hl = na // Last Higher Low
var int last_hh_bar = na
var int last_hl_bar = na
ph = ta.pivothigh(length, length)
pl = ta.pivotlow(length, length)
n = bar_index
// Process Swing Highs
if not na(ph)
H = ph > phy ? 'HH' : 'LH'
if show_swing
label.new(n , ph, H, color = color(na), style = label.style_label_down, textcolor = swinghCss, size = size.normal)
// Track HH for Fibonacci
if H == 'HH'
last_hh := ph
last_hh_bar := n
phy := ph
// Process Swing Lows
if not na(pl)
L = pl < ply ? 'LL' : 'HL'
if show_swing
label.new(n , pl, L, color = color(na), style = label.style_label_up, textcolor = swinglCss, size = size.normal)
// Track HL and draw Fibonacci from last HH to this HL
if L == 'HL' and show_fibo and not na(last_hh)
last_hl := pl
last_hl_bar := n
// Calculate Fibonacci levels from HH to HL
swing_range = last_hh - last_hl
fib_236 = last_hl + (swing_range * 0.236)
fib_382 = last_hl + (swing_range * 0.382)
fib_500 = last_hl + (swing_range * 0.500)
fib_618 = last_hl + (swing_range * 0.618)
fib_705 = last_hl + (swing_range * 0.705)
fib_786 = last_hl + (swing_range * 0.786)
// Draw Fibonacci lines from HH to future
start_bar = last_hh_bar
end_bar = bar_index + 30
// Draw key Fibonacci levels
line.new(start_bar, fib_236, end_bar, fib_236, color=color.gray, width=1, style=line.style_dotted)
line.new(start_bar, fib_382, end_bar, fib_382, color=color.blue, width=1, style=line.style_dashed)
line.new(start_bar, fib_500, end_bar, fib_500, color=color.purple, width=2, style=line.style_solid)
line.new(start_bar, fib_618, end_bar, fib_618, color=color.yellow, width=2, style=line.style_dashed)
line.new(start_bar, fib_705, end_bar, fib_705, color=color.orange, width=2, style=line.style_dashed)
line.new(start_bar, fib_786, end_bar, fib_786, color=color.red, width=1, style=line.style_dashed)
// Add Fibonacci labels
label.new(end_bar - 5, fib_236, "23.6", style=label.style_label_left, color=color.gray, textcolor=color.white, size=size.small)
label.new(end_bar - 5, fib_382, "38.2", style=label.style_label_left, color=color.blue, textcolor=color.white, size=size.small)
label.new(end_bar - 5, fib_500, "50.0", style=label.style_label_left, color=color.purple, textcolor=color.white, size=size.small)
label.new(end_bar - 5, fib_618, "61.8", style=label.style_label_left, color=color.yellow, textcolor=color.black, size=size.small)
label.new(end_bar - 5, fib_705, "70.5", style=label.style_label_left, color=color.orange, textcolor=color.black, size=size.small)
label.new(end_bar - 5, fib_786, "78.6", style=label.style_label_left, color=color.red, textcolor=color.white, size=size.small)
// Add info box
if barstate.islast
var table info_table = table.new(position.top_right, 2, 5, bgcolor=color.white, border_width=1)
table.cell(info_table, 0, 0, "Last HH:", text_color=color.black, text_size=size.small)
table.cell(info_table, 1, 0, str.tostring(last_hh, '#.####'), text_color=color.red, text_size=size.small)
table.cell(info_table, 0, 1, "Last HL:", text_color=color.black, text_size=size.small)
table.cell(info_table, 1, 1, str.tostring(last_hl, '#.####'), text_color=color.teal, text_size=size.small)
table.cell(info_table, 0, 2, "Fib Range:", text_color=color.black, text_size=size.small)
table.cell(info_table, 1, 2, str.tostring(swing_range, '#.####'), text_color=color.blue, text_size=size.small)
table.cell(info_table, 0, 3, "WO:", text_color=color.black, text_size=size.small)
table.cell(info_table, 1, 3, str.tostring(weekly_open, '#.####'), text_color=color.black, text_size=size.small)
table.cell(info_table, 0, 4, "Mon H/L:", text_color=color.black, text_size=size.small)
table.cell(info_table, 1, 4, str.tostring(monday_high, '#.##') + "/" + str.tostring(monday_low, '#.##'), text_color=color.red, text_size=size.small)
ply := pl
Elliott Wave Probability System Pro v2🎯 Major Improvements Made to Elliott Wave Script
Key Changes:
1. Advanced Trend Detection (Lines 55-82)
Uses 5 different methods to determine trend over last 75 bars:
Price position in range
Linear regression slope
Moving average alignment
Higher highs/lows pattern
Up vs down bar count
Combines all methods into a trendScore for accurate direction
2. Adaptive Target Direction
New input: adaptiveTargets (line 28) - can toggle on/off
When ON: Targets follow the 75-bar trend regardless of short-term indicators
When OFF: Works like original (based on current momentum)
3. Improved Target Calculation
Bullish targets use extensions from current price to recent high
Bearish targets use retracements from current price to recent low
More realistic price levels based on actual market structure
4. Enhanced Status Display
Added "Trend (75 bars)" row showing BULLISH/BEARISH/NEUTRAL
Helps you see why targets are pointing a certain direction
5. Better Probability Calculation
Base probability adjusts with trend strength (70% if strong trend, 50% if not)
Gradual probability decay with distance
Minimum 15% probability (more realistic than 10%)
New Features:
Trend-Based Alerts
Alerts when 75-bar trend changes from bullish to bearish (or vice versa)
Trend Weight in Scoring
Added trendWeight to the total score calculation
Makes signals more aligned with larger trend
Visual Improvements
Projection lines now show at 40% probability (was 50%)
Better visibility of likely targets
How It Works Now:
If last 75 bars show a downtrend , targets will be bearish (even if RSI is oversold)
If last 75 bars show an uptrend , targets will be bullish (even if RSI is overbought)
The probability adjusts based on trend strength
This solves the issue where the script was showing bullish targets in a clear downtrend. Now it properly reflects the dominant trend direction while still considering short-term indicators for probability calculations.

filter duplicate buy sell short cover signals[VP]I was looking for an indicator that would filter signals but could only find solutions for a buy/sell system. I couldn't locate one that dealt with buy/sell AND short/cover.
The indicator expands the idea from the link:
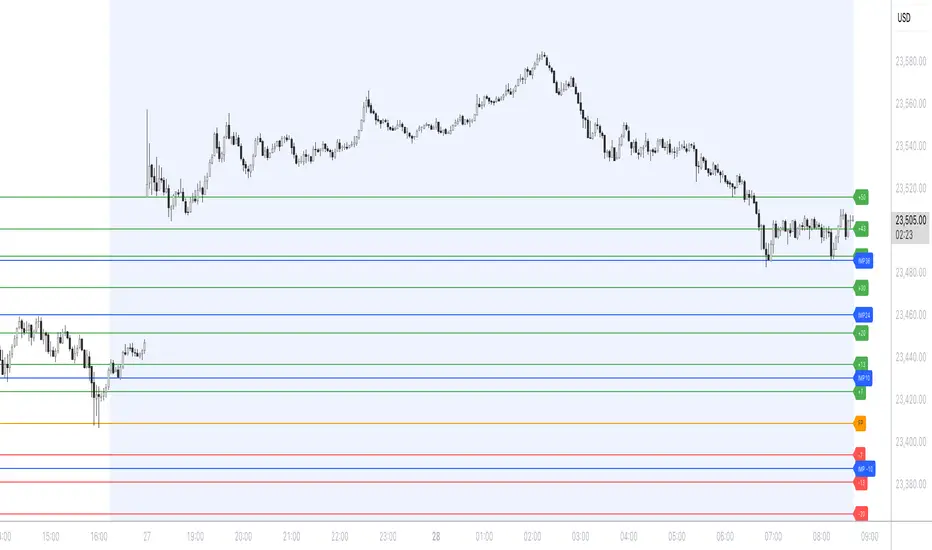
stackoverflow.com

Twin Tower Levels – Hopi Method (Old)This is the previous version of the Twin Tower script, which is based on the ADR (Average Daily Range) method.
It is not a full implementation of Hopiplaka’s original Twin Tower strategy — the levels are calculated using ADR instead of official CME circuit breaker price limits.
Note:
For the most accurate and official Twin Tower levels on CME indices (NQ, ES, etc.), please use the latest script version with circuit breaker inputs as described by Hopiplaka.
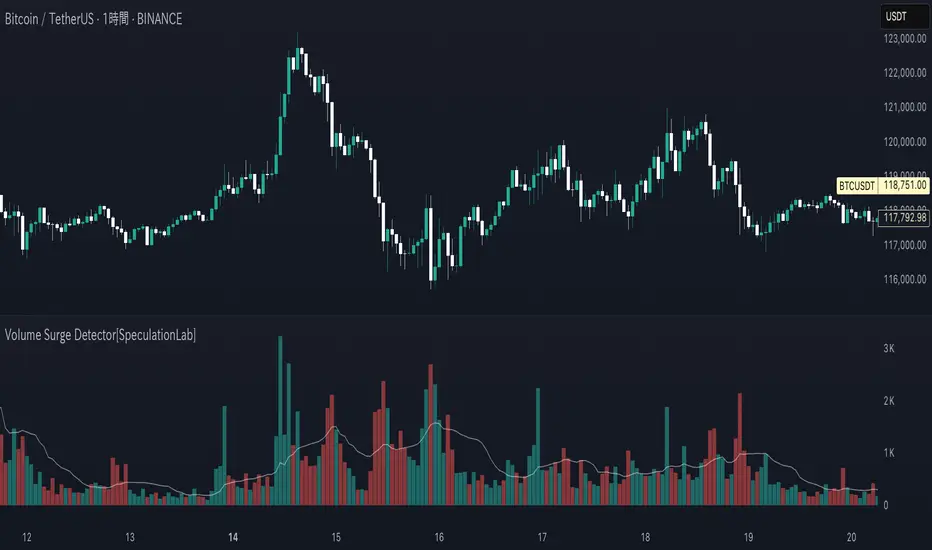
Volume Surge Detector[SpeculationLab]Volume Surge Detector
This tool is especially useful for spotting early signs of breakouts, news-driven spikes, or institutional activity that are often preceded by abnormal surges in volume.
For better chart readability, the volume bar colors are based on TradingView’s original Volume indicator, while all other code is fully original by Speculation Lab.
You can customize both the SMA line and the volume bar colors to fit your style.
The logic compares the current volume against its SMA (default length: 14, fully adjustable).
The script comes with two surge levels:
Surge Level 1 (default = 5) → When volume is more than 5× the SMA, the bar turns aqua.
Surge Level 2 (default = 10) → When volume is more than 10× the SMA, the bar turns yellow.
It also includes built-in alerts, so you’ll be notified instantly whenever a surge is detected.
This makes it easier to spot potential breakout moves or large market participation in real time.
Disclaimer: This script is for educational purposes only. It does not provide financial advice.
这是一个用于探测 成交量爆发 的指标。
为了图表美观,成交量柱的颜色借鉴了 TradingView 原始 Volume 指标,其余代码均为 Speculation Lab 原创。
用户可以自由调整成交量柱和其对应的 SMA 均线的颜色。
指标通过对比成交量和其 SMA(默认长度为14,可自定义长度和颜色)的比例来检测放量。
默认设置了两个放量级别:
Surge Level 1(默认=5):当成交量超过均量的 5 倍时,量柱变为水蓝色。
Surge Level 2(默认=10):当成交量超过均量的 10 倍时,量柱变为黄色。
脚本还设置了 内置警报功能,方便交易者在出现放量时实时收到通知。
Trading Panel with EMA Crossovers## Trading Panel with EMA Crossovers - Description
**What it does:**
This indicator creates a comprehensive trading dashboard that monitors 6 key technical indicators and displays them in an easy-to-read table at the bottom right of your chart. It analyzes market conditions in real-time and provides clear buy/sell signals based on multiple confirmation factors.
**Key Features:**
1. **EMA Crossover Tracking (7/21 & 50/200)**
- Shows whether fast EMAs are above (CROSSOVER/BULL) or below (CROSSUNDER/BEAR) slow EMAs
- Helps identify trend direction and potential entry/exit points
- The 7/21 catches short-term momentum shifts
- The 50/200 confirms longer-term trend strength
2. **Momentum Indicators**
- **RSI**: Identifies overbought (>70) and oversold (<30) conditions
- **MFI**: Similar to RSI but includes volume, making it more reliable
- **MACD**: Confirms trend direction and momentum shifts
3. **Volume Analysis**
- **OBV (On Balance Volume)**: Shows whether smart money is accumulating or distributing
- Helps confirm if price moves are supported by volume
4. **Overall Signal System**
- Counts bullish vs bearish signals from all indicators
- Provides clear BUY/SELL/STRONG BUY/STRONG SELL recommendations
- When both EMAs align (both bull or both bear), it triggers the strongest signals
**Why it's helpful:**
1. **All-in-One View**: Instead of cluttering your chart with multiple indicators, everything is condensed into one clean table
2. **Multiple Confirmation**: Combines trend (EMAs), momentum (RSI/MFI/MACD), and volume (OBV) for more reliable signals
3. **Visual Clarity**: Color-coded signals (green for bullish, red for bearish) make it easy to assess market conditions at a glance
4. **Reduces False Signals**: By requiring multiple indicators to align, it filters out weak trades
5. **Time-Saving**: No need to check multiple indicators manually - the "OVERALL" row gives you an instant market assessment
**Best Use Cases:**
- Trend following: Enter when overall signal shows BUY/STRONG BUY in an uptrend
- Reversal spotting: Watch for divergences between price and indicators
- Risk management: Avoid trades when signals are mixed or neutral
- Confirmation tool: Use alongside your existing strategy for extra confidence
This indicator is particularly effective for swing traders and position traders who want a quick, comprehensive view of market conditions before making trading decisions.

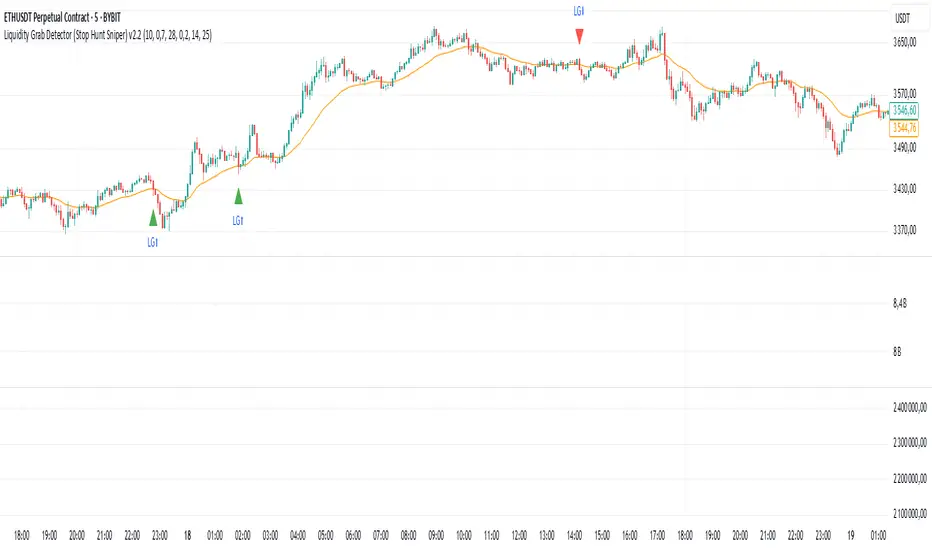
Liquidity Grab Detector (Stop Hunt Sniper) v2.2📌 Purpose
This indicator detects Stop Hunts (Liquidity Grabs) — false breakouts above/below recent highs or lows — filtered by trend direction, volatility, and volume conditions.
It is designed for scalpers and intraday traders who want to identify high-probability reversal zones.
🧠 How It Works
1. Key Logic
Detects previous swing high / swing low over the Lookback Bars.
Marks a false breakout when price moves beyond the level and closes back inside.
Requires a volume spike on the breakout to confirm liquidity sweep.
2. Trend Filter (EMA 50)
Bullish signals only if price is above EMA 50.
Bearish signals only if price is below EMA 50.
This removes most counter-trend stop hunts.
3. ADX Filter
Signals appear only when ADX < Max ADX (low-trend conditions).
This avoids false signals in strong trending markets.
📈 How to Use
Green Arrows: Bullish stop hunt (potential long entry).
Red Arrows: Bearish stop hunt (potential short entry).
Works best in range conditions, liquidity zones, or near session highs/lows.
Combine with order flow, volume profile, or price action for extra confirmation.
Recommended Timeframes: 1m–15m for scalping; 30m–1h for intraday.
Markets: Crypto, Forex, Indices.
⚙️ Inputs
Lookback Bars — swing detection
Volume Spike Multiplier
EMA Length (trend filter)
Min Retrace — how much price must return inside range
Max ADX — trend filter sensitivity
⚠️ Disclaimer
This script is for educational purposes only and does not constitute financial advice.
Always test thoroughly before live trading.