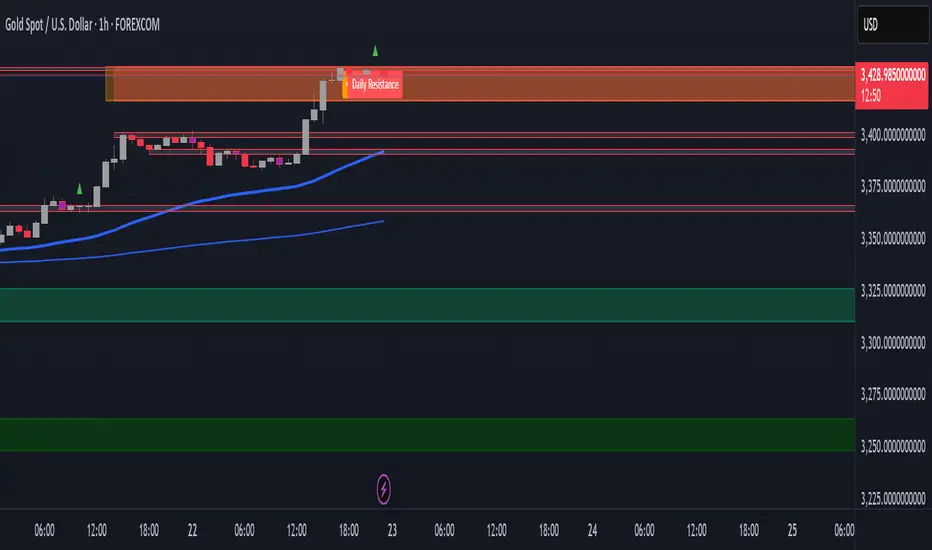
EMA/MA Unified with Pivot S/RTitle: Moving Average Combined with Pivot Point Support and Resistance Strategy
Description: This indicator combines two powerful trading concepts: 1. Moving Average Crossover; 2. Pivot Point Support and Resistance. It provides traders with a versatile tool.
Features:
Moving Average Crossover: Use moving average groups to identify trend trends. Contains multiple EMAs and one SMA to highlight short-term, medium-term and long-term market trends.
Detection of Golden Cross and Dead Cross: to predict market trends.
Support and Resistance: Dynamically identify key support and resistance levels based on pivot points. Configurable lookback period for left and right pivot points to suit different trading styles and time frames. Fast right pivot point option captures recent market volatility and optimizes support and resistance areas.
Customization:
Traders can adjust the length of the moving average according to their trading strategy. The support and resistance display can be toggled to get a clearer chart as needed.
Trend Analysis:
When EMA240S crosses EMA1440, a weak golden cross (X symbol) is drawn, suggesting that the main trend may turn to a bullish trend; when EMA720 crosses EMA1440, a strong golden cross (upward triangle) is drawn, suggesting that the main trend is likely to turn to a bullish trend.
When EMA240S crosses EMA1440, a weak death cross (X symbol) is drawn, suggesting that the main trend may turn to a bearish trend; when EMA720 crosses EMA1440, a strong death cross (downward triangle) is drawn, suggesting that the main trend is likely to turn to a bearish trend.
Visualization:
Moving averages are displayed in different color to depict the strength and direction of the trend.
Support and resistance levels are drawn in different color, enhancing the visual appeal and readability of key price levels.
This comprehensive indicator is designed for traders who seek to combine the accuracy of support and resistance analysis with the trend-following ability of moving average crossovers, providing a powerful basis for making informed trading decisions.
——————————————————————————————————————————————————————————
标题:
移动平均线结合轴枢点支阻位策略
描述:
该指标融合了两个强大的交易概念:1. 移动平均线交叉;2. 轴枢点支撑压力位。为交易者提供了一个多功能工具。
特点:
移动平均线交叉: 利用均线组识别趋势走势。包含多条EMA和一条SMA,以突出显示短期、中期和长期的市场趋势。
检测金叉和死叉:以预示市场趋势。
支撑位和阻力位: 基于枢轴点动态识别关键支撑位和阻力位。 可配置左右枢轴点的回溯期,以适应不同的交易风格和时间框架。 快速右轴点选项可捕捉近期市场波动并优化支撑位和阻力位区域。
自定义:
交易者可以根据自己的交易策略调整移动平均线的长度。 支撑位和阻力位显示可以切换,以便根据需要获得更清晰的图表。
趋势研判:
当EMA240S上穿EMA1440时,绘制弱金叉(X符号),暗示主趋势可能转为多头趋势;当EMA720上穿EMA1440时,绘制强金叉(向上三角),暗示主趋势大概率转为多头。
当EMA240S下穿EMA1440时,绘制弱死叉(X符号),暗示主趋势可能转为空头趋势;当EMA720下穿EMA1440时,绘制强死叉(向下三角),暗示主趋势大概率转为空头。
可视化:
移动平均线以不同的颜色显示,以描绘趋势的强度和方向。
支撑位和阻力位以不同的颜色绘制,增强了关键价格水平的视觉吸引力和可读性。
这款综合指标专为寻求将支撑位和阻力位分析的精准性与移动平均线交叉的趋势跟踪能力相结合的交易者而设计,为做出明智的交易决策提供了一个强大的判断依据。
Moving Averages

MB Notes + ATR + EMA 5/10/20This custom indicator combines essential trading tools in a single overlay:
✅ MB Notes Panel (Top-Right):
A static display for manual input values labeled E-MB, V-MB, and C-MB. Ideal for tracking personal bias, setups, or trade context directly on the chart. Inputs are fully editable.
✅ ATR Table (Bottom-Right):
Automatically displays 14-period Average True Range on the 30-minute and 1-hour timeframes. Helps assess short-term volatility and manage stop-loss or position sizing more effectively.
✅ EMA Overlay:
Plots Exponential Moving Averages for periods 5, 10, and 20. These dynamic support/resistance levels help traders identify short-term trend direction and momentum shifts.
📌 Designed for intraday and swing traders who want a clean, customizable, and multi-purpose utility indicator.

1H LONG Setup CheckerThis TradingView script identifies high-probability long setups on the 1-hour chart by evaluating five key technical conditions: price above the 200 MA, a higher low structure, RSI above 50 and rising, a bullish MACD crossover, and a breakout above recent resistance. When at least four of these are met, it signals a potential long opportunity with a visual label and background highlight. This tool is useful for traders seeking objective, rule-based entries in trending markets like SOL/USDC and PEPE/USDC.

EMA200 HUD + ATR + Live WickThis indicator displays:
• EMA200 deviation in USD and %
• ATR (Average True Range) and ATR multiples
• Live wick % (up/down) with alerts if wick > 2%
EMA BUY/SELLEMA
Buy/sell using ema cross over for making trading simple.
you even have the option to change the EMAs when needed
EMA Buy/SellBuy /Sell using EMA Crossover.
this gives early signal foy both buying and selling and one can use this to take the trades
Normalized Price Line with Adjustable Slope‑EMAThis anchored, normalized chart lets you see true percentage moves and swing pivots at a glance—removing guesswork about entry and exit levels. The noise‑filtered, slope‑colored EMAs then highlight only meaningful trend shifts, so you act on real momentum rather than every price twitch.
By anchoring price to a single starting bar, the indicator turns absolute price into a scale‑free “performance” line, where a value of 1.25 means price is up 25% since the anchor, and 0.80 means it’s down 20%. Overlaying that with a midpoint “shelf” line shows key swing levels where price has historically bounced or broken through. When your normalized price crosses above or below this reclaim level, you get an immediate read on whether a swing recovery or breakdown is occurring.
Layered on top are dynamically colored EMAs: a custom “Slope EMA” that changes color based on its recent slope, and classic 83‑ and 200‑period EMAs on the normalized series. The Slope EMA filters out noise by only turning your chosen up, down, or flat colors when its acceleration truly shifts. Meanwhile, crossovers of the faster 83‑EMA over the slower 200‑EMA give you traditional trend‑following confirmation. Together, these elements blend relative performance, structural support, and trend strength into one view—helping you spot higher‑probability entries and stay aligned with market momentum.
Intended for advanced users because user options are nuanced. For example, this indicator plots relative performance rather than raw price, you’ll want to toggle between linear and logarithmic scales (via the “Log” button on the y‑axis) and use the “Anchor” button to lock in your starting reference. That way, every move is shown in the same “language” of percentage moves, ensuring you’re comparing apples to apples across timeframes.

Persistent 1H S/R Zones with Labels (No Overlap) + 50 EMAit helps find recant support and resistance zones with swing points

Persistent Daily & 4H S/R Zones with Labels + 50 EMAit helps find swing high and lows support and ressistsance
MA Crossover with +100 Target Label//@version=5
indicator("MA Crossover with +100 Target Label", overlay=true)
// === Input Parameters ===
shortPeriod = input.int(10, title="Short MA Period")
longPeriod = input.int(100, title="Long MA Period")
pointTarget = input.float(100.0, title="Target Points", step=0.1)
// === Moving Averages ===
shortMA = ta.sma(close, shortPeriod)
longMA = ta.sma(close, longPeriod)
// === Plotting MAs ===
plot(shortMA, title="Short MA", color=color.orange)
plot(longMA, title="Long MA", color=color.blue)
// === Crossover Detection ===
bullishCross = ta.crossover(shortMA, longMA)
bearishCross = ta.crossunder(shortMA, longMA)
// === Variables to Track Entry and Targets ===
var float buyPrice = na
var float sellPrice = na
var bool buyActive = false
var bool sellActive = false
// === On Buy Signal ===
if bullishCross
buyPrice := close
buyActive := true
sellActive := false // Reset opposite signal
sellPrice := na
label.new(bar_index, low, "Buy", style=label.style_label_up, color=color.green, textcolor=color.white)
// === On Sell Signal ===
if bearishCross
sellPrice := close
sellActive := true
buyActive :=

Two MA Crossover with Labels//@version=5
indicator("Two MA Crossover with Labels", overlay=true)
// === Input Parameters ===
shortPeriod = input.int(10, title="Short MA Period")
longPeriod = input.int(100, title="Long MA Period")
// === Moving Averages ===
shortMA = ta.sma(close, shortPeriod)
longMA = ta.sma(close, longPeriod)
// === Plotting MAs ===
plot(shortMA, color=color.orange, title="Short MA")
plot(longMA, color=color.blue, title="Long MA")
// === Crossover Conditions ===
bullishCross = ta.crossover(shortMA, longMA)
bearishCross = ta.crossunder(shortMA, longMA)
// === Labels ===
if bullishCross
label.new(bar_index, low, "Buy", style=label.style_label_up, color=color.green, textcolor=color.white)
if bearishCross
label.new(bar_index, high, "Sell", style=label.style_label_down, color=color.red, textcolor=color.white)
Trend StrengthTrend Strength Dashboard (11-Point System)
Description:
This indicator is a visually enhanced dashboard that evaluates 11 key technical signals to assess bullish momentum for stocks and ETFs. Each condition is displayed in a easy reading table for quick interpretation and visual appeal.
Signals include:
Higher highs and higher lows
Price above EMA21 and SMA200
SMA50 > SMA200
Positive slope on SMA50 and SMA200
RSI trending upward
Ideal for traders who want a clean, at-a-glance summary of market strength without scanning multiple charts or indicators.

HMA Trend Line (Croc Signal Line)HMA Trend Line (Croc Signal Line) — The Ultimate Hull Moving Average Trend Indicator
Full English description here:
What is the HMA Trend Line (Croc Signal Line)?
The HMA Trend Line (Croc Signal Line) is a powerful, adaptive trend indicator for TradingView, based on the Hull Moving Average (HMA). This indicator is designed to help traders identify real market trends with less lag and reduced noise compared to traditional moving averages like SMA (Simple Moving Average) and EMA (Exponential Moving Average).
Why use the HMA Trend Line?
+ Faster Trend Detection: The Hull Moving Average (HMA) responds more quickly to price action, giving you earlier buy and sell signals.
+ Smoother and Cleaner: It provides a visually clean trend line that avoids the choppiness of classic EMAs and SMAs.
+ Reduced Lag: The HMA Trend Line follows the market closer, helping you avoid late entries or exits and spot trend reversals sooner.
+ Dynamic Support and Resistance: Use the line as a dynamic support or resistance to manage trades and identify pullbacks or breakouts.
What does “Croc Signal Line” mean?
The “Croc” in Croc Signal Line stands for:
+ Clean
+ Responsive
+ Optimized
+ Curve
This highlights the unique advantage of this indicator: a curve that is both fast-reacting and smooth, helping traders focus on real trends and filter out market noise.
How does the Hull Moving Average (HMA) work?
The HMA was developed by Alan Hull and uses weighted moving averages and a unique calculation to deliver both responsiveness and smoothness. Unlike standard moving averages, the HMA reacts faster to new price moves and avoids false signals in ranging or volatile markets.
How to use the HMA Trend Line (Croc Signal Line) on TradingView?
+ Watch for price crossing above the trend line for potential bullish signals, and below for bearish signals.
+ Use on any timeframe: from 1-minute scalping to daily, weekly, or even monthly charts.
+ Works with all asset classes: Forex, stocks, indices, cryptocurrencies, commodities, and futures.
+ Combine with other indicators (like Stochastics, RSI, or volume) for confirmation and to build your unique trading strategy.
+ Adjust the Signal Line Period for your market and style: shorter periods for faster markets, longer for smoother trends.
Who should use this indicator?
+ Day traders, swing traders, and long-term investors looking for reliable, actionable trend signals.
+ Anyone seeking a cleaner, more responsive alternative to the classic moving averages.
+ Traders who want a simple, visually clear way to filter out market noise and see real price direction.
Disclaimer:
This indicator is for educational and study purposes only. Please perform your own backtesting and analysis before using it in live trading. This script does not constitute financial advice. Use at your own risk.
--------

EMA9 vs EMA20 (Estilo MACD, eje acotado)🔷 What does it do?
Plots a moving line that represents the difference between the 9-period EMA and the 20-period EMA.
The zero level acts as the baseline (i.e., EMA20).
Every time the line crosses zero:
📈 Bullish crossover → EMA9 crosses above EMA20.
📉 Bearish crossover → EMA9 crosses below EMA20.
🔒 Visual clarity:
The chart is locked between -600 and +600, making crossovers easy to see without scaling issues.
Perfect for confirming trend direction or momentum shifts.
🔔 Built-in alerts:
You can set alerts for both bullish and bearish crossovers directly in TradingView.
🧠 MACD-inspired, but cleaner:
Instead of multiple lines and a histogram, you get one clean line moving around a fixed axis. Simple and powerful.
⚙️ Works with:
✅ TradingView (Pine Script v5)
✅ Any asset and any timeframe
📩 Want the source code? DM me and I’ll send it to you 🔧
Let me know if you'd like me to make a flyer or visual version of this too!

Momentum_EMABand📢 Reposting this script as the previous version was shut down due to house rules. Follow for future updates.
The Momentum EMA Band V1 is a precision-engineered trading indicator designed for intraday traders and scalpers. This first version integrates three powerful technical tools — EMA Bands, Supertrend, and ADX — to help identify directional breakouts while filtering out noise and choppy conditions.
How the Indicator Works – Combined Logic
This script blends distinct but complementary tools into a single, visually intuitive system:
1️⃣ EMA Price Band – Dynamic Zone Visualization
Plots upper and lower EMA bands (default: 9-period) to form a dynamic price zone.
Green Band: Price > Upper Band → Bullish strength
Red Band: Price < Lower Band → Bearish pressure
Yellow Band: Price within Band → Neutral/consolidation zone
2️⃣ Supertrend Overlay – Reliable Trend Confirmation
Based on customizable ATR length and multiplier, Supertrend adds a directional filter.
Green Line = Uptrend
Red Line = Downtrend
3️⃣ ADX-Based No-Trade Zone – Choppy Market Filter
Manually calculated ADX (default: 14) highlights weak trend conditions.
ADX below threshold (default: 20) + Price within Band → Gray background, signaling low-momentum zones.
Optional gray triangle marker flags beginning of sideways market.
Why This Mashup & How the Indicators Work Together
This mashup creates a high-conviction, rules-based breakout system:
Supertrend defines the primary trend direction — ensuring trades are aligned with momentum.
EMA Band provides structure and timing — confirming breakouts with retest logic, reducing false entries.
ADX measures trend strength — filtering out sideways markets and enhancing trade quality.
Each component plays a specific role:
✅ Supertrend = Trend bias
✅ EMA Band = Breakout + Retest validation
✅ ADX = Momentum confirmation
Together, they form a multi-layered confirmation model that reduces noise, avoids premature entries, and improves trade accuracy.
💡 Practical Application
Momentum Breakouts: Enter when price breaks out of EMA Band with Supertrend confirmation
Avoid Whipsaws: Skip trades during gray-shaded low-momentum periods
Intraday Scalping Edge: Tailored for lower timeframes (5min–15min) where noise is frequent
⚠️ Important Disclaimer
This is Version 1 — expect future enhancements based on trader feedback.
This tool is for educational purposes only. No indicator guarantees profitability. Use with proper risk management and strategy validation.

Mickey's EMAMickey’s EMA is a lightweight, overlay indicator that combines two Exponential Moving Averages (EMAs) with automatic entry, stop-loss and target visual signals—plus dynamic JSON alerts for seamless webhook integration. It’s designed for both day-traders and swing-traders who want clear, on-chart cues and fully-customizable risk parameters.
🔍 Overview
Dual EMAs (fast & slow) to capture trend changes.
Automated “BUY” / “SELL” markers at every EMA crossover.
Customizable Stop-Loss % and Target % levels, plotted as ❌ and 🎯 bubbles.
“SL Hit (Custom)” if the opposite EMA crossover occurs before price touches your stop level.
JSON-formatted alerts containing ticker, instrument type, timeframe, trend (“CE” for bullish, “PE” for bearish), and price—ready for webhooks.
⚙️ Inputs
| Setting | Default | Description |
| ------------------------ | ------- | ----------------------------------------------- |
| **Fast EMA Length** | 20 | Period for the faster EMA. |
| **Slow EMA Length** | 200 | Period for the slower EMA. |
| **Price Source** | Close | Data series to calculate EMAs on. |
| **Custom Stop Loss %** | 0.1% | Stop-loss level as a percentage of entry price. |
| **Target %** | 0.5% | Profit-target level as a percentage of entry. |
| **Show Entry/SL/Target** | ON | Toggle all entry, SL and target visuals. |
📊 What It Plots
Fast EMA (blue) & Slow EMA (white) overlayed on price.
BUY 🟢 label below bar when Fast EMA crosses above Slow EMA.
SELL 🔴 label above bar when Fast EMA crosses below Slow EMA.
❌ (Custom) bubble at entry price if an opposite EMA crossover occurs before price hits your custom stop-loss.
❌ bubble at the stop-loss price when price actually breaches the stop level.
🎯 bubble at target price when price first reaches your profit-target level.
🔔 Alerts & Webhooks
On-screen alert conditions “Mickey’s EMA → BUY” and “Mickey’s EMA → SELL” appear in the Create-Alert dialog.
Dynamic JSON payload sent via alert() when a crossover fires, e.g.:
{
"script": "AAPL",
"scriptType": "equity",
"instrumentType": "NASDAQ",
"timeframe": "5",
"trend": "CE",
"price": 174.25
}
Use these alerts to integrate with bots, chat systems, manual, or any webhook-driven workflow.
🚀 Why Use Mickey’s EMA?
Clarity & Precision: All signals appear exactly at the EMA or price-level of interest.
Custom Risk Management: Define your own stop-loss and target percentages.
Seamless Automation: Dynamic JSON alerts mean zero manual setup for webhooks.
Versatile: Equally effective on intraday charts or daily/weekly timeframes.
Add Mickey’s EMA to your TradingView chart today and get instant, aesthetically-pleasing guidance on trend entries, risk exits, and profit targets—all in one elegant overlay.
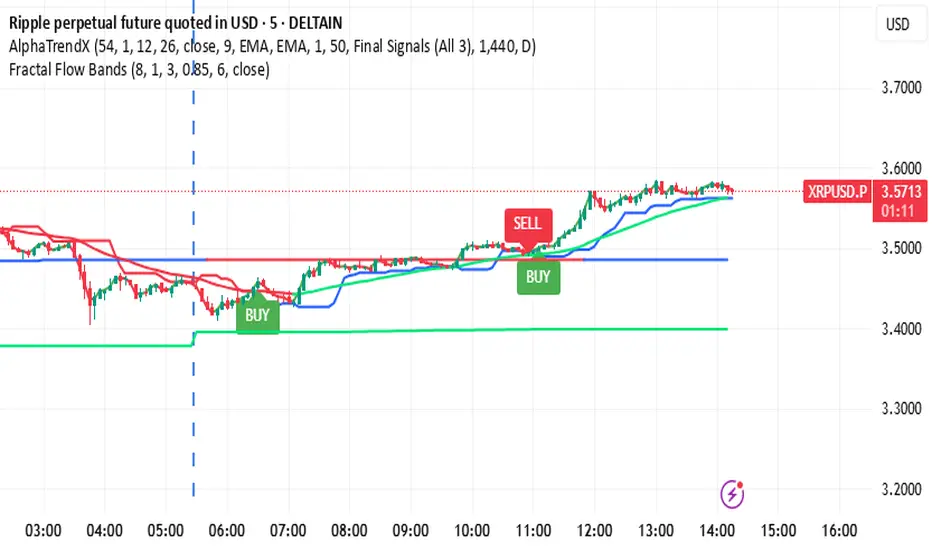
Fractal Flow BandsFractal Flow Bands
A high-precision trend-following system combining HalfTrend logic with ALMA smoothing — built for clarity, speed, and smart alerts.
🔷 What is Fractal Flow Bands?
Fractal Flow Bands merges the best of both worlds:
HalfTrend for accurate trend detection
ALMA (Arnaud Legoux Moving Average) for smooth, low-lag confirmation
This unique synergy delivers clean, non-repainting Buy/Sell signals, filtering out market noise and keeping your chart crystal clear.
🔍 How It Works
Blue HalfTrend Line + Green ALMA Crossover → BUY
Red HalfTrend Line + Red ALMA Crossover → SELL
You get only ONE alert per trend change, eliminating spammy notifications. Perfect for swing traders, scalpers, and trend followers alike.
⚙️ Core Features
✅ Dual Confirmation Engine
ALMA must confirm HalfTrend — no single-line tricks here.
✅ One Alert per Trend Shift
Clean signals, no noise, no repeats.
✅ Visual Clarity
Color-coded trends. No channels, ribbons, or clutter.
✅ Customizable Settings
Tune HalfTrend amplitude and ALMA smoothness to your strategy.
🎯 Best For
Swing traders wanting confirmation before entries
Scalpers needing fast, accurate signal flow
Anyone who hates messy charts but loves sharp decisions
🛠 Settings Explained
Setting Description
HT Amplitude Controls HalfTrend sensitivity
ALMA Length / Offset / Sigma Adjusts the smoothness of ALMA
Source Choose price source (Close, Open, etc.)
Display Toggles Enable/disable arrows and ribbons
Colors Fully customizable trend color schemes
✅ Built-in Alerts — So you never miss a signal again.
⚡ Lag-free performance — Works on multiple timeframes.
📈 Real strategy-ready code — Not just another repainting overlay.

Delorean EMAs NSYNC Bye, Bye, Bye# Delorean EMA Trend Alerts - Multi-Timeframe Edition
A Pine Script indicator for TradingView that tracks exponential moving averages (EMAs) across multiple timeframes and generates alerts only when both 1-hour and 4-hour charts agree on the trend direction. As NSYNC says, if the timeframes don't agree, your money will go "Bye, Bye, Bye!"
## Features
- Displays 5 EMAs (5, 13, 50, 200, 800 periods)
- **Multi-Timeframe Analysis**: Checks both 1H and 4H charts simultaneously
- **Trend Agreement Required**: Only signals when BOTH timeframes show the same trend
- Detects bullish trends: 50 EMA > 200 EMA > 800 EMA (on both 1H and 4H)
- Detects bearish trends: 50 EMA < 200 EMA < 800 EMA (on both 1H and 4H)
- **NSYNC Warning**: Orange warning when timeframes disagree
- Visual trend signals with up/down arrows (only when timeframes agree)
- Background coloring: Green (bullish), Red (bearish), Orange (no sync)
- **Status Table**: Shows trend status for each timeframe
- Customizable alert conditions
- Multiple alert types: Bullish, Bearish, NSYNC Warning, Alignment

Panel Pro+ Quantum SmartPromptPanel Pro+ Check 2.0
*It's a panel with integrated artificial intelligence in offline mode.
*It provides live chart prompts.
*It recognizes market types, such as bullish, bearish, box, sideways, volatile, etc.
*It performs a comprehensive evaluation and takes buy or sell actions, with the corresponding profit-taking.
[Top] LHAMA Consolidation DetectorIntroducing the Low-High Adaptive Moving Average (LHAMA 🦙), a powerful tool designed to help traders visually distinguish between trending and consolidating market phases. Unlike traditional moving averages that can produce false signals in choppy markets, the LHAMA is engineered to flatten out during periods of consolidation and become more responsive when a clear trend emerges.
This indicator's primary function is to act as a "Consolidation Detector." When the LHAMA line goes flat and adopts its "Flat Color," it serves as a clear visual cue that the market is range-bound. Conversely, when the line begins to slope and changes to its Bullish or Bearish color, it signals a potential breakout or the start of a new trend.
How It Works
The LHAMA is a type of adaptive moving average. Its adaptiveness is derived from a unique calculation that measures market "trendiness." It does this by tracking whether new highs or new lows are being made within a specified lookback period.
In a Trending Market: When the price consistently makes new highs or lows, the indicator's responsiveness increases, causing the LHAMA to track the price much more closely and responsively.
In a Consolidating Market: When the price is range-bound and fails to make new highs or lows, the responsiveness decreases significantly. This causes the LHAMA to flatten out and become less sensitive to minor price fluctuations, effectively filtering out market noise.
Key Features
Adaptive Calculation: The core engine of the indicator, which automatically adjusts its smoothing based on trend strength.
Slope-Based Coloring: The line's color dynamically changes based on its slope, providing an at-a-glance view of market conditions: bullish, bearish, or flat.
Multi-Line & Multi-Timeframe (MTF): You can enable up to six fully customizable LHAMA lines. Each line can be configured with its own length, colors, and can even be set to a different timeframe, allowing for comprehensive multi-timeframe analysis on a single chart.
Volatility Clouds: Each LHAMA can display an optional cloud around it. The cloud's width is based on your choice of either the Average True Range (ATR) or Standard Deviation (StdDev), offering a visual representation of volatility.
Volume Weighting: An option to incorporate volume into the adaptive calculation, making the LHAMA even more responsive during high-volume price movements.
How to Use
Identify Consolidation: The primary use case. A flat and consistently colored LHAMA line is a strong indication of a sideways or consolidating market. This can help traders avoid taking trend-following trades in choppy conditions.
Confirm Trends: When the LHAMA begins to slope upwards or downwards and changes to its trend color, it can be used to confirm the direction and strength of a new trend. The steeper the slope, the stronger the momentum, and more solid the directional color.
Dynamic Support & Resistance: Like other moving averages, the LHAMA can act as a dynamic level of support in an uptrend or resistance in a downtrend. The optional cloud can further define these zones.
Multi-MA Ribbon Strategy: By enabling multiple LHAMAs with different lengths (e.g., Fibonacci sequence like 14, 21, 34, 55), you can create a ribbon. The expansion of the ribbon indicates a strong trend, while its contraction signals a weakening trend or consolidation.
Settings Explained
Enable 🦙 Line: A simple checkbox to turn each of the six LHAMA lines on or off.
Length: The lookback period for the LHAMA calculation. Shorter lengths are more responsive, while longer lengths are smoother.
Timeframe: Set a specific timeframe for each LHAMA. Leave blank to use the chart's current timeframe.
Volume Weight: If checked, adds volume weighting to make the LHAMA more responsive to high-volume moves.
Colors (Bullish, Bearish, Flat): Customize the colors for each market state. To only see the line during consolidation, set the Bullish and Bearish colors to 100% transparency. To hide the line during consolidation, set the Flat color to 100% transparency.
Color Sensitivity: This is a crucial setting. Because price scales (tick sizes) vary widely between symbols, this setting allows you to adjust the sensitivity of the slope detection. A lower value requires a steeper slope to trigger a trend color, while a higher value is more sensitive.
Recommended settings are provided in the input tooltip as a starting point:
$5 Tick: 0.25 Sensitivity
$1 Tick: 0.75 Sensitivity
$0.25 Tick: 3 Sensitivity
$0.01 Tick: 50 Sensitivity
$0.005 Tick: 100 Sensitivity
Cloud Settings:
Show Cloud: Toggles the visibility of the volatility cloud around the LHAMA.
Width Based On: Choose between "ATR" or "StdDev" to calculate the cloud's width.
Cloud Length & Width: Set the lookback period and multiplier for the ATR/StdDev calculation to control the size of the cloud.
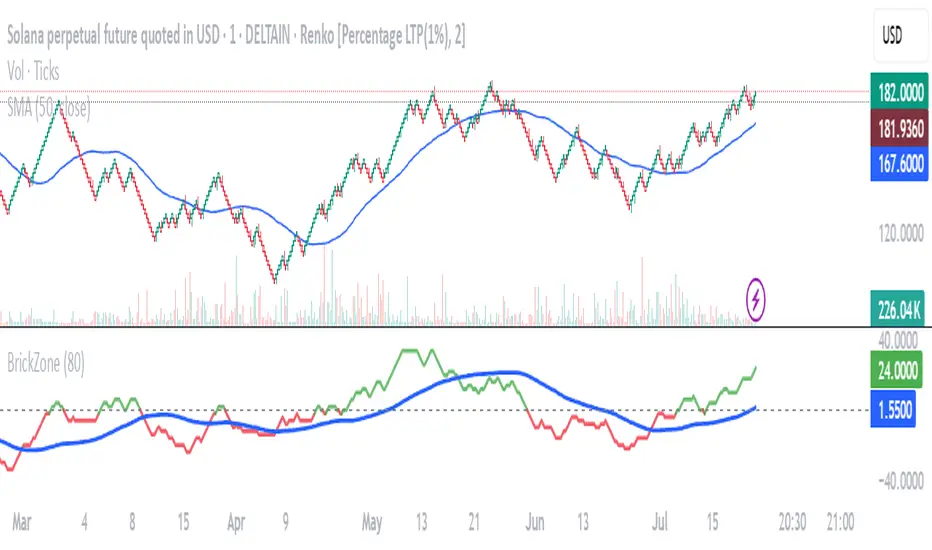
Renko Brick Zone NeelBrick indicator is a brick zone indicator, plotted not in histogram style but instead with a moving average plotted along with it.
40 period is count of same color brick difference between green and red is always 40
40-period brick indicator line and 40-period moving average line of the brick indicator.