Intraday BUY/SELL & AUTO SL (5-min timeframe only) by chaitu50c)Intraday BUY/SELL & AUTO SL (5-min timeframe only) by chaitu50c
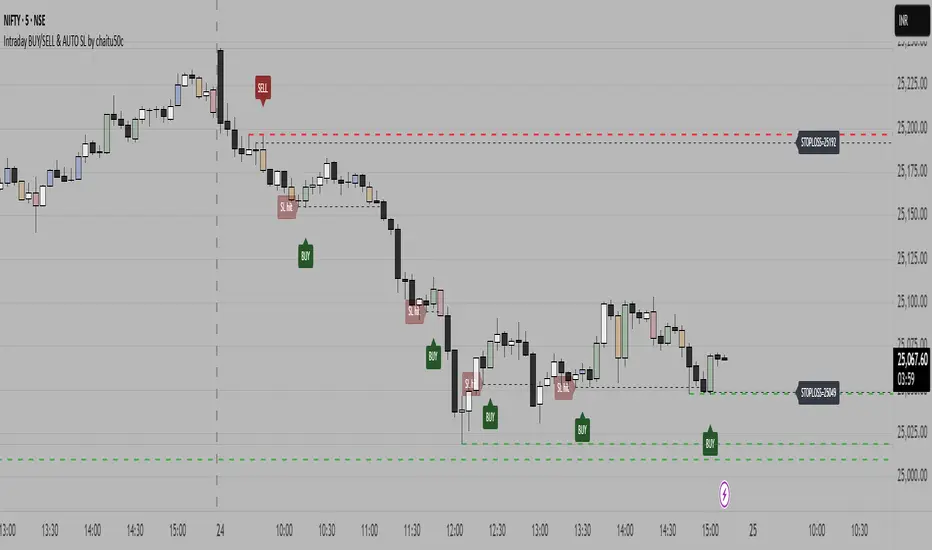
This indicator provides intraday traders with BUY/SELL reversal signals and automated SL (Stoploss) tracking, based on a 3-candle reversal block logic — designed to work exclusively on the 5-min timeframe.
Key Features:
• 3-Candle Reversal Logic — Signals are generated when a defined 3-candle reversal pattern is detected (body-close breakout).
• Current Session Only — All signals and SL lines are valid only for the current session and automatically reset at session start.
• BUY/SELL Signal Labels — Visual ▲ and ▼ labels mark valid reversal signals on the chart.
• Dynamic Auto SL Lines — Plots dashed SL lines based on the reversal block's low/high.
• SL HIT Tracking — If SL is broken, the line stops extending and a ‘SL HIT’ label is displayed at the midpoint of the SL line.
• Adjustable Visual Settings — Customize signal label size, SL line width, colors, and more.
• Clean & Lightweight — Optimized for intraday use without cluttering the chart.
How to Use:
You can trade this indicator in two ways:
1. Direct Signal Entry — Take a BUY or SELL trade when a valid ▲/▼ reversal signal forms.
2. SL HIT Re-entry — If an existing SL line is broken and ‘SL HIT’ appears, you can optionally take an opposite side trade in the direction of the SL HIT.
Example:
A BUY signal is generated and an SL line is plotted below.
If price breaks the SL (SL HIT appears), you may consider entering a SELL trade at that point — as it indicates weakness.
Important Notes:
• Works only on 5-min timeframe — Set your chart to 5-min for correct behavior.
• Designed for intraday trading — all signals and SL levels reset at session start.
• Does not carry signals between sessions.
• SL lines and HIT labels provide a clear and simple visual aid for trade management.
---
Niftylevels
Intra_Candle_Welding by Chaitu50cIntra Candle Welding by Chaitu50c
This is a professional price action–based indicator designed to automatically detect and visualize *intra-candle reversal zones* using simple yet powerful logic. It highlights price levels where two consecutive opposite candles meet with a high probability of short-term market reaction.
Concept
The indicator identifies potential intraday support and resistance levels based on the "Intra Candle Welding" concept: when the close of one candle is very close to the open of the next candle, and the two candles have opposite directions (bullish followed by bearish, or bearish followed by bullish). These levels often attract market attention due to order flow imbalance created during such transitions.
How It Works
1. The indicator continuously monitors each new candle and checks if the current open is approximately equal to the previous close, within a configurable buffer.
2. It further ensures that the two candles form an opposite pair (green→red or red→green).
3. When a valid pair is detected, the indicator checks for existing active lines near this level. If no active line exists within the defined tolerance, it draws a new horizontal line at the detected level.
4. Each line is classified as either a potential resistance (from green→red pair) or support (from red→green pair).
5. Lines automatically extend rightward and update with each bar. If price breaks through the line beyond a configurable break buffer, the line stops extending and is visually marked as "broken."
6. The indicator intelligently manages the maximum number of lines on the chart by deleting the oldest ones when the limit is exceeded.
Use Case
Traders can use this tool to identify short-term reaction zones and potential intraday turning points. The highlighted levels act as temporary support and resistance areas where price frequently reacts. It is especially useful in fast-moving or volatile markets such as index futures or liquid stocks.
Features
* Automatically detects intra-candle reversal zones.
* Classifies zones as support (bottom) or resistance (top).
* Automatically updates and breaks lines when invalidated by price action.
* Adjustable parameters for flexibility:
* Equality Buffer
* Max Lines to Keep
* Line Suppression Tolerance
* Initial Extend Bars
* Break Buffer
* Line colors, widths, and styles (active and broken states)
* Efficient memory handling with capped line count.
* Minimalist and clean visual representation, suitable for overlay on any chart.
Recommended Settings
* Works best on intraday timeframes (1 min to 15 min).
* Tune the Equality Buffer and Tolerance parameters based on instrument volatility.
* Use conservative Break Buffer to avoid premature line invalidation.
Disclaimer
This is a tool to support discretionary trading decisions. It is not a standalone buy/sell signal generator. Users are advised to combine it with their own market context and risk management framework.
This indicator is released for the TradingView community for educational and practical trading use.
---

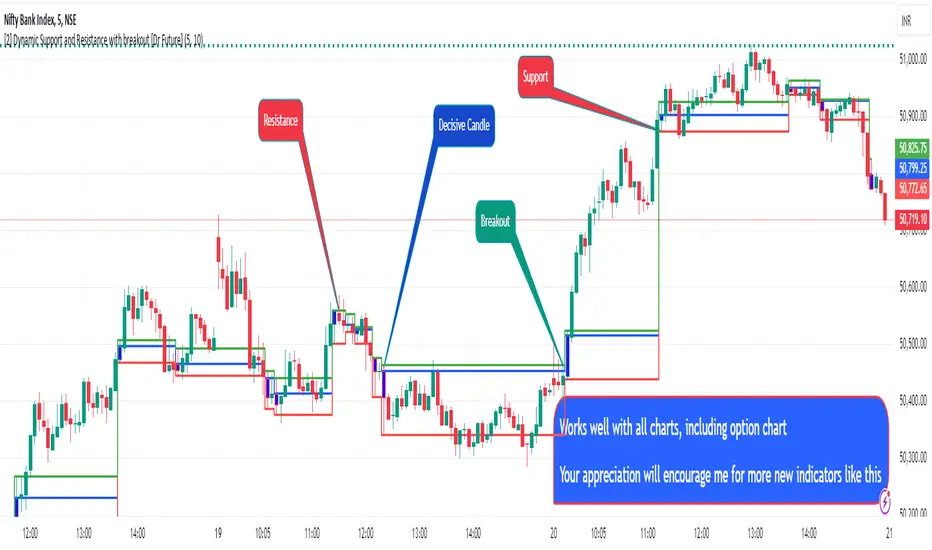
[1] Dynamic Support and Resistance with breakout [Dr Future]This script appears to be designed to identify and visualize dynamic support and resistance levels on a price chart, along with potential breakout signals.
Key Components & Functionality (Inferred):
Dynamic Support and Resistance: The script likely employs algorithms to calculate and plot support and resistance levels that adjust in real-time as price action evolves.
Breakout Detection: The script probably incorporates logic to recognize when the price breaks out of these dynamic support or resistance zones. This could trigger alerts or visual cues on the chart.
Dr Future's Approach: It's worth noting the " " tag, suggesting the script might be based on specific methodologies or insights associated with a trader or analyst known as "Dr Future." Without more context on their strategies, it's difficult to pinpoint the exact techniques used.
Potential Benefits:
Adaptive Levels: Dynamic support and resistance can offer a more responsive approach compared to static levels, as they account for changing market conditions.
Breakout Opportunities: Identifying breakouts can help traders spot potential entry or exit points.
Visual Clarity: Plotting these levels directly on the chart can provide a clearer picture of the current market structure and potential turning points.
Caveats:
False Signals: Like any technical tool, dynamic support and resistance can generate false signals. Breakouts might not always lead to sustained trends.
Parameter Sensitivity: The script's effectiveness likely depends on how its parameters are configured. Fine-tuning might be required to suit different markets or timeframes.
"Dr Future" Factor: The script's performance could be tied to the specific strategies of "Dr Future," which might not be universally applicable.
Important Note:
Without access to the actual code and a deeper understanding of "Dr Future's" methods, this description is based on inference and general knowledge of technical analysis.
Recommendation:
If you're considering using this script, it would be prudent to:
Backtest Thoroughly: Test the script on historical data to assess its performance and identify potential pitfalls.
Understand the Parameters: Familiarize yourself with the script's settings and how they impact the plotted levels and breakout signals.
Combine with Other Tools: Use this script in conjunction with other technical indicators and risk management strategies for a more holistic trading approach.