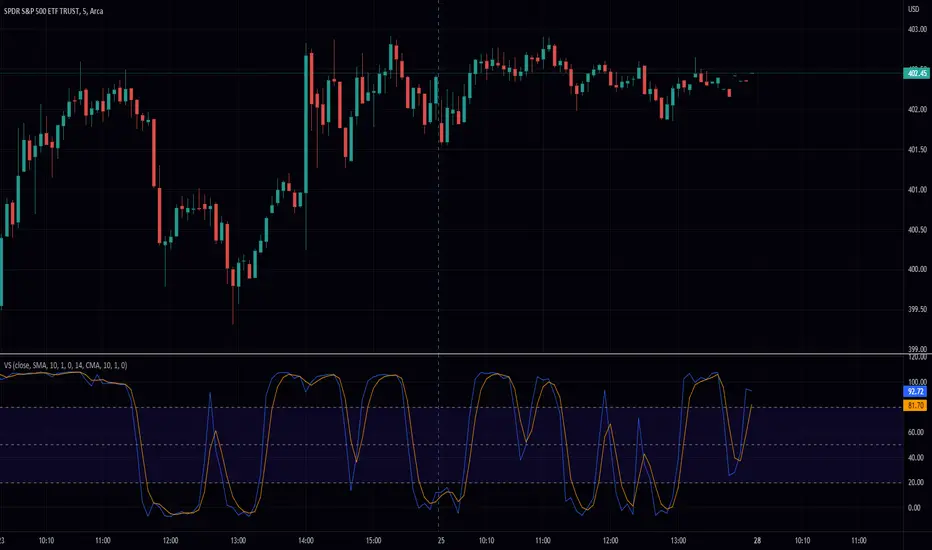
Normalized Volume & True RangeThis indicator solves a fundamental challenge that traders face when trying to analyze volume and volatility together on their charts. Traditionally, volume and price volatility exist on completely different scales, making direct comparison nearly impossible. Volume might range from thousands to millions of shares, while volatility percentages typically stay within single digits. This indicator brings both measurements onto a unified scale from 0 to 100 percent, allowing you to see their relationship clearly for the first time.
The core innovation lies in the normalization process, which automatically calculates appropriate scaling factors for both volume and volatility based on their historical statistical properties. Rather than using arbitrary fixed scales that might work for one stock but fail for another, this system adapts to each instrument's unique characteristics. The indicator establishes baseline averages for both measurements and then uses statistical analysis to determine reasonable maximum values, ensuring that extreme outliers don't distort the overall picture.
You can choose from three different volatility calculation methods depending on your analytical preferences. The "Body" option measures the distance between opening and closing prices, focusing on the actual trading range that matters most for price action. The "High/Low" method captures the full daily range including wicks and shadows, giving you a complete picture of intraday volatility. The "Close/Close" approach compares consecutive closing prices, which can be particularly useful for identifying gaps and overnight price movements.
The indicator displays volume as colored columns that match your candlestick colors, making it intuitive to see whether high volume occurred during up moves or down moves. Volatility appears as a gray histogram, providing a clean background reference that doesn't interfere with volume interpretation. Both measurements are clipped at 100 percent, which represents their calculated maximum normal values, so any readings near this level indicate unusually high activity in either volume or volatility.
The baseline reference line shows you what "normal" volume looks like for the current instrument, helping you quickly identify when trading activity is above or below average. Optional moving averages for both volume and volatility are available if you prefer smoothed trend analysis over raw daily values. The entire system updates in real-time as new data arrives, continuously refining its statistical calculations to maintain accuracy as market conditions evolve.
This two-in-one indicator provides a straightforward way to examine how price movements relate to trading volume by presenting both measurements on the same normalized scale, making it easier to spot patterns and relationships that might otherwise remain hidden when analyzing these metrics separately.
Normalize

Feature ScalingLibrary "Feature_Scaling"
FS: This library helps you scale your data to certain ranges or standarize, normalize, unit scale or min-max scale your data in your prefered way. Mostly used for normalization purposes.
minmaxscale(source, min, max, length)
minmaxscale: Min-max normalization scales your data to set minimum and maximum range
Parameters:
source
min
max
length
Returns: res: Data scaled to the set minimum and maximum range
meanscale(source, length)
meanscale: Mean normalization of your data
Parameters:
source
length
Returns: res: Mean normalization result of the source
standarize(source, length, biased)
standarize: Standarization of your data
Parameters:
source
length
biased
Returns: res: Standarized data
unitlength(source, length)
unitlength: Scales your data into overall unit length
Parameters:
source
length
Returns: res: Your data scaled to the unit length
Vector ScalerVector Scaler is like Stochastic but it uses a different method to scale the input. The method is very similar to vector normalization but instead of keeping the "vector" we just sum the three points and average them. The blue line is the signal line and the orange line is the smoothed signal line. I have added the "J" line from the KDJ indicator to help spot divergences. Differential mode uses the delta of the input for the calculations. Here are some pictures to help illustrate how this works relative to other popular indicators.
Vector Scaler vs Stochastic
Vector Scaler vs Smooth Stochastic RSI
average set to 100
average set to 200
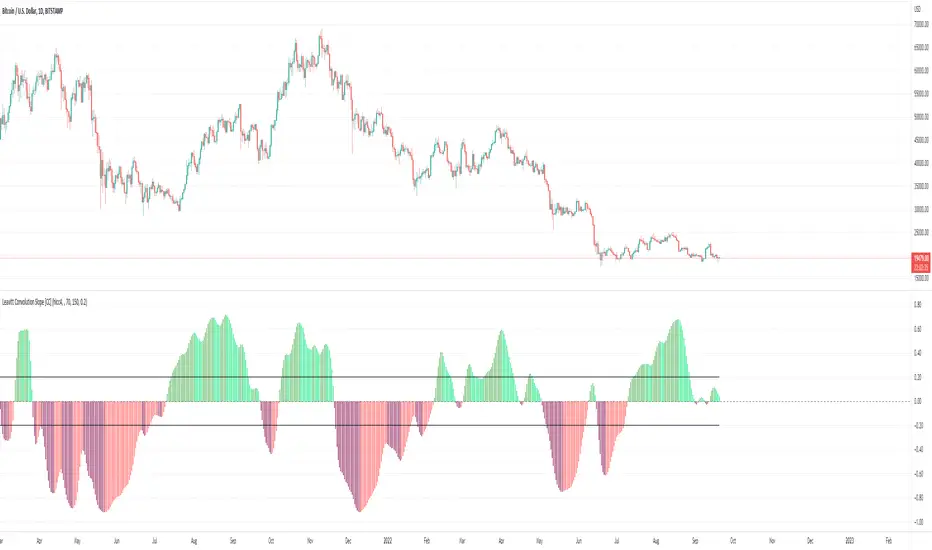
Leavitt Convolution Slope [CC]The Leavitt Convolution Slope indicator was created by Jay Leavitt (Stocks and Commodities Oct 2019, page 11), who is most well known for creating the Volume-Weighted Average Price indicator. This indicator is very similar to the Leavitt Convolution indicator but the big difference is that it is getting the slope instead of predicting the next Convolution value. I changed quite a few things from the original source code so let me know if you like these changes. I added a normalization function using code from a good friend @loxx that I recommend to leave on but feel free to experiment with it. Last but not least, the unsure levels are essentially acting as a buy or sell threshold. I personally recommend to buy or sell for zero crossovers but another option would be to buy or sell for crossovers using the unsure levels. I have color coded the lines to turn light green for a normal buy signal or dark green for a strong buy signal and light red for a normal sell signal, and dark red for a strong sell signal.
This is another indicator in a series that I'm publishing to fulfill a special request from @ashok1961 so let me know if you ever have any special requests for me.
Karobein OscillatorDeveloped by Emily Karobein, the Karobein oscillator is an oscillator that aim to rescale smoothed values with more reactivity in a range of (0,1)
Calculation
The scaling method is similar to the one used in a kalman filter for the kalman gain.
We first average the up/downs x, those calculations are similar to the ones used for calculating the average gain/loss in the relative strength index.
a = ema(src < src ? x : 0,length)
b = ema(src > src ? x : 0,length)
where src is a exponential moving average of length period and x is src/src in the standard calculations, but anything else can be used as long as x > 0 .
Then we rescale the results.
c = x/(x + b)
d = 2*(x/(x + c*a)) - 1
How To Use
It is better to use centerline-cross/breakouts/signal line.
In general when we use something smooth as input in oscillators, breakouts are better than reversals, you can see this with the stochastic and rsi.
So a simple approach could be buying when crossing over 0.8 and selling when crossing under 0.2.
Here is the balance of a strategy using those conditions, length = 50 .
20 trades have been mades since the 29 oct we made 341 pips with eur/usd, of course this backtest was made during good trends period,
this result is not representative of how the strategy work with other conditions/markets.
For any questions/suggestions feel free to contact me

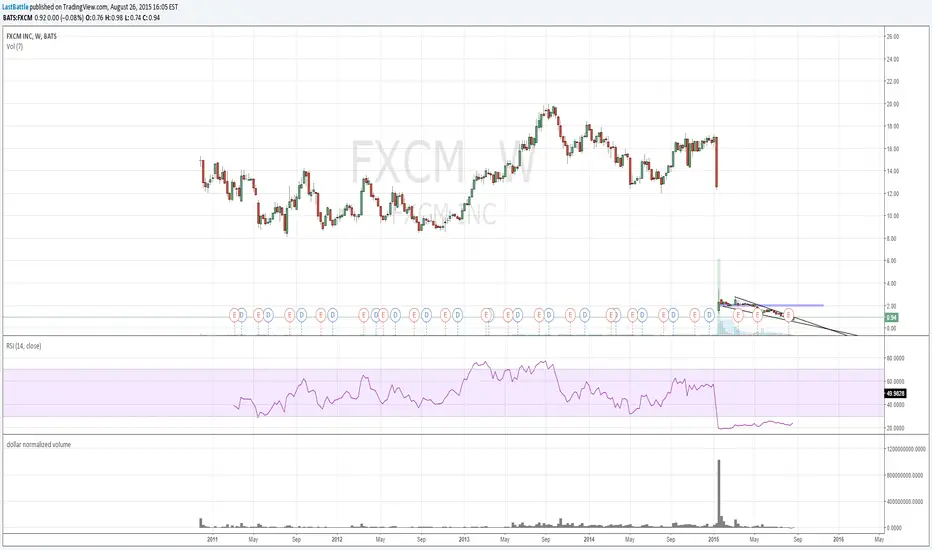
Dollar normalized volumeAn indicator that multiply the closing price with the current volume. (close X volume)
This will show the relative interest in the underlying asset regardless of the price change over time. For the case of FXCM, when the price fell from $16 to $1, its volume spiked 16x at the same time given the fact that 16x more shares can now be purchased with the same amount of dollar.
Enjoy! and remember to give a thumbs up.