Greer Value📈 Greer Value
This indicator evaluates the year-over-year (YoY) growth consistency of five key fundamental metrics for any stock:
Book Value Per Share
Free Cash Flow
Operating Margin
Total Revenue
Net Income
The script tracks whether each metric increases annually based on financial statement data (FY), then calculates both individual and aggregate increase percentages over time. A color-coded table is displayed on the most recent bar showing:
Raw counts of increases vs. checks per metric
Percentage of years with growth
Overall "Greer Value" score indicating total consistency across all five metrics
✅ Green = Strong YoY growth
❌ Red = Weak or inconsistent growth
Use this tool to help identify fundamentally improving companies with long-term value creation potential.
Operating

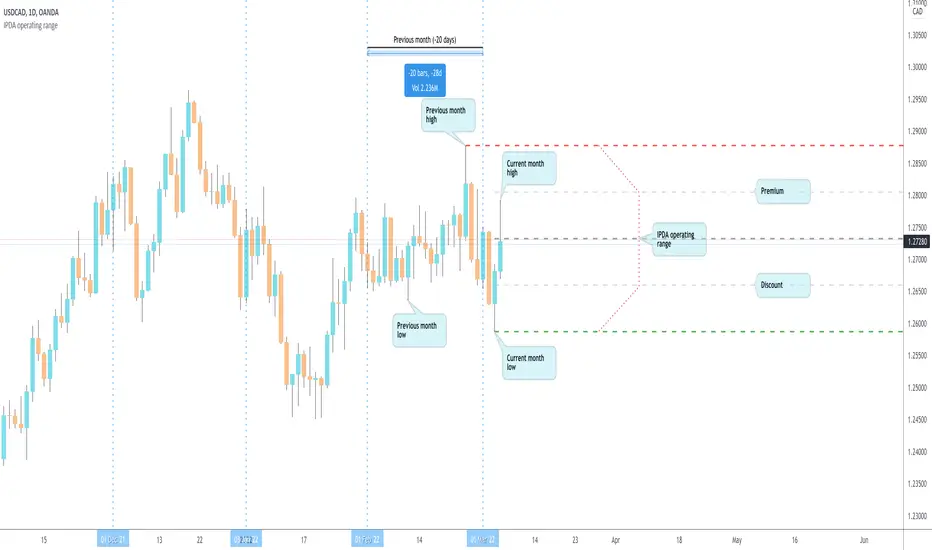
IPDA operating range by makuchakuDetermining operating range is critical for trading.
You *need* to sell in premium & buy in discount.
This script determines an operating range by stepping back on an HTF timeframe to calculate that HTF candle's range. If the current candle in HTF breaks out, the range expands accordingly.
The timeframe mapping I've used is
Intraday & <= 2H : use Daily as HTF range
Intraday & > 2H : use Weekly as HTF range
Daily : use Monthly as HTF range
Weekly : use 6 Months as HTF range
The HTF mapping is my own personal preference. If you prefer, you can easily copy the indicator and create your own mapping.
Once the HTF range is known, the indicator also plots 0%, 25%, 50% and 100% levels.