RSI with 2-Pole FilterA momentum indicator that tells you if a stock is overbought or oversold.
RSI goes between 0 and 100.
70 = overbought (might fall)
<30 = oversold (might rise)
It often looks jagged or choppy on volatile days.
Think of this filter like a momentum smoother:
It still follows RSI closely,
But it doesn’t react to every little jiggle in price,
Which helps avoid false signals.
it keeps track of:
The current RSI,
The last 2 RSI values (inputs), and
The last 2 outputs (filtered RSIs).
It uses feedback to shape the output based on previous values, making it smoother than a simple moving average.
Oscillators

TeeLek-BestPositionThis indicator is used to indicate the best buying and selling points.
This indicator will calculate the best buying points (blue) and selling points (orange). The working principle is that the blue point is the point where the RSI is Over Sold, the orange point is the point where the RSI is Over Bought. After that, we will use the Highest Line 100 and Lowest Line 100 to filter the points another layer. And because when Over Bought/Over Sold occurs, there will be continuous signals that are repeated, causing confusion. Therefore, there is a feature to leave a time frame. Set the default value to 24 hours. If a signal occurs, it will be left out.
The appropriate point for buying is:
The point where Over Sold occurs and Closes lower than the Lowest Line 100.
Leave a time frame for 24 hours before a new signal occurs.
The appropriate point for selling is:
The point where Over Bought occurs and Closes higher than the Highest Line 100.
Leave a time frame for 24 hours before a new signal occurs.
It helps us to gradually buy and collect/sell for profit easily without confusion.
อินดิเคเตอร์นี้ใช้ สำหรับบอกจุดซื้อจุดขายที่ดีที่สุด
อินดิเคเตอร์นี้ จะคำนวณจุดซื้อ (สีฟ้า) และจุดขาย (สีส้ม) ที่ดีที่สุดมาให้ โดยหลักการทำงาน คือ จุดสีฟ้า คือจุดที่ RSI Over Sold จุดสีส้ม คือจุดที่ RSI Over Bought หลังจากนั้นเราจะใช้เส้น Highest Line 100 และ Lowest Line 100 เพื่อกรองจุดอีกชั้นหนึ่ง และเนื่องจากเมื่อเกิด Over Bought/Over Sold แล้ว มันจะเกิดสัญญาณต่อเนื่องซ้ำๆ ทำให้สับสน จึงได้มีฟีเจอร์ในการเว้นระยะเวลา ตั้งค่าไว้เริ่มต้นที่ 24 ชั่วโมง ถ้าเกิดสัญญาณแล้วก็จะเว้นระยะออกไป
จุดที่เหมาะสมกับการซื้อ คือ
จุดที่เกิด Over Sold และ Close ต่ำกว่าเส้น Lowest Line 100
เว้นระยะไป 24 ชั่วโมงจึงจะเกิดสัญญาณใหม่อีกครั้ง
จุดที่เหมาะสมกับการขาย คือ
จุดที่เกิด Over Bought และ Close สูงกว่าเส้น Highest Line 100
เว้นระยะไป 24 ชั่วโมงจึงจะเกิดสัญญาณใหม่อีกครั้ง
ช่วยให้เราสามารถ ทยอยซื้อเก็บสะสม/ทยอยขายทำกำไร ได้ง่ายไม่สับสน

MACD + RSI + SMA Strategy with TP/SLThis strategy combines three technical indicators: MACD, RSI, and Simple Moving Average (SMA) to identify high-probability entry points. It enters trades in the direction of the trend (filtered by SMA), confirms momentum shifts (via MACD crossover), and validates signals with RSI to avoid overbought/oversold conditions.
Key Features:
Directional filter using SMA to align trades with the broader trend.
Momentum validation with MACD crossovers.
Risk control through RSI thresholds and fixed percentage-based Take Profit and Stop Loss levels.
Works for both long and short positions.
Disclaimer: This is a sample strategy for educational purposes only.
Trading involves risk. Use at your own discretion.
You bear full responsibility for any profit or loss.

CVDoogle (CVDoogle Indicator)This is a free simple line indicator that represents Cumulative Volume Delta. The script has been tuned specifically to most popular timeframes to be more accurate of the timeframe of the chart. This may make the line appear less smooth than other indicators, but should be more accurate to the current timeframe of the chart.
This indicator was created to be used along with the following to create a Poor Man's Exochart:
Use Volume Footprint instead of Candles on the TradingView chart
Settings:
Row Size - Auto (ATR)
ATR Length - 9
Display - Cluster
Type - Delta
Add Open Interest Suite - By Leviathan indicator
Timeframes covered by this indicator
15s
30s
1m
2m
3m
5m
6m
10m
12m
15m
24m
30m
45m
1H
2H
3H
4H
5H
6H
8H
12H
1D

TZanalyserTZanalyser (Trend Zone Monitor With Trend Strength, Volume Focus And -Events Markers)
Before I used TrendZones to manage my portfolio I used Fibonacci Zone Oscillator as my favorite in the sub panel, accompanied with another subpanel indicator which I never published called IncliValue and also REVE Cohorts.
TZanalyser inherits Ideas and code from all three of them: The visual and the idea of using a channel as the basis for an oscillator depicted as a histogram, is taken from the FibZone Oscillator. The idea of providing a number to evaluate the trend is taken from IncliValue. The idea to create a horizontal line which indicates high and low volume focus completed with markers for volume events, is taken from REVE-cohorts.
These ideas are combined in one sleek visual called TZanalyser. TZ stand for TrendZones, because the histogram is based on it.
The histogram.
Depicted is the distance of the price from COG as percent. The distance between Upper Curve and Lower Curve is used as 100%. The values may reach between 300 and -300. The colors indicate in which zone the candle lives, blue in the blue zone, green in the green zone etc. Despite the absence of a gray zone, there are gray bars. These depict candles that wrap around COG. Because hl2 is used as price, some gray bars point up and others down. The orange and red bars point down because the orange and red downtrend zones are below COG.
Use of the histogram.
Sometimes I need to create a list of stocks which are in uptrend in monthly, weekly and daily charts from the stocks I follow in my universe. This job is done fast and easy by looking at the last bar of the histogram. The histogram also gives a quick evaluation of how the stock fared in the past.
The number.
Suppose I need to allocate some money to another stock, selected a few, looked into news and gurus and they look equally good. Then it is nice to be able to find out which has the best charts. Which one has the strongest uptrend. For this purpose this number can be consulted, because it indicates somehow the strength of the trend. It is an integer between 20 and -20, the closer to 20 the stronger the uptrend, closer to -20 indicates a stronger downtrend. The color of the background is the same as the last column of the histogram.
Volume focus and events
The horizontal lines depict volume focus, the line below the focus that comes with the uptrend columns pointing up, the one above the focus for the downtrend columns pointing down. Thes line have tree colors: maroon for high volume focus, green for normal volume and gray for low volume situations. Between the lines and the histogram triangles appear at volume events, a green triangle when the candle comes with high volume, i.e. 120-200 percent of normal, maroon when extreme volume, i.e. more than 200 percent of normal.
The direction of these triangles is that of the histogram, i.e. when the price is higher, direction is up and vice versa.
Take care and have fun.

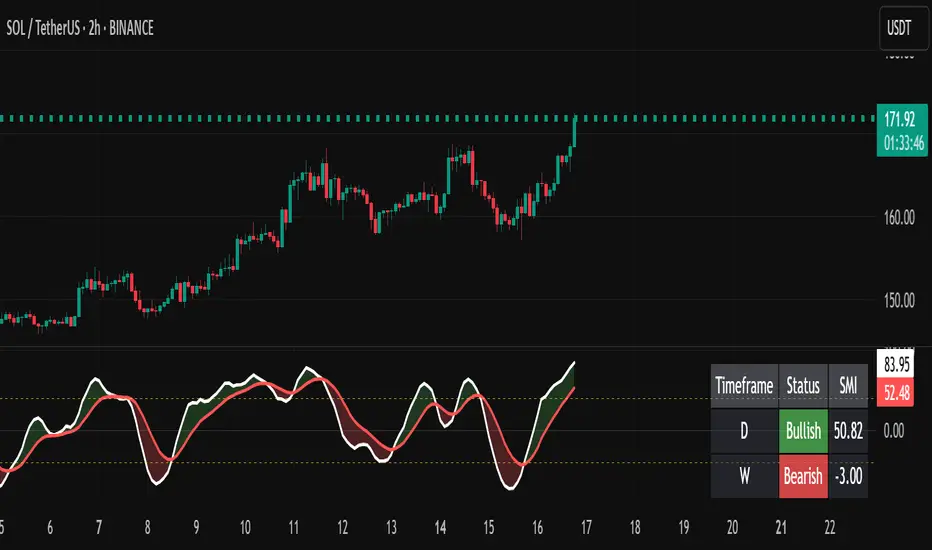
SMI Panel (kolupaiev)Stochastic Momentum + table trand + alerts
The indicator is composed of STOCHASTIC and MOMENTUM.
A table for tracking the trend on higher timeframes (1D and 1W) has also been added.
Notifications can be configured to follow the trend.
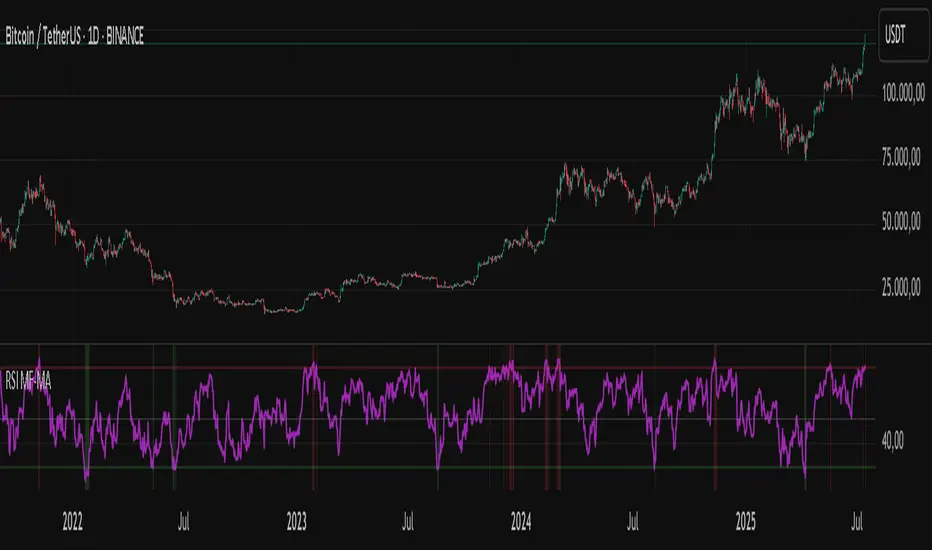
RSI Mansfield +RSI Mansfield+ – Adaptive Relative Strength Indicator with Divergences
Overview
RSI Mansfield+ is an advanced relative strength indicator that compares your instrument’s performance against a configurable benchmark index or asset (e.g., Bitcoin Dominance, S&P 500). It combines Mansfield normalization, adaptive smoothing techniques, and automatic detection of bullish and bearish divergences (regular and hidden), delivering a comprehensive tool for assessing relative strength across any market and timeframe.
Originality and Motivation
Unlike traditional relative strength scripts, this indicator introduces several distinctive improvements:
Mansfield Normalization: Scales the ratio between the asset and the benchmark relative to its moving average, transforming it into a normalized oscillator that fluctuates around zero, making it easier to spot outperformance or underperformance.
Adaptive Smoothing: Automatically selects whether to use EMA or SMA based on the market type (crypto or stocks) and timeframe (intraday, daily, weekly, monthly), avoiding manual configuration and providing more robust results under varying volatility conditions.
Divergence Detection: Identifies four types of divergences in the Mansfield oscillator to help anticipate potential reversal points or trend confirmations.
Multi-Market Support: Offers benchmark selection among major crypto and global stock indices from a single input.
These enhancements make RSI Mansfield+ more practical and powerful than conventional relative strength scripts with static benchmarks or without divergence capabilities.
Core Concepts
Relative Strength (RS): Compares price evolution between your asset and the selected benchmark.
Mansfield Normalization: Measures how much the RS deviates from its historical moving average, expressed as a scaled oscillator.
Divergences: Detects regular and hidden bullish or bearish divergences within the Mansfield oscillator.
Timeframe Adaptation: Dynamically adjusts moving average lengths based on timeframe and market type.
How It Works
Benchmark Selection
Choose among over 10 indices or market domains (BTC Dominance, ETH Dominance, S&P 500, European indices, etc.).
Ratio Calculation
Computes the price-to-benchmark ratio and smooths it with the adaptive moving average.
Normalization and Scaling
Transforms deviations into a Mansfield oscillator centered around zero.
Dynamic Coloring
Green indicates relative outperformance, red signals underperformance.
Divergence Detection
Automatically identifies bullish and bearish (regular and hidden) divergences by comparing oscillator pivots against price pivots.
Baseline Reference
A clear zero line helps interpret relative strength trends.
Usage Guidelines
Benchmark Comparison
Ideal for traders analyzing whether an asset is outperforming or lagging its sector or market.
Divergence Analysis
Helps detect potential reversal or continuation signals in relative strength.
Multi-Timeframe Compatibility
Can be applied to intraday, daily, weekly, or monthly charts.
Interpretation
Oscillator >0 and green: outperforming the benchmark.
Oscillator <0 and red: underperforming.
Bullish divergences: potential relative strength reversal to the upside.
Bearish divergences: possible loss of momentum or reversal to the downside.
Credits
The concept of Mansfield Relative Strength is based on Stan Weinstein’s original work on relative performance analysis. This script was built entirely from scratch in TradingView Pine Script v6, incorporating original logic for adaptive smoothing, normalized scaling, and divergence detection, without reusing any external open-source code.

WaveTrend w/ Crosses & MTFWaveTrend Oscillator from LazeBear, modified to plot crosses and amplified delta.

Fisher Transform w/ Cross in MTFFisher Transform from Tradingview Technical indicators, modified to hard code settings for various time frames and to plot crosses.

QQE + Signals RNEdited this to do away with larged signals of long and short to small triangles labeld only with QQE text

RSI Multi-Frame Multi-Asset
✅ Key Features:
Multi-Asset: Simultaneously analyze Bitcoin, SP500, Nasdaq, DXY, Gold, Oil, VIX and more
Multi-Timeframe: Configure any timeframe for all RSI calculations
Smart Average RSI: Automatically calculates the mean of all active RSI values
Special Data: Includes Bitcoin Hashrate, 10Y-2Y Spread, and US Interest Rates
Built-in Alerts: Automatic notifications on overbought/oversold crossovers
🎯 Why is it Unique?
Instead of looking at 10 different charts, you get an instant macro view of the market. The average RSI shows you the overall strength/weakness of global markets, while individual RSI values let you identify divergences and specific opportunities.
🚀 Perfect For:
Traders seeking correlations between assets
Global markets macro analysis
Identifying divergences between Bitcoin and traditional markets
Multi-timeframe breakout trading
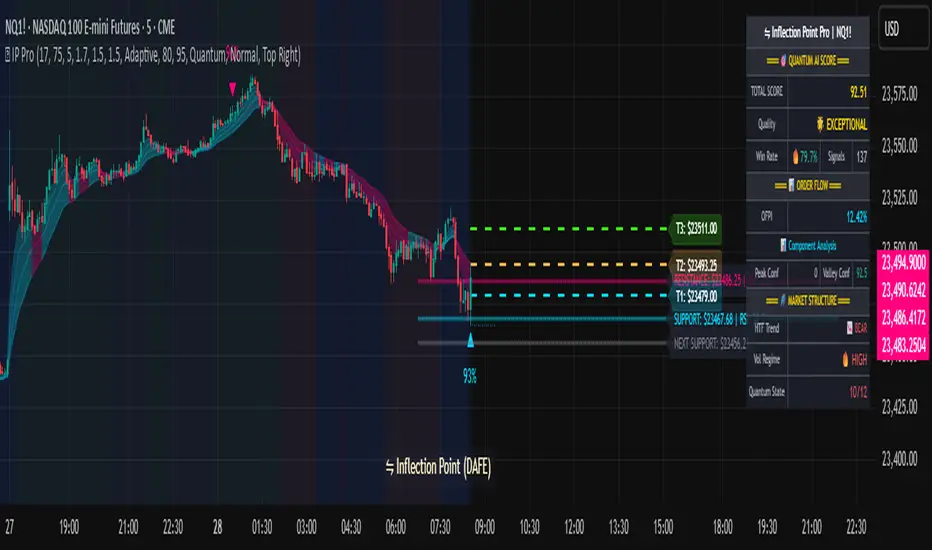
Inflection PointInflection Point - The Adaptive Confluence Reversal Engine
This is not just another peak and valley indicator; it is a complete and total reimagining of how market turning points are detected, qualified, and acted upon. Born from the foundational concepts explored in systems like my earlier creation, DAFE - Turning Point, Inflection Point is a ground-up engineering feat designed for the modern trader. It moves beyond static rules and simple pattern recognition into the realm of dynamic, multi-factor confluence analysis and adaptive machine learning.
Where other indicators provide a guess, Inflection Point provides a probability. It meticulously analyzes the market's deepest currents—momentum, exhaustion, and reversal velocity—and fuses them into a single, unified "Confluence Score." This is not a simple combination of indicators; it is an intelligent, weighted system where each component works in concert, creating an analytical engine that is orders of magnitude more sophisticated and reliable than any standard reversal tool.
Furthermore, Inflection Point learns. Through its advanced Adaptive Learning Engine, it constantly monitors its own performance, adjusting its confidence and selectivity in real-time based on its recent success rate. This allows it to adapt its behavior to any security, on any timeframe, with remarkable success.
Theoretical Foundation - Confluence Core
Inflection Point's predictive power does not come from a single, magical formula. It comes from the intelligent synthesis of three critical market phenomena, weighted and scored in real-time to generate a single, high-conviction probability rating.
1. Factor One: Pre-Reversal Momentum State (RSI Analysis)
Instead of reacting to a simple RSI cross, Inflection Point proactively scans for the build-up of momentum that precedes a reversal.
• Formulaic Concept: It measures the highest RSI value over a lookback period for peaks and the lowest RSI for valleys. A signal is only considered valid if significant momentum has been established before the turn, indicating a stretched market condition ripe for reversal.
• Asymmetric Sophistication: The engine uses different, optimized thresholds for bull and bear momentum, recognizing that markets often fall faster than they rise.
2. Factor Two: Volatility Exhaustion (Bollinger Band Analysis)
A true reversal often occurs when price makes a final, exhaustive push into unsustainable territory.
• Formulaic Concept: The engine detects when price has significantly pierced the outer Bollinger Bands. This is not just a touch, but a statistical deviation from the mean that signals volatility exhaustion, where the energy for the current move is likely depleted.
3. Factor Three: Reversal Strength (Rate of Change Analysis)
The character of a reversal matters. A sharp, decisive turn is more significant than a slow, meandering one.
• Formulaic Concept: Using a short-term Rate of Change (ROC), the engine measures the velocity of the reversal itself. A higher ROC score adds significant weight to the final probability, confirming that the new direction has conviction.
4. The Final Calculation: The Adaptive Learning Engine
This is the system's "brain." It maintains a history of its past signals and calculates its real-time win rate. This hitRate is then used to generate an adaptiveMultiplier.
• Self-Correction: In "Quality Control" mode, a high win rate makes the indicator more selective, demanding a higher probability score to issue a signal, thereby protecting streaks. A lower win rate makes it slightly less selective to ensure it continues learning from new market conditions.
• The result is a system that is not static, but a living, breathing tool that adapts its personality to the unique rhythm of any chart.
Why Inflection Point is a Paradigm Shift
Inflection Point is fundamentally different from other reversal indicators for three key reasons:
Confluence Over Isolation: Standard indicators look at one thing (e.g., RSI > 70). Inflection Point simultaneously analyzes momentum, volatility, and velocity, understanding that true reversals are a product of multiple converging factors. It answers not just "if," but "why" a reversal is likely.
Probabilistic Over Binary: Other tools give you a simple "yes" or "no." Inflection Point provides a probability score from 0-100, allowing you to gauge the conviction of every potential signal. This empowers you to differentiate between a weak setup and an A+ opportunity.
Adaptive Over Static: Every other indicator uses the same rules forever. Inflection Point's Adaptive Engine means it is constantly refining its own logic based on what is actually working in the current market, on the specific asset you are trading. It is tailored to the now.
The Inputs Menu - Your Command Center
Every setting is a lever of control, allowing you to tune the engine to your precise trading style and market focus.
🧠 Neural Core Engine
Analysis Depth: This is the primary lookback for the Bollinger Band and other core calculations. A shorter depth makes the indicator faster and more sensitive, ideal for scalping. A longer depth makes it slower and more stable, ideal for swing trading.
Minimum Probability %: This is your master signal filter. It sets the minimum Confluence Score required to plot a signal. Higher values (85-95) will give you only the highest-conviction A+ setups. Lower values (70-80) will show more potential opportunities.
🤖 Adaptive Neural Learning
Enable Adaptive Learning Engine: Toggles the entire learning system. Disabling it will make the indicator's logic static.
Peak/Valley Success Threshold (ATR): This defines what constitutes a "successful" trade for the learning engine. A value of 1.5 means price must move 1.5x the ATR in your favor for the signal to be marked as a win. Adjust this to match your personal take-profit strategy.
Adaptive Mode: This dictates how the engine uses its hitRate. "Quality Control" is recommended for its intelligent filtering. "Aggressive" will always boost signal scores, useful for finding more setups in a known, trending environment.
Asymmetric Balance: Allows you to apply a "boost" to either peak (short) or valley (long) signals. If you find the market you're trading has stronger long reversals, you can increase the "Valley Signal Boost" to catch them more effectively.
🛡️ Elite Filters
Market Noise Filter: An exceptional tool for avoiding choppy markets. It counts the number of directional changes in the last 5 bars. If the market is whipping back and forth too much, it will block the signal. Lower the "Max Direction Changes" to be extremely selective.
Volume Filter: Requires signal confirmation from a significant volume spike. The "Volume Multiplier" dictates how large this spike must be (e.g., 1.2 = 20% above average volume). This is invaluable for filtering out low-conviction moves in stocks and crypto.
The Dashboard - Your Analytical Co-Pilot
The dashboard is not just a set of numbers; it is a holistic overview of the market's health and the engine's current state.
Unified AI Score: This section provides the most critical, at-a-glance information. "Total Score" is the current probability reading, while "Quality" gives you a human-readable interpretation. "Win Rate" shows the real-time performance of the Adaptive Engine.
Order Flow (OFPI): This measures the "weight" of money behind recent price moves by analyzing price change relative to volume. A high positive OFPI suggests strong buying pressure, while a high negative value suggests strong selling pressure. It gives you a peek into the market's underlying flow.
Component Analysis: This allows you to see the individual "Peak" and "Valley" confidence scores before they are filtered, giving you insight into building momentum before a signal forms.
Market Structure: This panel assesses the broader environment. "HTF Trend" tells you the direction of the larger trend (based on EMAs), while "Vol Regime" tells you if the market is in a high, medium, or low volatility state. Use this to align your signals with the broader market context.
Filter & Engine Statistics: Available on the "Large" dashboard, this provides deep insight into how many signals are being blocked by your filters and the current status of the Adaptive Engine's multiplier.
The Visual Interface - A Symphony of Data
Every visual element on the chart is designed for instant interpretation and insight.
Signal Markers: Simple, clean triangles mark the exact bar of a valid signal. A box is drawn around the high/low of the signal bar to highlight the precise point of inflection.
Dynamic Support/Resistance Zones: These are the glowing lines on your chart. They are not static lines; they are dynamic levels that represent the current battlefield between buyers and sellers.
Cyber Cyan (Valley Blue): This is the current Support Zone. This is the price level the market is currently trying to defend.
Neural Pink (Peak Red): This is the current Resistance Zone. This is the price level the market is currently trying to break through.
Grey (Next Level): This line is a projection, based on the current momentum and the size of the S/R range, of where the next major level of conflict will likely be. It acts as a potential price target.
Development & Philosophy
Inflection Point was not assembled; it was engineered. It represents hundreds of hours of research into market dynamics, statistical analysis, and machine learning principles. The goal was to create a tool that moves beyond the limitations of traditional technical analysis, which often fails in modern, algorithm-driven markets. By building a system based on multi-factor confluence and self-adaptive logic, Inflection Point provides a quantifiable, statistical edge that is simply unattainable with simpler tools. This is the result of a relentless pursuit of a better, more intelligent way to trade.
Universal Applicability
The principles of momentum, exhaustion, and velocity are universal to all freely traded markets. Because of its adaptive core and robust filtering options, Inflection Point has proven to be exceptionally effective on any security (stocks, crypto, forex, indices, futures) and on any timeframe (from 1-minute scalping charts to daily swing trading charts).
" Markets are constantly in a state of uncertainty and flux and money is made by discounting the obvious and betting on the unexpected. "
— George Soros
Trade with insight. Trade with anticipation.
— Dskyz, for DAFE Trading Systems
Divergence Strategy [Trendoscope®]🎲 Overview
The Divergence Strategy is a sophisticated TradingView strategy that enhances the Divergence Screener by adding automated trade signal generation, risk management, and trade visualization. It leverages the screener’s robust divergence detection to identify bullish, bearish, regular, and hidden divergences, then executes trades with precise entry, stop-loss, and take-profit levels. Designed for traders seeking automated trading solutions, this strategy offers customizable trade parameters and visual feedback to optimize performance across various markets and timeframes.
For core divergence detection features, including oscillator options, trend detection methods, zigzag pivot analysis, and visualization, refer to the Divergence Screener documentation. This description focuses on the strategy-specific enhancements for automated trading and risk management.
🎲 Strategy Features
🎯Automated Trade Signal Generation
Trade Direction Control : Restrict trades to long-only or short-only to align with market bias or strategy goals, preventing conflicting orders.
Divergence Type Selection : Choose to trade regular divergences (bullish/bearish), hidden divergences, or both, targeting reversals or trend continuations.
Entry Type Options :
Cautious : Enters conservatively at pivot points and exits quickly to minimize risk exposure.
Confident : Enters aggressively at the latest price and holds longer to capture larger moves.
Mixed : Combines conservative entries with delayed exits for a balanced approach.
Market vs. Stop Orders: Opt for market orders for instant execution or stop orders for precise price entry.
🎯 Enhanced Risk Management
Risk/Reward Ratio : Define a risk-reward ratio (default: 2.0) to set profit targets relative to stop-loss levels, ensuring consistent trade sizing.
Bracket Orders : Trades include entry, stop-loss, and take-profit levels calculated from divergence pivot points, tailored to the entry type and risk-reward settings.
Stop-Loss Placement : Stops are strategically set (e.g., at recent pivot or last price point) based on entry type, balancing risk and trade validity.
Order Cancellation : Optionally cancel pending orders when a divergence is broken (e.g., price moves past the pivot in the wrong direction), reducing invalid trades. This feature is toggleable for flexibility.
🎯 Trade Visualization
Target and Stop Boxes : Displays take-profit (lime) and stop-loss (orange) levels as boxes on the price chart, extending 10 bars forward for clear visibility.
Dynamic Trade Updates : Trade visualizations are added, updated, or removed as trades are executed, canceled, or invalidated, ensuring accurate feedback.
Overlay Integration : Trade levels overlay the price chart, complementing the screener’s oscillator-based divergence lines and labels.
🎯 Strategy Default Configuration
Capital and Sizing : Set initial capital (default: $1,000,000) and position size (default: 20% of equity) for realistic backtesting.
Pyramiding : Allows up to 4 concurrent trades, enabling multiple divergence-based entries in trending markets.
Commission and Margin : Accounts for commission (default: 0.01%) and margin (100% for long/short) to reflect trading costs.
Performance Optimization : Processes up to 5,000 bars dynamically, balancing historical analysis and real-time execution.
🎲 Inputs and Configuration
🎯Trade Settings
Direction : Select Long or Short (default: Long).
Divergence : Trade Regular, Hidden, or Both divergence types (default: Both).
Entry/Exit Type : Choose Cautious, Confident, or Mixed (default: Cautious).
Risk/Reward : Set the risk-reward ratio for profit targets (default: 2.0).
Use Market Order : Enable market orders for immediate entry (default: false, uses limit orders).
Cancel On Break : Cancel pending orders when divergence is broken (default: true).
🎯Inherited Settings
The strategy inherits all inputs from the Divergence Screener, including:
Oscillator Settings : Oscillator type (e.g., RSI, CCI), length, and external oscillator option.
Trend Settings : Trend detection method (Zigzag, MA Difference, External), MA type, and length.
Zigzag Settings : Zigzag length (fixed repaint = true).
🎲 Entry/Exit Types for Divergence Scenarios
The Divergence Strategy offers three Entry/Exit Type options—Cautious, Confident, and Mixed—which determine how trades are entered and exited based on divergence pivot points. This section explains how these settings apply to different divergence scenarios, with placeholders for screenshots to illustrate each case.
The divergence pattern forms after 3 pivots. The stop and entry levels are formed on one of these levels based on Entry/Exit types.
🎯Bullish Divergence (Reversal)
A bullish divergence occurs when price forms a lower low, but the oscillator forms a higher low, signaling a potential upward reversal.
💎 Cautious:
Entry : At the pivot high point for a conservative entry.
Exit : Stop-loss at the last pivot point (previous low that is higher than the current pivot low); take-profit at risk-reward ratio. Canceled if price breaks below the pivot (if Cancel On Break is enabled).
Behavior : Enters after confirmation and exits quickly to limit downside risk.
💎Confident:
Entry : At the last pivot low, (previous low which is higher than the current pivot low) for an aggressive entry.
Exit : Stop-loss at recent pivot low, which is the lowest point; take-profit at risk-reward ratio. Canceled if price breaks below the pivot. (lazy exit)
Behavior : Enters early to capture trend continuation, holding longer for gains.
💎Mixed:
Entry : At the pivot high point (conservative).
Exit : Stop-loss at the recent pivot point that has resulted in lower low (lazy exit). Canceled if price breaks below the pivot.
Behavior : Balances entry caution with extended holding for trend continuation.
🎯Bearish Divergence (Reversal)
A bearish divergence occurs when price forms a higher high, but the oscillator forms a lower high, indicating a potential downward reversal.
💎Cautious:
Entry : At the pivot low point (lower high) for a conservative short entry.
Exit : Stop-loss at the previous pivot high point (previous high); take-profit at risk-reward ratio. Canceled if price breaks above the pivot (if Cancel On Break is enabled).
Behavior : Enters conservatively and exits quickly to minimize risk.
💎Confident:
Entry : At the last price point (previous high) for an aggressive short entry.
Exit : Stop-loss at the pivot point; take-profit at risk-reward ratio. Canceled if price breaks above the pivot.
Behavior : Enters early to maximize trend continuation, holding longer.
💎Mixed:
Entry : At the previous piot high point (conservative).
Exit : Stop-loss at the last price point (delayed exit). Canceled if price breaks above the pivot.
Behavior : Combines conservative entry with extended holding for downtrend gains.
🎯Bullish Hidden Divergence (Continuation)
A bullish hidden divergence occurs when price forms a higher low, but the oscillator forms a lower low, suggesting uptrend continuation. In case of Hidden bullish divergence, b]Entry is always on the previous pivot high (unless it is a market order)
💎Cautious:
Exit : Stop-loss at the recent pivot low point (higher than previous pivot low); take-profit at risk-reward ratio. Canceled if price breaks below the pivot (if Cancel On Break is enabled).
Behavior : Enters after confirmation and exits quickly to limit downside risk.
💎Confident:
Exit : Stop-loss at previous pivot low, which is the lowest point; take-profit at risk-reward ratio. Canceled if price breaks below the pivot. (lazy exit)
Behavior : Enters early to capture trend continuation, holding longer for gains.
🎯Bearish Hidden Divergence (Continuation)
A bearish hidden divergence occurs when price forms a lower high, but the oscillator forms a higher high, suggesting downtrend continuation. In case of Hidden Bearish divergence, b]Entry is always on the previous pivot low (unless it is a market order)
💎Cautious:
Exit : Stop-loss at the latest pivot high point (which is a lower high); take-profit at risk-reward ratio. Canceled if price breaks above the pivot (if Cancel On Break is enabled).
Behavior : Enters conservatively and exits quickly to minimize risk.
💎Confident/Mixed:
Exit : Stop-loss at the previous pivot high point; take-profit at risk-reward ratio. Canceled if price breaks above the pivot.
Behavior : Uses the late exit point to hold longer.
🎲 Usage Instructions
🎯Add to Chart:
Add the Divergence Strategy to your TradingView chart.
The oscillator and divergence signals appear in a separate pane, with trade levels (target/stop boxes) overlaid on the price chart.
🎯Configure Settings:
Adjust trade settings (direction, divergence type, entry type, risk-reward, market orders, cancel on break).
Modify inherited Divergence Screener settings (oscillator, trend method, zigzag length) as needed.
Enable/disable alerts for divergence notifications.
🎯Interpret Signals:
Long Trades: Triggered on bullish or bullish hidden divergences (if allowed), shown with green/lime lines and labels.
Short Trades: Triggered on bearish or bearish hidden divergences (if allowed), shown with red/orange lines and labels.
Monitor lime (target) and orange (stop) boxes for trade levels.
Review strategy performance metrics (e.g., profit/loss, win rate) in the strategy tester.
🎯Backtest and Optimize:
Use TradingView’s strategy tester to evaluate performance on historical data.
Fine-tune risk-reward, entry type, position sizing, and cancellation settings to suit your market and timeframe.
For questions, suggestions, or support, contact Trendoscope via TradingView or official support channels. Stay tuned for updates and enhancements to the Divergence Strategy!

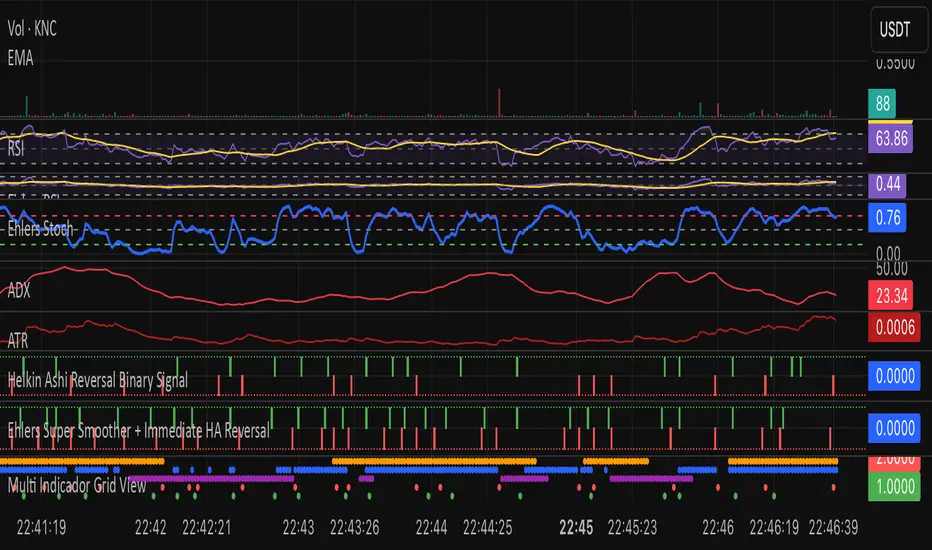
Ehlers Two-Pole StochasticThis indicator implements John Ehlers' Two-Pole Stochastic Filter, a smoother alternative to the traditional stochastic oscillator. Instead of relying on raw %K values, it applies a second-order IIR filter (recursive smoothing) to reduce noise and improve trend clarity.
It outputs a single line oscillating between 0 and 1, with less lag and false signals compared to standard stochastic implementations.
Key Features:
Uses a two-pole filter to smooth the normalized stochastic (%K).
Ideal for detecting clean reversals and trend continuations.
Designed for minimal visual noise and greater signal confidence.
Interpretation:
Values near 1.0 may suggest overbought conditions.
Values near 0.0 may suggest oversold conditions.
Crosses above 0.5 can signal bullish shifts, and below 0.5 bearish shifts.
Recommended Settings:
Default smoothing factor (alpha) is 0.7 — higher values make the output more responsive, while lower values smooth further.
Inspired by concepts from Cybernetic Analysis for Stocks and Futures by John F. Ehlers.
Crowding model ║ BullVision🔬 Overview
The Crypto Crowding Model Pro is a sophisticated analytical tool designed to visualize and quantify market conditions across multiple cryptocurrencies. By leveraging Relative Strength Index (RSI) and Z-score calculations, this indicator provides traders with an intuitive and detailed snapshot of current crypto market dynamics, highlighting areas of extreme momentum, crowded trades, and potential reversal points.
⚙️ Key Concepts
📊 RSI and Z-Score Analysis
RSI (Relative Strength Index) evaluates the momentum and strength of each cryptocurrency, identifying overbought or oversold conditions.
Z-Score Normalization measures each asset's current price deviation relative to its historical average, identifying statistically significant extremes.
🎯 Crowding Analytics
An integrated analytics panel provides real-time crowding metrics, quantifying market sentiment into four distinct categories:
🔥 FOMO (Fear of Missing Out): High momentum, potential exhaustion.
❄️ Fear: Low momentum, potential reversal or consolidation.
📈 Recovery: Moderate upward momentum after a downward trend.
💪 Strength: Stable bullish conditions with sustained momentum.
🖥️ Visual Scatter Plot
Assets are plotted on a dynamic scatter plot, positioning each cryptocurrency according to its RSI and Z-score.
Color coding, symbol shapes, and sizes help quickly identify main market segments (BTC, ETH, TOTAL, OTHERS) and individual asset conditions.
🧩 Quadrant Classification
Assets are categorized into four quadrants based on their momentum and deviation:
Overbought Extended: High RSI and positive Z-score.
Recovery Phase: Low RSI but positive Z-score.
Oversold Compressed: Low RSI and negative Z-score.
Strong Consolidation: High RSI but negative Z-score.
🔧 User Customization
🎨 Visual Settings
Bar Scale: Adjust the scatter plot visual scale.
Asset Visibility: Optionally display key market benchmarks (TOTAL, BTC, ETH, OTHERS).
Gradient Background: Enhances visual interpretation of asset clusters.
Crowding Analytics Panel: Toggle the analytics panel on/off.
📊 Indicator Parameters
RSI Length: Defines the calculation period for RSI.
Z-score Lookback: Historical lookback period for normalization.
Crowding Alert Threshold: Sets alert sensitivity for crowded market conditions.
🎯 Zone Settings
Quadrant Labels: Displays descriptive labels for each quadrant.
Danger Zones: Highlights extreme RSI levels indicative of heightened market risk.
📈 Visual Output
Dynamic Scatter Plot: Visualizes asset positioning clearly and intuitively.
Gradient and Grid: Professional gridlines and subtle gradient backgrounds assist visual assessment.
Danger Zone Highlights: Visually indicates RSI extremes to warn of potential market turning points.
Crowding Analytics Panel: Real-time summary of market sentiment and asset distribution.
🔍 Use Cases
This indicator is particularly beneficial for traders and analysts looking to:
Identify crowded trades and potential reversal points.
Quickly assess overall market sentiment and individual asset strength.
Integrate a robust momentum analysis into broader technical or fundamental strategies.
Enhance market timing and improve risk management decisions.
⚠️ Important Notes
This indicator does not provide explicit buy or sell signals.
It is intended solely for informational, analytical, and educational purposes.
Past performance and signals are not indicative of future market results.
Always combine with additional tools and analysis as part of comprehensive decision-making.

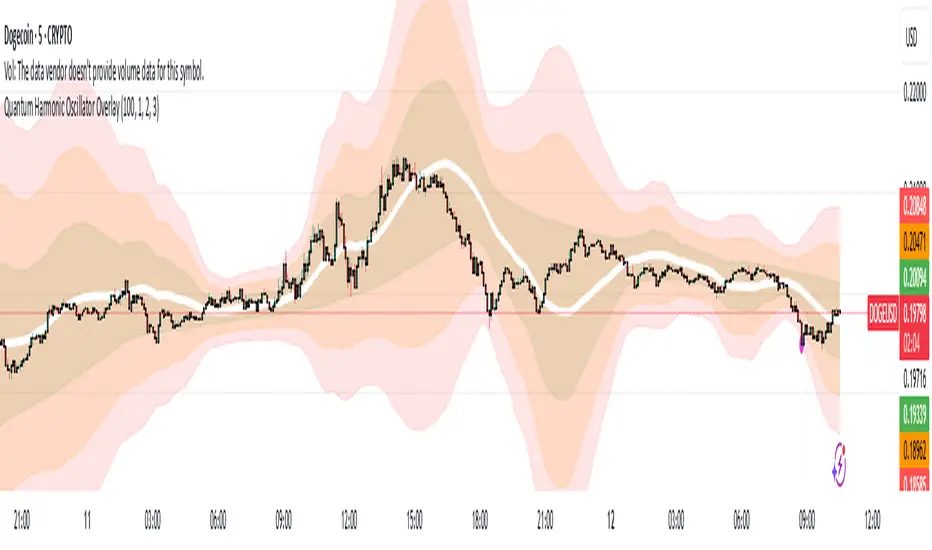
Quantum Harmonic Oscillator Overlay🧪 Quantum Harmonic Oscillator Overlay
A visual model of price behavior using quantum harmonic oscillation principles
📜 Indicator Overview
The Quantum Harmonic Oscillator Overlay applies concepts from both classical physics (harmonic motion) and quantum mechanics (energy states) to model and visualize how price orbits around a central trend line. It overlays a Linear Regression line (representing the “mean position” or ground state of price) and calculates surrounding energy levels (σ-zones) akin to quantum shells that price can "jump" between.
This indicator is particularly useful for visualizing mean reversion, volatility compression/expansion, and momentum-driven price breakthroughs.
🧠 Core Concepts
Linear Regression Line (LSR): This is the calculated center of gravity or equilibrium path of price over a user-defined period. Think of it like the lowest energy state or central axis around which price vibrates.
Standard Deviation Zones (σ-levels):
1σ: The majority of normal price activity; within this range, price tends to fluctuate if in balance.
2σ: Indicates volatility or possible breakout pressure.
3σ: Represents extreme movement — a phase shift in energy, potentially leading to reversal or continuation with higher momentum.
Quantum Analogy: Just like in a quantum harmonic oscillator, particles (here, prices) move probabilistically between discrete energy states. The further the price moves from the center, the more "energy" (momentum, volume, volatility) is implied.
⚙️ Input Parameters
Setting Description
Linear Regression Length The number of bars used to calculate the regression trend (default 100). Affects the central path and responsiveness.
σ Multipliers (1σ, 2σ, 3σ) Determine how far each band is from the regression line. Adjusting these can highlight different price behaviors.
Show Energy Level Zones Toggle visibility of the colored bands around the regression line.
Show LSR Center Line Toggles visibility of the white Linear Regression line itself.
🎨 Visual Components
Color Zone Interpretation
✅ Green ±1σ Normal oscillation / mean reversion area. Ideal for range-bound strategies.
🟧 Orange ±2σ Warning zone; price may be gaining momentum or volatility.
🔴 Red ±3σ High-momentum state or anomaly. These regions may imply trend exhaustion, reversals, or breakouts.
White Line: The LSR — the average trajectory of the price movement.
Pink Dots: Appear when price exceeds Zone 3 (outside ±3σ) — a signal of extreme behavior or a possible regime shift.
📈 How to Use This Indicator
1. Detect Overextensions
When price touches or breaches the 3σ zone, it is likely overextended. This can be used to anticipate potential snapbacks or strong breakout trends.
2. Identify Mean Reversion Trades
If price exits the 2σ or 3σ zones and returns toward the center line, this signals a likely mean reversion setup.
3. Volatility Compression or Expansion
Flat zones between σ levels suggest calm markets; widening bands suggest expanding volatility.
4. Use with Confirmation Tools
Combine with momentum oscillators (MACD, RSI) or volume-based signals to confirm reversals or continuation outside Zone 3.
🔮 Philosophical Note
This indicator embodies the metaphor that the market behaves like a quantum oscillator — price particles exist in a probabilistic field and jump between discrete zones of volatility and energy. Tracking these transitions allows the trader to see price behavior as rhythmic, wave-like, and multidimensional rather than purely linear.
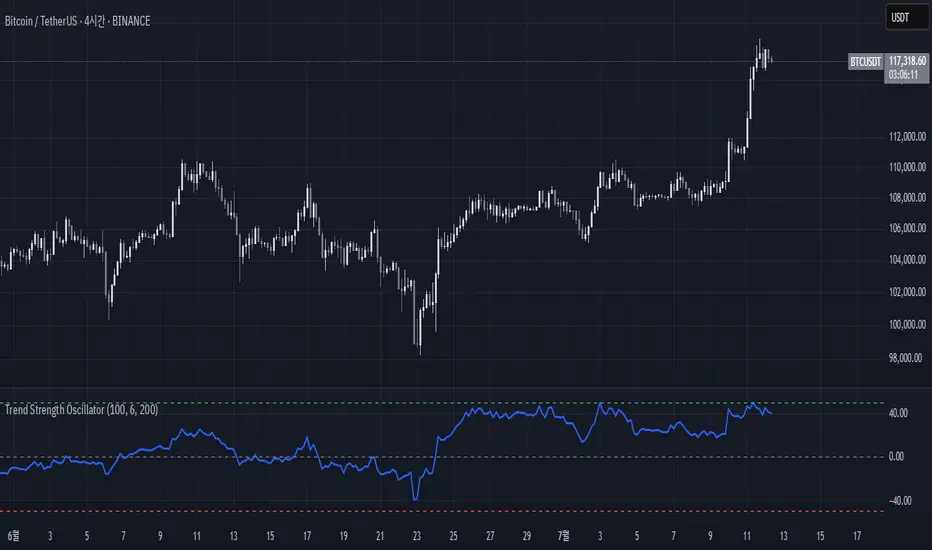
Trend Strength Oscillator📌 Trend Strength Oscillator
📄 Description
Trend Strength Oscillator measures the directional strength of price relative to an adaptive dynamic trend band. It evaluates how far the current price is from the midpoint of a trend channel and normalizes this value by recent volatility range, allowing traders to detect trend strength, direction, and potential exhaustion in any market condition.
📌 Features
🔹 Adaptive Trend Band Logic: Uses a modified ATR and time-dependent spread formula to dynamically adjust upper and lower trend bands.
🔹 Trendline Midpoint Calculation: The central trendline is defined as the average between upper and lower bands.
🔹 Relative Positioning: Measures how far the close is from the center of the band as a percentage.
🔹 Range Normalization: Uses a normalized range to account for recent volatility, reducing noise in the oscillator reading.
🔹 Oscillator Output (±100 scale):
+100 indicates strong bullish momentum
-100 indicates strong bearish momentum
0 is the neutral centerline
🛠️ How to Use
✅ Trend Strength > +50: Indicates a strong bullish phase.
✅ Trend Strength < -50: Indicates a strong bearish phase.
⚠️ Crossing above 0: Potential bullish trend initiation.
⚠️ Crossing below 0: Potential bearish trend initiation.
📉 Values near 0: Suggest trend weakness or ranging conditions.
Best suited timeframes: 1H, 4H, Daily
Ideal combination with: RSI, MACD, volume-based oscillators, moving average crosses
✅ TradingView House Rules Compliance
This indicator is written in Pine Script v5 and fully open-source.
The script does not repaint, does not generate false alerts, and does not access external or private data.
It is intended strictly as a technical analysis tool, and not a buy/sell signal generator.
Users are encouraged to combine this tool with other confirmations and independent judgment in trading decisions.
=========================================================
📌 Trend Strength Oscillator
📄 설명 (Description)
Trend Strength Oscillator는 가격이 동적 추세 밴드 내 어디에 위치해 있는지를 정량적으로 분석하여, 추세의 방향성과 강도를 시각적으로 보여주는 오실레이터 지표입니다. 최근 변동성을 반영한 밴드를 기반으로 가격 위치를 정규화하여, 과매수·과매도 상태나 추세의 소멸 가능성까지 탐지할 수 있도록 설계되었습니다.
📌 주요 특징 (Features)
🔹 적응형 추세 밴드 계산: ATR과 시간 경과를 기반으로 상단/하단 밴드를 동적으로 조정
🔹 중심 추세선 산출: 상단과 하단 밴드의 평균값을 중심선으로 활용하여 기준 축 제공
🔹 상대 위치 계산: 현재 종가가 중심선에서 얼마나 떨어져 있는지를 정규화하여 추세 강도 계산
🔹 변동성 기반 정규화: 최근 밴드 범위를 기준으로 상대 거리를 0~100 사이 값으로 변환
🔹 오실레이터 출력 (범위: ±100):
+100에 가까울수록 강한 상승 추세
-100에 가까울수록 강한 하락 추세
0에 가까울수록 횡보 구간 가능성
🛠️ 사용법 (How to Use)
✅ +50 이상: 강한 상승 추세 지속 중
✅ -50 이하: 강한 하락 추세 지속 중
⚠️ 0선 돌파 상향: 상승 추세 시작 가능성
⚠️ 0선 돌파 하향: 하락 추세 시작 가능성
🟡 0 근처 유지: 추세 약화 또는 횡보장 가능성
추천 시간대: 1시간봉, 4시간봉, 일봉
보조 지표로 추천: RSI, MACD, OBV, 이동평균 크로스 등과 함께 활용 시 효과적
✅ 트레이딩뷰 하우스룰 준수사항 (TradingView House Rules Compliance)
본 지표는 Pine Script v5로 작성된 오픈소스 공개용 스크립트입니다.
리페인트(Repaint) 현상이 없으며, **허위 경고(Spam Alerts)**나 성능 저하 요소도 없습니다.
외부 데이터 접근 없이 완전히 자체 계산으로 동작합니다.
이 지표는 투자 판단을 돕기 위한 분석용 도구이며, 직접적인 매수·매도 신호로 사용해서는 안 됩니다.
모든 트레이딩은 사용자의 독립적인 판단과 책임 하에 이루어져야 합니다.
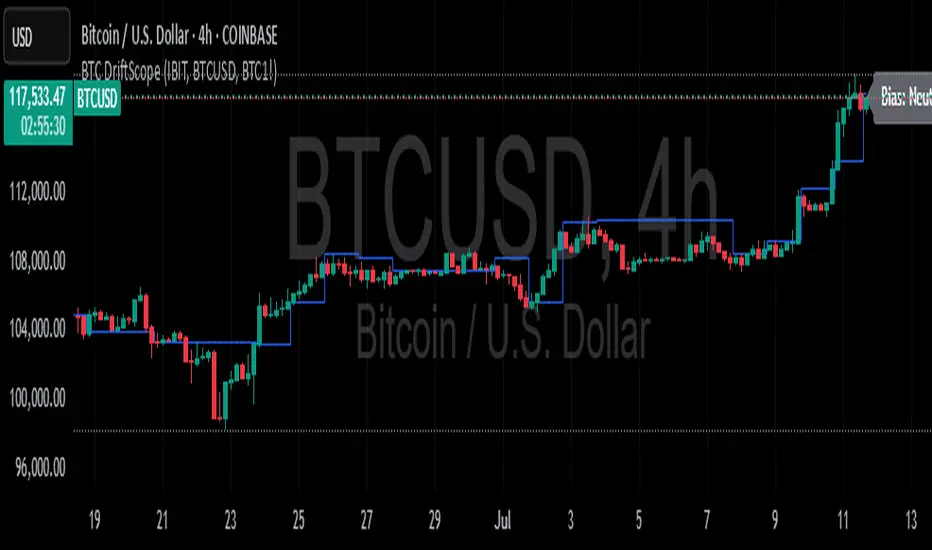
Mongoose Capital: BTC ETF DriftScope ProMongoose Capital: BTC ETF DriftScope Pro
A proprietary indicator for monitoring drift between Bitcoin Spot (BTCUSD) and Bitcoin Spot ETFs (such as IBIT). Designed to detect ETF premium/discount zones and generate actionable Fade or Long bias signals.
What it Does
Tracks IBIT and BTCUSD spread to highlight ETF price deviations.
Calculates correlation Z-Score for ETF/Spot alignment.
Outputs numeric bias signals: Fade (1), Long (1), Neutral (1).
How to Use
Apply to a BTCUSD chart (4H, 1D, or higher recommended).
Open the Data Window to view:
IBIT Spread %
Correlation Z-Score
Correlation %
Bias Flags (Fade, Long, Neutral)
Configure alerts for Fade and Long Bias conditions.
Confirm all signals with your trade plan and risk management.
Methodology
This tool calculates the percentage spread between IBIT and BTC Spot. A rolling Z-Score of the correlation is used to detect periods of significant divergence.
Fade Bias suggests potential short setups in premium zones with high Z-Scores.
Long Bias suggests potential long setups in discount zones with low Z-Scores.
Disclaimer
This indicator is for educational purposes only. It is not financial advice. Use at your own risk and verify signals independently.
Zero-Lag RSI DivergenceZero-Lag RSI Divergence
Overview
This indicator identifies RSI divergences in real-time without delay, providing immediate signals as price-momentum discrepancies develop. The indicator analyzes price action against RSI momentum across dual configurable periods, enabling traders to detect potential reversal opportunities with zero lag.
Key Features
Instant Divergence Detection : Identifies bullish and bearish divergences immediately upon formation without waiting for candle confirmation or historical validation. This eliminates signal delay but may increase false signals due to higher sensitivity.
Dual Period Analysis : Configure detection across two independent cycles - Short Period (default 15) and Long Period (default 50) - allowing for multi-timeframe divergence analysis and enhanced signal validation across different market conditions.
Visual Divergence Lines : Automatically draws dashed lines connecting divergence points between price highs/lows and corresponding RSI peaks/troughs, clearly illustrating the momentum-price relationship.
Customizable RSI Parameters : Adjustable RSI length (default 14) allows optimization for different market volatility and trading timeframes.
How It Works
The indicator continuously monitors price action patterns and RSI momentum:
- Bullish Divergence : Detected when price makes lower lows while RSI makes higher lows, suggesting potential upward momentum
- Bearish Divergence : Identified when price makes higher highs while RSI makes lower highs, indicating potential downward momentum
The algorithm uses candle color transitions and immediate RSI comparisons to trigger signals without historical repainting , ensuring backtesting accuracy and real-time reliability.
How To Read
Important Notes
Higher Signal Frequency : The zero-lag approach increases signal sensitivity, generating more frequent alerts that may include false signals. Consider using additional confirmation methods for trade entries.
Non-Repainting : All signals are generated and maintained without historical modification, ensuring consistent backtesting and forward-testing results.
Input Parameters
RSI Length: Period for RSI calculation (default: 14)
Short/Long Periods: Lookback periods for divergence detection (default: 15/50)
Line Colors: Customizable colors for short and long period divergence lines
Label Settings: Optional divergence labels with custom text
This indicator is designed for traders seeking immediate divergence identification across multiple timeframes while maintaining signal integrity and backtesting reliability.
RSI PotentialRSI Potential
This indicator does more than just track RSI; it measures the "energy" or "fuel" left in a trend. It answers a critical question: how much further can the price move before momentum is exhausted?
The key insight is that high momentum often means low potential, and vice versa. This inverse relationship is what allows the indicator to provide powerful, forward-looking signals about trend health and potential reversals.
Think of it like a race car:
Momentum is the car's current speed.
Potential is the amount of fuel left in the tank.
A car at top speed (high momentum) is burning fuel rapidly (potential is decreasing). A car just starting (low momentum) has a full tank of fuel (high potential). This indicator helps you see the fuel gauge, not just the speedometer.
This indicator plots three distinct components in a separate pane below your chart:
1. Upside Potential (Green Line)
What it shows: The percentage price increase required to hit the Overbought RSI Level. In other words, how much "fuel" is left for the upward trend.
How to interpret it:
Low Value (Approaching Zero): This is a warning sign. It means the price is already in high gear, and there is very little room left to run before hitting overbought exhaustion. Even if the price is rocketing up (high momentum), low potential signals the rally is likely on its last legs.
High Value: This indicates the market has a full tank of fuel for a rally. Even if the price is moving sideways or slowly (low momentum), the high potential suggests that if a new uptrend starts, it has the energy to be sustainable and significant.
2. Downside Potential (Red Line)
What it shows: The percentage price decrease required to hit the Oversold RSI Level—the "fuel" for a downtrend.
How to interpret it:
Low Value (Approaching Zero): A warning for bears. The price may be dropping fast (high momentum), but it's running out of energy to fall further. This signals seller exhaustion and increases the probability of a bounce or reversal.
High Value: The market has significant room to fall before becoming oversold. This can confirm the health of a new downtrend or suggest that a current downtrend has more to go.
3. Net Potential (Columns / Histogram)
What it shows: The net balance of energy: Upside Potential - Downside Potential. It answers, "Which side has more fuel in the tank?"

Intelligent Top & Bottom Finder v9.8 Keyvankh📈 Intelligent Top & Bottom Finder v9.8 Keyvankh
A next-generation all-in-one trading system for precise tops, bottoms, and reversals across all timeframes.
---
🟢 Overview
This indicator is a powerful and intelligent solution for detecting market tops and bottoms, key reversals, and S/R zones with institutional-grade accuracy. Designed for traders seeking an edge in any market (crypto, forex, stocks), it combines advanced candlestick recognition, multi-indicator confirmation, smart support/resistance clustering, and strict signal filtering into one seamless tool.
---
🔎 How Does It Work?
1. Advanced Support & Resistance Clustering
Automatically detects and draws high-probability support and resistance zones using dynamic ATR-based pivot clustering.
Highlights breakouts and retest (flip) zones in real-time, adapting to changing market structure.
2. Full Candlestick Pattern Recognition
Scans for 15+ classic and advanced patterns: Engulfing, Pin Bar, Doji, Three Bar, Marubozu, Hammer, Shooting Star, Three White Soldiers, Three Black Crows, Tweezer, Morning/Evening Star, Kicker, Belt Hold, and more.
Scores each pattern’s strength based on location (S/R zone, retest, breakout), volume context, and confirmation signals.
3. Multi-Indicator Confirmation Engine**
Integrates and scores confirmation from up to five additional sources:
RSI Games 1.2** (smoothed LTF momentum shifts)
MACD Divergence** (bullish/bearish momentum reversal)
QQE+ v7 Advanced** (dynamic volatility filter)
OBV Trend Filter** (volume-backed trend validation)
Volume Game** (net volume spike and reversal detection)
Each module can be enabled or disabled to fit your personal trading style.
4. Institutional S/R and Retest Logic
Real-time recognition of major trendline breaks, retest zones, and price flips.
Automatic labeling and coloring of S/R zones, retest boxes, and confirmation candles.
5. Smart Buy & Sell Signal Generation**
Combines all scoring modules with strict logical filters and “failsafe override” logic (guaranteeing signal on confirmed hammers, engulfings, etc. even if other filters disagree).
Plots clear “BUY” and “SELL” labels only when a strong, multi-factor signal appears—minimizing noise and maximizing reliability.
Built-in fallback logic (optional) for edge cases.
6. Alerts & Automation Ready
TradingView alerts for all BUY, SELL, or ANY signal conditions—perfect for auto-trading or notification setups.
---
*⚙️ Customizable Inputs
Enable/Disable any module (RSI Games, MACD, OBV, QQE+, Candlestick Scanner, Volume Game)
Minimum Confirmations** required for a signal (1–10)
Pivot/Zone Sensitivity:** ATR multiplier, pivots per cluster, retest bar duration
LTF (Lower Timeframe) Confirmation:** Fully configurable
---
📊 How To Use**
Apply on any timeframe and symbol**—crypto, stocks, forex, indices.
Use as a **standalone reversal/entry tool** or to confirm your own technical setups.
Combine with your favorite momentum, trend, or volume indicators for advanced confluence.
Set up **TradingView alerts** for auto-trading, Telegram/email notifications, or trade journaling.
---
🟢 What Makes This Unique?
All-in-one multi-indicator fusion:** No more juggling a dozen scripts.
Institutional logic:** Goes beyond basic signals with true S/R, retest, and volume logic.
Full transparency:** Source code is clear and commented (if published open-source).
Fast and reliable:** Optimized for minimal lag and maximum accuracy.
---
⚠️ Disclaimer**
This indicator is a tool to assist with trade timing and risk management. **No system is 100% accurate.** Always use in conjunction with your own analysis and risk management practices.
---
📚 Credits & License**
Created by Keyvan Khodakhah.
You may use, modify, or share this script under the (mozilla.org).
Please credit the original author if you fork or reuse in public.
---
Questions, feedback, or collaboration? Contact: Keyvankh
---
Precision in technical analysis comes from layers of confluence and discipline. This tool brings that precision to your chart.

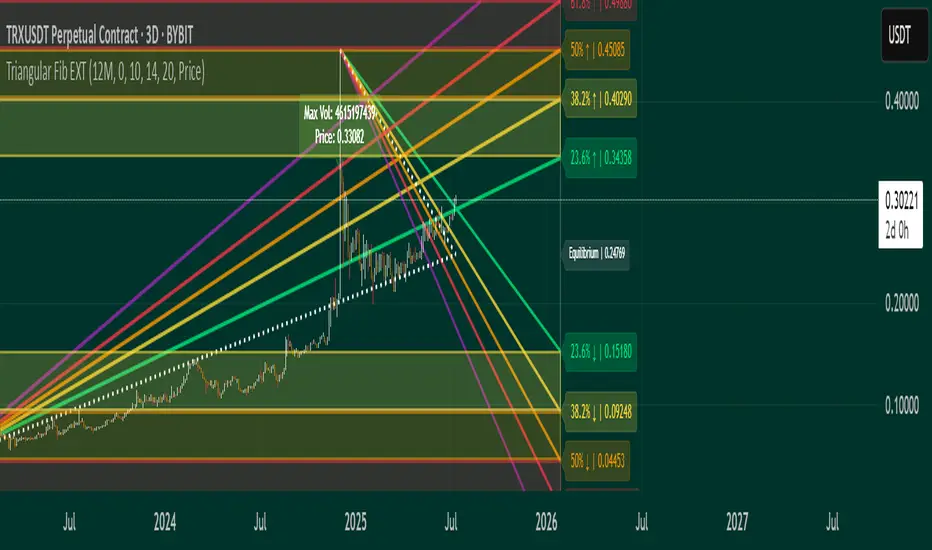
Triangular Fib🔍 Features
- Dynamic Lookback & Projection: Automatically adjusts the range and projection horizon based on timeframe changes.
- Triangular Fibonacci Arms: Projects fib levels upward and downward from high/low extremes to highlight potential price inflections.
- Volatility-Shaded Equilibrium: Visual zone highlights areas of consolidation or energy buildup before breakouts.
- Breakout Alerts: Detects and signals bullish/bearish breakouts from triangular fib thresholds.
- Auto-Traced Triangle Wedge: Dotted wedge lines visually represent narrowing price action from range extremes to midpoint.
Ideal for traders who seek visual clarity, price symmetry, and alert-driven decision-making across multiple timeframes. Whether you're swing trading or intraday scouting, this script provides a richly layered roadmap of market potential.
Not financial advice.
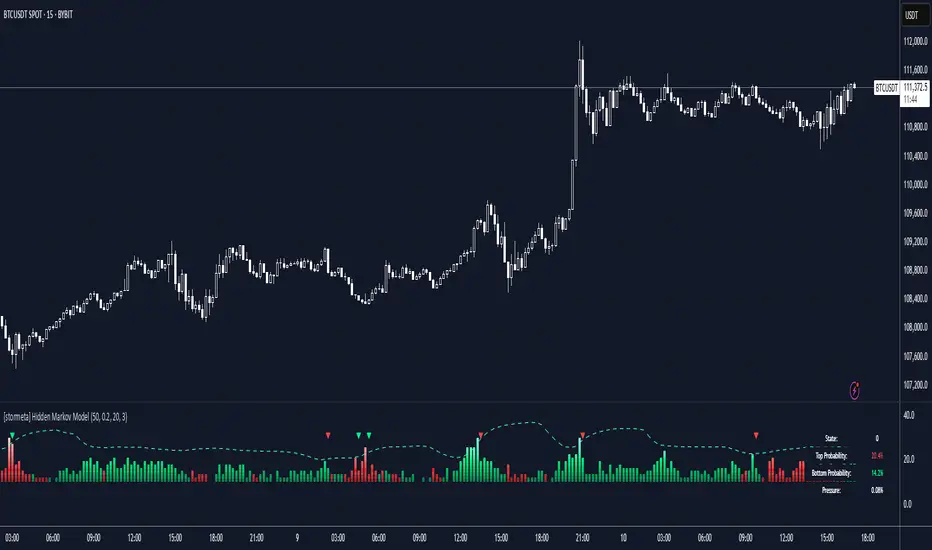
Hidden Markov ModelOverview
This model uses a Hidden Markov Model to identify and predict market regimes in real-time. It is designed to probabilistically identify market regime changes and predict potential reversal point using a forward algorithm to calculate the probability of a state.
Unlike traditional technical indicators that rely on price patterns or moving averages, this HMM analyses the underlying statistical structure of market movements to detect when the market transitions between different behavioural states such as trending, ranging, or volatile periods
How it works
The HMM assumes that market behavior follows hidden states that aren't directly observable, but can be inferred from observable market data (emissions). The model uses a (somewhat simplified) Bayesian inference to estimate these probabilities.
State 0: (Normal Trading): Market continuation patterns, balanced buying/selling
State 1: (Top Formation): Exhaustion patterns at price highs
State 2: (Bottom Formation): Capitulation patterns at price lows
How to use
1) Identify the trend (you can also use it counter-trend)
2) For longing, look for a green arrow. The probability values should be red. For shorting, look for a red arrow. The probability values should be green
3) For added confluence, look for high probability values of above 25%.
Advantages and what makes it unique
Unlike moving averages or oscillators that react to price changes, the HMM proactively identifies the underlying market structure. This forward-looking approach can signal regime changes before they become apparent in price action, providing traders with an informational edge.