Session Range ProjectionsSession Range Projections
Purpose & Concept:
Session Range Projections is a comprehensive trading tool that identifies and analyzes price ranges during user-defined time periods. The indicator visualizes high-probability reversal zones and profit targets by projecting Fibonacci levels from custom session ranges, making it ideal for traders who focus on time-based market structure analysis.
Key Features & Calculations:
1. Custom Time Range Analysis
- Define any time period for range calculation - from traditional sessions (Asian, London, NY) to custom periods like opening ranges, hourly ranges, or 4-hour blocks
- Automatically captures the highest and lowest prices within your specified timeframe
- Supports multiple timezone selections for global market analysis
- Flexible enough for intraday scalping ranges or longer-term swing trading setups
2. Premium & Discount Zones
- Automatically divides the range into premium (above 50%) and discount (below 50%) zones
- Visual differentiation helps identify institutional buying and selling areas
- Color-coded boxes clearly mark these critical price zones
3. Optimal Trade Entry (OTE) Zones
- Highlights the 79-89% retracement zone in premium territory
- Highlights the 11-21% retracement zone in discount territory
- These zones represent high-probability reversal areas based on institutional order flow concepts
4. Fibonacci Projections
- Projects 11 customizable Fibonacci extension levels from the range extremes
- Levels extend both above and below the range for symmetrical analysis
- Each level can be individually toggled and color-customized
- Default levels include common retracement ratios: -0.5, -1.0, -2.0, -2.33, -2.5, -3.0, -4.0, -4.5, -6.0, -7.0, -8.0
How to Use:
Set Your Time Range: Input your desired session start and end times (24-hour format)
Select Timezone: Choose the appropriate timezone for your trading session
Customize Display: Toggle various visual elements based on your preferences
Monitor Price Action: Watch for reactions at projected levels and OTE zones
Set Alerts: Configure sweep alerts for when price breaks above/below range extremes
Input Parameters Explained:
Time Range Settings
Range Start/End Hour & Minute: Define your analysis period
Time Zone: Ensure accurate session timing across different markets
Visual Settings
Range Box: Toggle the premium/discount zone visualization
Horizontal Lines: Customize high/low line appearance
Internal Range Levels: Show/hide equilibrium and OTE zones
Labels: Configure text display for key levels
Fibonacci Projections: Enable/disable extension levels
Display Settings
Historical Ranges: Show up to 10 previous session ranges
Alert Type: Choose between high sweep, low sweep, or both
Trading Applications:
Session-Based Trading: Analyze specific market sessions (Asian, London, New York, opening ranges, hourly ranges)
Reversal Trading: Identify high-probability reversal zones at OTE levels
Breakout/Reversal Trading: Monitor range breaks/reversals with built-in sweep alerts
Risk Management: Use Fibonacci projections as profit targets or rejection areas
Multi-Timeframe Analysis: Apply to any timeframe for various trading styles
Important Notes:
This indicator is for educational purposes only and should not be considered financial advice
Past performance does not guarantee future results
Always use proper risk management when trading
The indicator automatically manages historical data to maintain chart performance
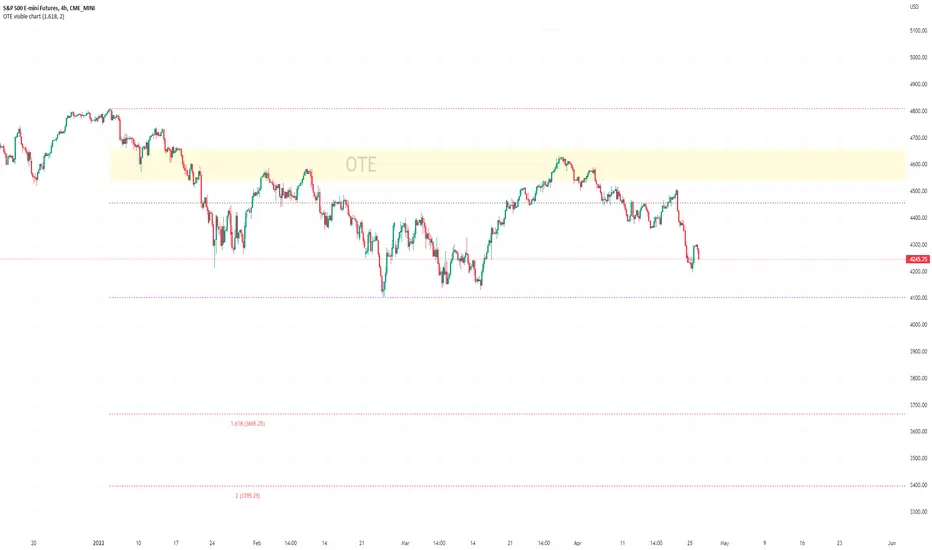
OTE

Fibonacci Optimal Entry Zone [OTE] (Zeiierman)█ Overview
Fibonacci Optimal Entry Zone (Zeiierman) is a high-precision market structure tool designed to help traders identify ideal entry zones during trending markets. Built on the principles of Smart Money Concepts (SMC) and Fibonacci retracements, this indicator highlights key areas where price is most likely to react — specifically within the "Golden Zone" (between the 50% and 61.8% retracement).
It tracks structural pivot shifts (CHoCH) and dynamically adjusts Fibonacci levels based on real-time swing tracking. Whether you're trading breakouts, pullbacks, or optimal entries, this tool brings unparalleled clarity to structure-based strategies.
Ideal for traders who rely on confluence, this indicator visually synchronizes swing highs/lows, market structure shifts, Fibonacci retracement levels, and trend alignment — all without clutter or lag.
⚪ The Structural Assumption
Price moves in waves, but key retracements often lead to continuation or reversal — especially when aligned with structure breaks and trend shifts.
The Optimal Entry Zone captures this behavior by anchoring Fibonacci levels between recent swing extremes. The most powerful area — the Golden Zone — marks where institutional re-entry is likely, providing traders with a sniper-like roadmap to structure-based entries.
█ How It Works
⚪ Structure Tracking Engine
At its core, the indicator detects pivots and classifies trend direction:
Structure Period – Determines the depth of pivots used to detect swing highs/lows.
CHoCH – Break of structure logic identifies where the trend shifts or continues, marked visually on the chart.
Bullish & Bearish Modes – Independently toggle uptrend and downtrend detection and styling.
⚪ Fibonacci Engine
Upon each confirmed structural shift, Fibonacci retracement levels are projected between swing extremes:
Custom Levels – Choose which retracements (0.50, 0.618, etc.) are shown.
Real-Time Adjustments – When "Swing Tracker" is enabled, levels and labels update dynamically as price forms new swings.
Example:
If you disable the Swing Tracker, the Golden Level is calculated using the most recent confirmed swing high and low.
If you enable the Swing Tracker, the Golden Level is calculated from the latest swing high or low, making it more adaptive as the trend evolves in real time.
█ How to Use
⚪ Structure-Based Entry
Wait for CHoCH events and use the resulting Fibonacci projection to identify entry points. Enter trades as price taps into the Golden Zone, especially when confluence forms with swing structure or order blocks.
⚪ Real-Time Reaction Tracking
Enable Swing Tracker to keep the tool live — constantly updating zones as price shifts. This is especially useful for scalpers or intraday traders who rely on fresh swing zones.
█ Settings
Structure Period – Number of bars used to define swing pivots. Larger values = stronger structure.
Swing Tracker – Auto-updates fib levels as new highs/lows form.
Show Previous Levels – Keep older fib zones on chart or reset with each structure shift.
-----------------
Disclaimer
The content provided in my scripts, indicators, ideas, algorithms, and systems is for educational and informational purposes only. It does not constitute financial advice, investment recommendations, or a solicitation to buy or sell any financial instruments. I will not accept liability for any loss or damage, including without limitation any loss of profit, which may arise directly or indirectly from the use of or reliance on such information.
All investments involve risk, and the past performance of a security, industry, sector, market, financial product, trading strategy, backtest, or individual's trading does not guarantee future results or returns. Investors are fully responsible for any investment decisions they make. Such decisions should be based solely on an evaluation of their financial circumstances, investment objectives, risk tolerance, and liquidity needs.

CandelaCharts - Fib Retracement (OTE) 📝 Overview
The CandelaCharts Fib Retracement (OTE) indicator is a precision tool designed to help traders identify Optimal Trade Entry (OTE) levels based on Fibonacci retracement principles, as taught in ICT (Inner Circle Trader) methodology.
This indicator automatically plots Fibonacci retracement levels between a selected swing high and swing low, highlighting the key OTE zone between the 61.8% and 78.6% retracement levels—a prime area for potential reversals in trending markets.
📦 Features
Automatic & Custom lookback modes
Customizable fib levels
Dynamic coloring
Reverse & extend
⚙️ Settings
Lookback: Controls the number of bars to look back. You can choose between **Automatic** or **Custom** mode.
Line Style: Sets the line style for the Fibonacci levels.
Levels: 0, 0.236, 0.0.382, 0.500, 0.620, 0.705, 0.790, 0.886, 1.000. Allows you to toggle the visibility of Fibonacci levels.
Dynamic Coloring: Colors Fibonacci levels according to trend direction.
Show Labels: Shows the price value at each Fibonacci level.
Reverse: Flips the Fibonacci levels in the opposite direction.
Extend Left: Extends the Fibonacci levels to the left.
⚡️ Showcase
Dynamic Coloring
Manual Coloring
Fib Retracement
Extended
Custom Length
📒 Usage
Using the CandelaCharts Fib Retracement (OTE) is pretty straightforward—just follow these steps to spot high-probability trade setups and refine your entries.
Identify the Trend – Determine whether the market is in an uptrend or downtrend.
Select Swing Points – The indicator automatically plots from the most recent swing high to swing low (or vice versa).
Wait for Price to Enter OTE Zone – Look for price action confirmation within the optimal entry zone (61.8%-78.6%).
Enter the Trade – Consider longs in an uptrend at the OTE zone, and shorts in a downtrend.
Set Stop & Target – Place stops below/above the swing low/high and target extension levels (127.2%, 161.8%).
🎯 Key takeways
The CandelaCharts Fib Retracement (OTE) is a must-have tool for traders looking to refine their entries and maximize risk-reward potential with precision-based ICT trading strategies. 🚀
🚨 Alerts
The indicator does not provide any alerts!
⚠️ Disclaimer
Trading involves significant risk, and many participants may incur losses. The content on this site is not intended as financial advice and should not be interpreted as such. Decisions to buy, sell, hold, or trade securities, commodities, or other financial instruments carry inherent risks and are best made with guidance from qualified financial professionals. Past performance is not indicative of future results.

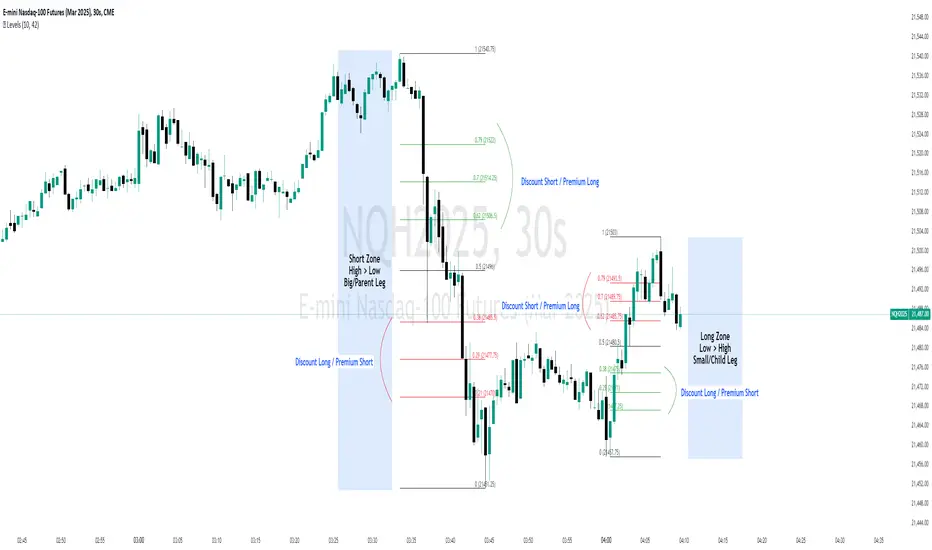
Discount/Premium OTE LevelsThis indicator is created to identify discount/premium areas to provide additional confluence to trades taken. The underlying theory is that the trades taken in discounted areas are likely to have less risk due to a smaller stop loss and a higher reward/risk ratio.
The indicator operates by first identifying a zone between the last major swing high and low. These highs and lows are determined as price points that at the extremes within the number of bars to the left, as defined by the "Swing Sensitivity" setting.
Once a price zone is established, the indicator verifies that the zone meets the minimum size in points as configured via the "Minimum size" setting to be considered tradable. Zones that are too small may not provide a sufficient range even for scalping. The default value is 42 points based on Nasdaq, which means that the distance between inner most OTE levels (0.382 and 0.618) is at least 10 points.
When a valid zone is identified, it is then subdivided into areas of interest based on OTE levels, which can be configured/adjusted via the "Levels to Draw" setting. These levels represent the midpoint (50%), which distinguishes between premium and discount, and the three OTE levels 0.79, 0.705, 0.618, above the 50% for discount and below the 50% for premium.
For example, if a zone is formed initially by a swing low followed by a swing high with the assumption that the draw is higher, the indicator can be used to formulate long positions from below the 50% level starting at 0.38 OTE level, or ideally at 0.295 OTE level using 0 as a stop loss. Alternatively, if the 50% level is not yet tapped, short scalp positions can be made from 0.79-0.618 OTE levels with 50% as a partial or TP target.
See for long/short example
Typically, the indicator will show only a single zone. However, there may be cases with two zones: one larger parent zone containing a smaller, valid price zone within itself.
The indicator will automatically invalidate and remove the zone once the high/low of the zone is invalidated.
Configuration:
The indicator provides several visualization options for customization, including:
Color settings for OTE levels, with separate settings for edge/50% color, premium, and discount levels.
Settings for line style for OTE levels.
Settings to determine whether to show prices on level labels.
Settings to decide if lines should be extended to the right.
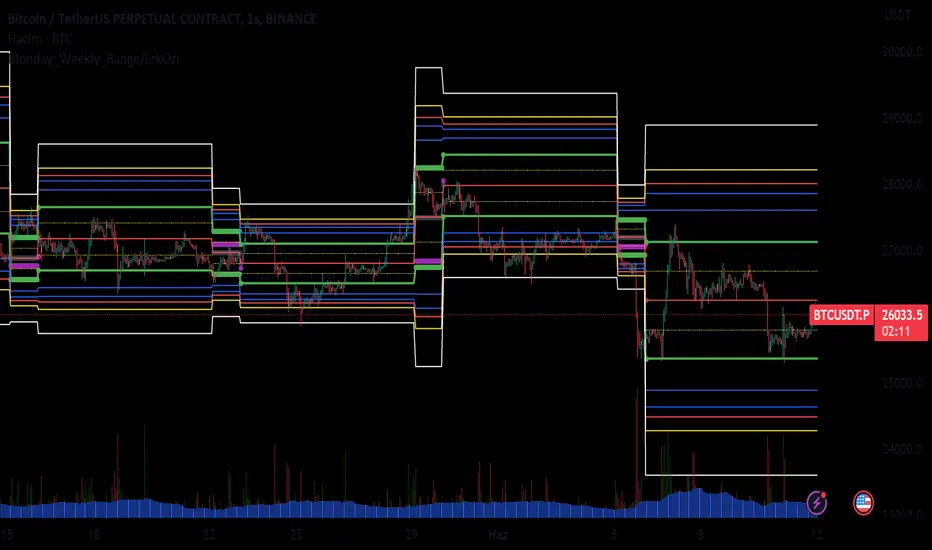
Monday_Weekly_Range/ErkOzi/Deviation Level/V1"Hello, first of all, I believe that the most important levels to look at are the weekly Fibonacci levels. I have planned an indicator that automatically calculates this. It models a range based on the weekly opening, high, and low prices, which is well-detailed and clear in my scans. I hope it will be beneficial for everyone.
***The logic of the Monday_Weekly_Range indicator is to analyze the weekly price movement based on the trading range formed on Mondays. Here are the detailed logic, calculation, strategy, and components of the indicator:
***Calculation of Monday Range:
The indicator calculates the highest (mondayHigh) and lowest (mondayLow) price levels formed on Mondays.
If the current bar corresponds to Monday, the values of the Monday range are updated. Otherwise, the values are assigned as "na" (undefined).
***Calculation of Monday Range Midpoint:
The midpoint of the Monday range (mondayMidRange) is calculated using the highest and lowest price levels of the Monday range.
***Fibonacci Levels:
// Calculate Fibonacci levels
fib272 = nextMondayHigh + 0.272 * (nextMondayHigh - nextMondayLow)
fib414 = nextMondayHigh + 0.414 * (nextMondayHigh - nextMondayLow)
fib500 = nextMondayHigh + 0.5 * (nextMondayHigh - nextMondayLow)
fib618 = nextMondayHigh + 0.618 * (nextMondayHigh - nextMondayLow)
fibNegative272 = nextMondayLow - 0.272 * (nextMondayHigh - nextMondayLow)
fibNegative414 = nextMondayLow - 0.414 * (nextMondayHigh - nextMondayLow)
fibNegative500 = nextMondayLow - 0.5 * (nextMondayHigh - nextMondayLow)
fibNegative618 = nextMondayLow - 0.618 * (nextMondayHigh - nextMondayLow)
fibNegative1 = nextMondayLow - 1 * (nextMondayHigh - nextMondayLow)
fib2 = nextMondayHigh + 1 * (nextMondayHigh - nextMondayLow)
***Fibonacci levels are calculated using the highest and lowest price levels of the Monday range.
Common Fibonacci ratios such as 0.272, 0.414, 0.50, and 0.618 represent deviation levels of the Monday range.
Additionally, the levels are completed with -1 and +1 to determine at which level the price is within the weekly swing.
***Visualization on the Chart:
The Monday range, midpoint, Fibonacci levels, and other components are displayed on the chart using appropriate shapes and colors.
The indicator provides a visual representation of the Monday range and Fibonacci levels using lines, circles, and other graphical elements.
***Strategy and Usage:
The Monday range represents the starting point of the weekly price movement. This range plays an important role in determining weekly support and resistance levels.
Fibonacci levels are used to identify potential reaction zones and trend reversals. These levels indicate where the price may encounter support or resistance.
You can use the indicator in conjunction with other technical analysis tools and indicators to conduct a more comprehensive analysis. For example, combining it with trendlines, moving averages, or oscillators can enhance the accuracy.
When making investment decisions, it is important to combine the information provided by the indicator with other analysis methods and use risk management strategies.
Thank you in advance for your likes, follows, and comments. If you have any questions, feel free to ask."
OTE optimal trade entry (ICT); visible chart only: Dynamic-simple tool based on ICT free YouTube material of many years.
-Highlights a box showing Optimal Trade Entry (OTE): 61.8% - 78.6% retracement
-Auto shifts depending on Bull or Bear move on chart.
--If visible chart is Bullish (low then high): shows OTE box 61.8-78.6% retracement down from the high
--If visible chart is Bearish (high then low): shows OTE box 61.8-78.6% retracement up from the low
-Thanks the use of PineCoders Visible Chart Library, and some of the example code there
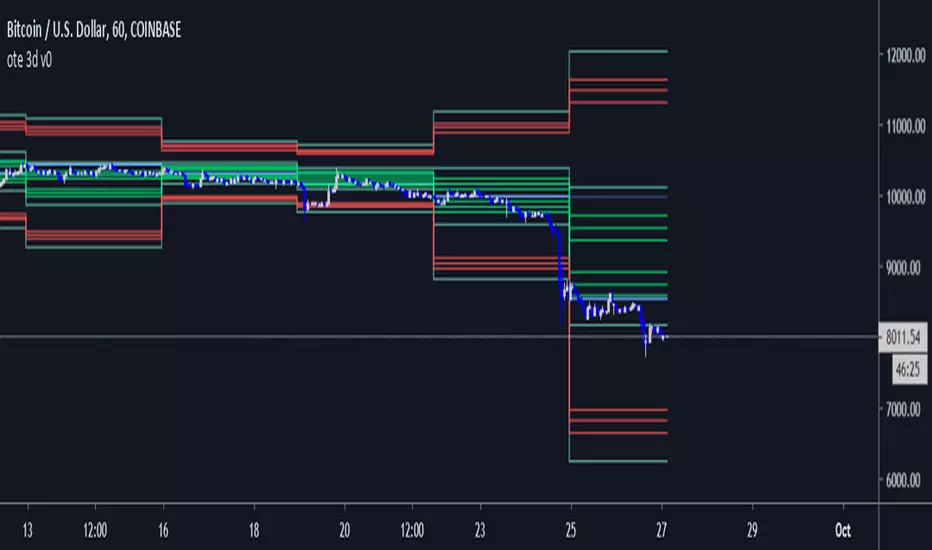
ote 3d v0This was supposed to be an automatic ICT OTE (Optimal Trade Entry) Fib level placement on a 3-day scale, but this did not turn out anywhere near close to how I envisioned it working.
Probably with some more development and applied math for the fib levels, I can get this to work even with breached 3D levels, but currently it's an exercise in frustration.