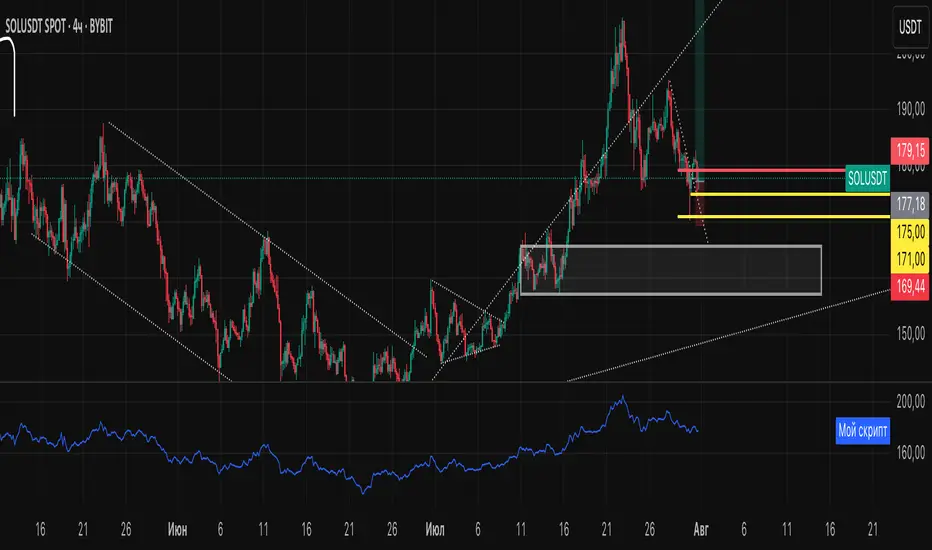
скрипт чат gpt//@version=5
indicator("Swing+DCA Strategy", overlay=true, max_labels_count=500)
// ===== EMA =====
ema7 = ta.ema(close, 7)
ema26 = ta.ema(close, 26)
ema200 = ta.ema(close, 200)
plot(ema7, color=color.yellow, linewidth=1, title="EMA 7")
plot(ema26, color=color.red, linewidth=1, title="EMA 26")
plot(ema200, color=color.white, linewidth=1, title="EMA 200")
// ===== MACD =====
fastLength = 8
slowLength = 24
signalLength = 9
macdValue = ta.ema(close, fastLength) - ta.ema(close, slowLength)
macdSignal = ta.ema(macdValue, signalLength)
macdHist = macdValue - macdSignal
// MACD визуализация в отдельном окне
macdColor = macdHist >= 0 ? color.green : color.red
plot(macdValue, color=color.new(color.blue, 0), title="MACD Line", display=display.none)
plot(macdSignal, color=color.new(color.orange, 0), title="MACD Signal", display=display.none)
plot(macdHist, style=plot.style_columns, color=macdColor, title="MACD Histogram", display=display.none)
// ===== RSI =====
rsi = ta.rsi(close, 14)
hline(70, 'RSI Overbought', color=color.red)
hline(50, 'RSI Midline', color=color.gray)
hline(30, 'RSI Oversold', color=color.green)
// ===== Supertrend =====
atrPeriod = 10
factor = 3.0
= ta.supertrend(factor, atrPeriod)
plot(supertrend, color=direction < 0 ? color.red : color.green, title="Supertrend")
// ===== ADX =====
adx = ta.adx(14)
plotchar(adx > 20, char="▲", location=location.bottom, color=color.green, size=size.tiny, title="ADX>20")
// ===== Pivot Points Classic =====
pivotType = input.string("Classic", "Pivot Type", options= )
piv = request.security(syminfo.tickerid, "D", ta.pivothigh(high, 3, 3))
plotshape(piv, style=shape.triangledown, location=location.abovebar, color=color.red, size=size.tiny, title="Pivot High")
pivl = request.security(syminfo.tickerid, "D", ta.pivotlow(low, 3, 3))
plotshape(pivl, style=shape.triangleup, location=location.belowbar, color=color.green, size=size.tiny, title="Pivot Low")
// ===== Smart DCA (условная подсветка) =====
buyZone = rsi < 35 and close < ema200
bgcolor(buyZone ? color.new(color.green, 85) : na, title="Smart DCA Zone")
// ===== Alerts =====
longSignal = ta.crossover(ema7, ema26) and macdValue > macdSignal and rsi > 50 and adx > 20
shortSignal = ta.crossunder(ema7, ema26) and macdValue < macdSignal and rsi < 50 and adx > 20
plotshape(longSignal, title="Buy Signal", style=shape.labelup, color=color.green, text="BUY", size=size.small, location=location.belowbar)
plotshape(shortSignal, title="Sell Signal", style=shape.labeldown, color=color.red, text="SELL", size=size.small, location=location.abovebar)
alertcondition(longSignal, title="Buy Alert", message="Swing+DCA: BUY signal!")
alertcondition(shortSignal, title="Sell Alert", message="Swing+DCA: SELL signal!")
Indicators and strategies
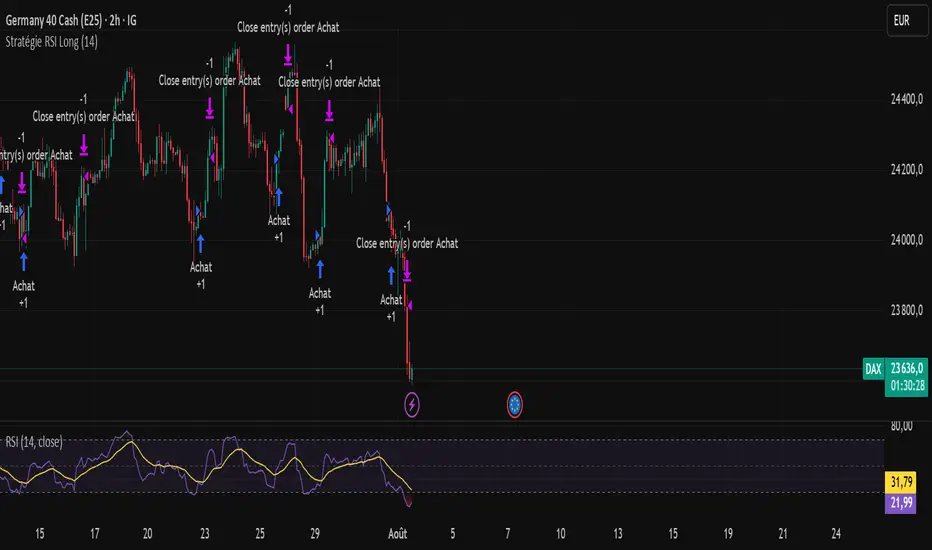
RSI Strategy - Long Position DAX 2 hours - Dow Jones 1 hourLong position strategy based on the RSI.Works very well on the DAX 40 (2-hour base) and the DOW (1-hour base).The entry signal is very good. The exit signal (take profit) needs to be reviewed.
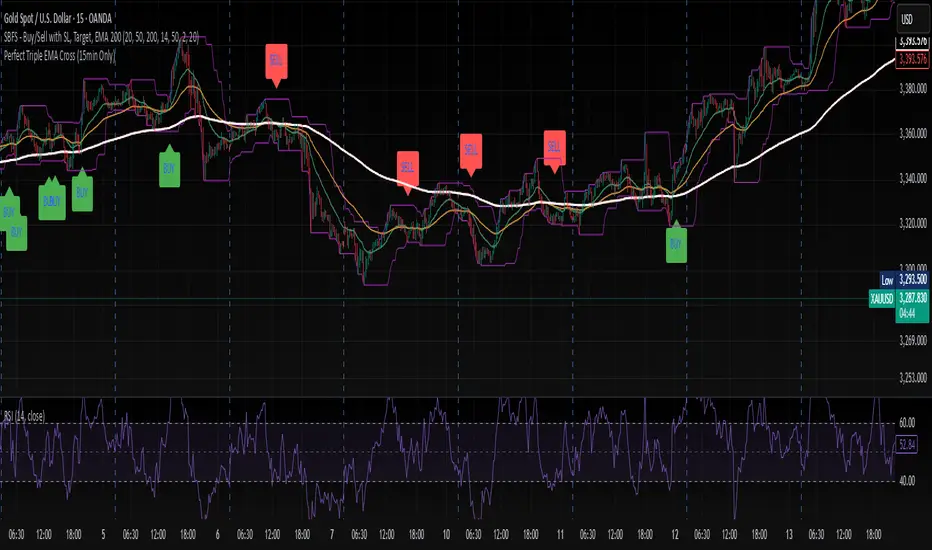
Perfect Triple EMA Cross (15min Only)//@version=5
indicator("Perfect Triple EMA Cross (15min Only)", overlay=true)
// ==== Inputs ====
ema20 = ta.ema(close, 20)
ema50 = ta.ema(close, 50)
ema200 = ta.ema(close, 200)
// ==== Timeframe Check ====
is15min = (timeframe.period == "15")
// ==== Conditions ====
buyCond = is15min and ta.crossover(ema20, ema50) and ema20 > ema50 and ema50 > ema200
sellCond = is15min and ta.crossunder(ema20, ema50) and ema20 < ema50 and ema50 < ema200
// ==== Plots ====
plot(ema20, title="EMA 20", color=color.orange, linewidth=1)
plot(ema50, title="EMA 50", color=color.blue, linewidth=1)
plot(ema200, title="EMA 200", color=color.red, linewidth=2)
plotshape(buyCond, title="BUY", location=location.belowbar, style=shape.labelup, color=color.green, size=size.normal, text="BUY")
plotshape(sellCond, title="SELL", location=location.abovebar, style=shape.labeldown, color=color.red, size=size.normal, text="SELL")
// ==== Alerts ====
alertcondition(buyCond, title="BUY Signal", message="Triple EMA BUY Signal (15min)")
alertcondition(sellCond, title="SELL Signal", message="Triple EMA SELL Signal (15min)")
Kaufman Efficiency Ratio (Directional)Kaufman Indicator with negative and positive, i use 30 and negative 30 as trend indicators, some can use it as counter trend...a lot of other kaufman efficiency indicators are only at the positive level so even a short trend has a positive 30 value can be confusing.

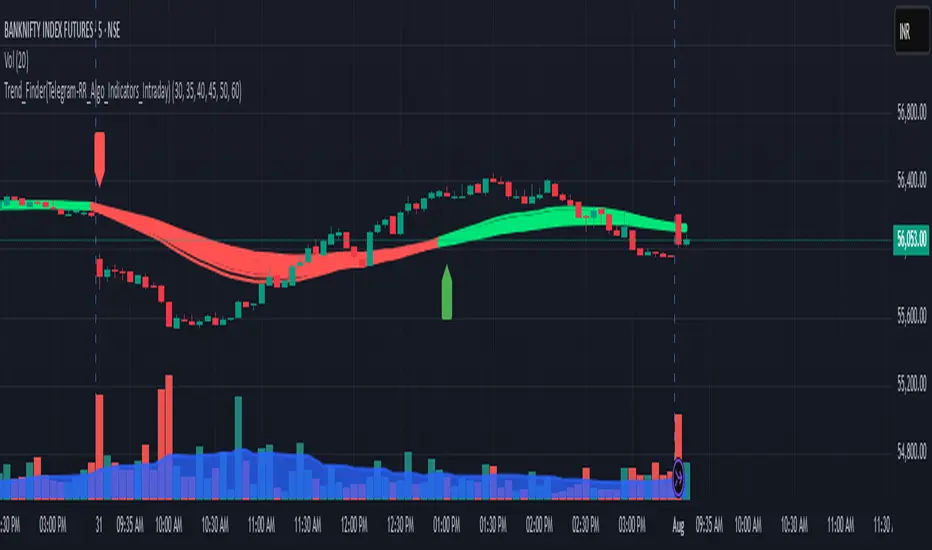
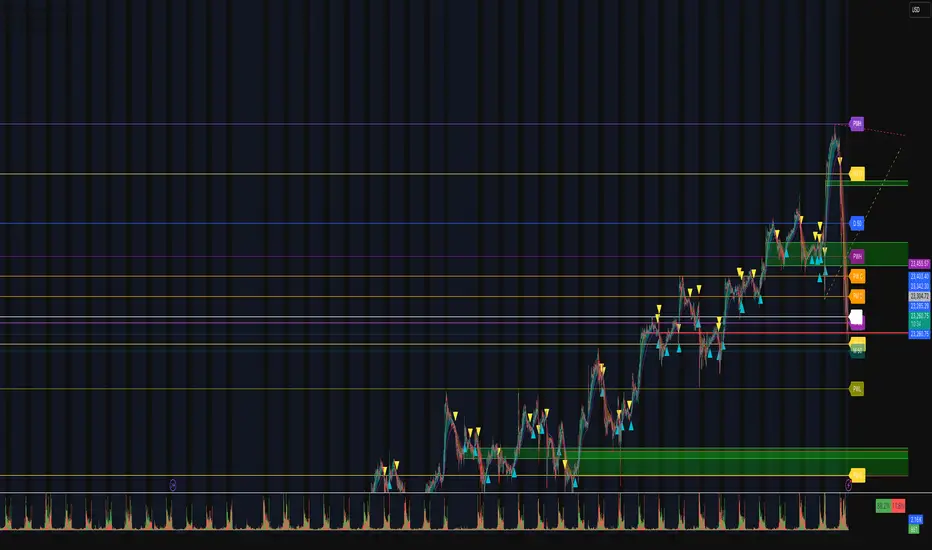
Trend_Finder(Telegram-RR_Algo_Indicators_Intraday)EMA Inputs
It uses 6 EMAs with customizable lengths (defaults: 30, 35, 40, 45, 50, 60).
Trend Conditions
Bullish Trend: All EMAs are strictly ordered from smallest to largest, meaning short-term prices are leading long-term prices upward.
Bearish Trend: All EMAs are ordered from largest to smallest, meaning short-term prices are falling below long-term ones.
Neutral: EMAs are mixed and do not meet the above criteria.
Trend Tracking
The script remembers the current trend and only flips when a full trend reversal condition is confirmed.
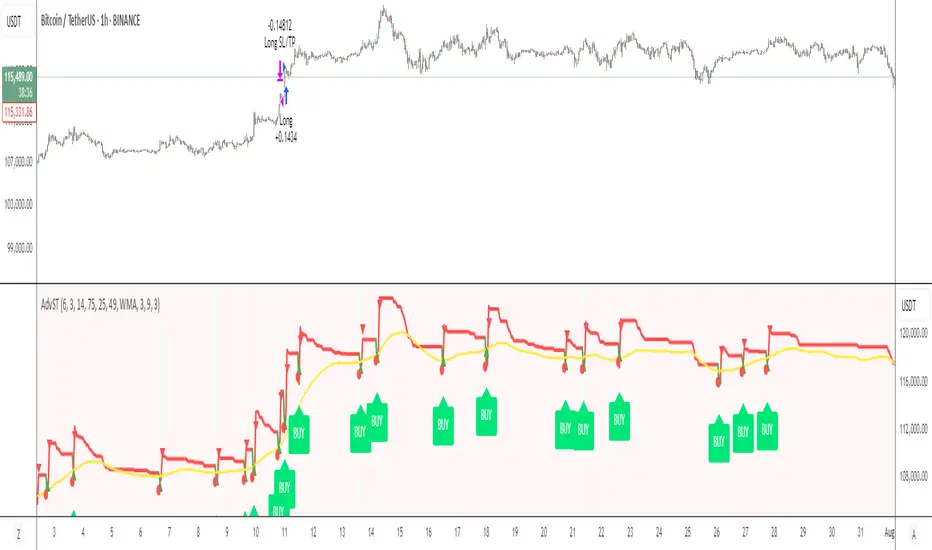
Advanced Supertrend StrategyA comprehensive Pine Script v5 strategy featuring an enhanced Supertrend indicator with multiple technical filters, risk management, and advanced signal confirmation for automated trading on TradingView.
## Features
- **Enhanced Supertrend**: Configurable ATR-based trend following with improved accuracy
- **RSI Filter**: Optional RSI-based signal filtering to avoid overbought/oversold conditions
- **Moving Average Filter**: Trend confirmation using SMA/EMA/WMA with customizable periods
- **Risk Management**: Built-in stop-loss and take-profit based on ATR multiples
- **Trend Strength Analysis**: Filters weak signals by requiring minimum trend duration
- **Breakout Confirmation**: Optional price breakout validation for stronger signals
- **Visual Interface**: Comprehensive chart plotting with multiple indicator overlays
- **Advanced Alerts**: Multiple alert conditions with detailed signal information
- **Backtesting**: Full strategy backtesting with commission and realistic execution
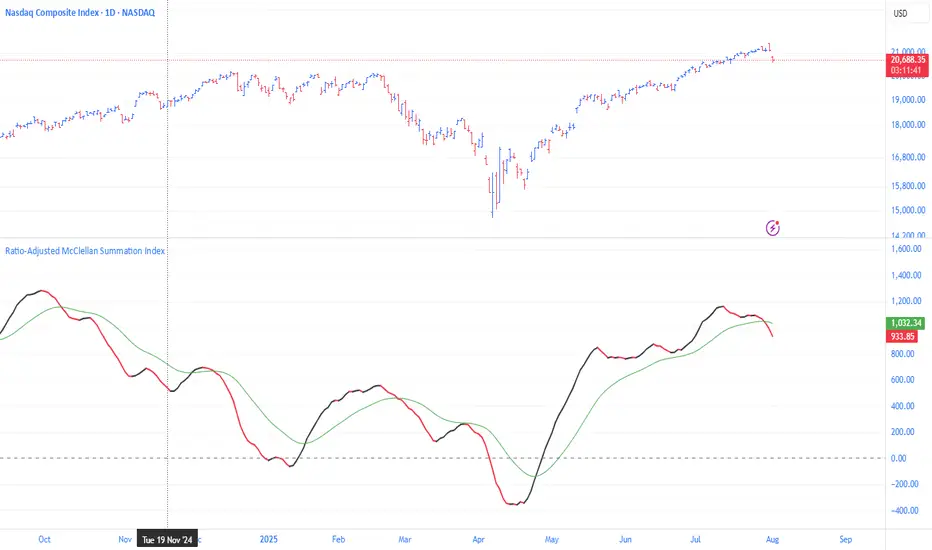
Ratio-Adjusted McClellan Summation Index RASI NASIRatio-Adjusted McClellan Summation Index (RASI NASI)
In Book "The Complete Guide to Market Breadth Indicators" Author Gregory L. Morris states
"It is the author’s opinion that the McClellan indicators, and in particular, the McClellan Summation Index, is the single best breadth indicator available. If you had to pick just one, this would be it."
What It Does: The Ratio-Adjusted McClellan Summation Index (RASI) is a market breadth indicator that tracks the cumulative strength of advancing versus declining issues for a user-selected exchange (NASDAQ, NYSE, or AMEX). Derived from the McClellan Oscillator, it calculates ratio-adjusted net advances, applies 19-day and 39-day EMAs, and sums the oscillator values to produce the RASI. This indicator helps traders assess market health, identify bullish or bearish trends, and detect potential reversals through divergences.
Key features:
Exchange Selection : Choose NASDAQ (USI:ADVN.NQ, USI:DECL.NQ), NYSE (USI:ADVN.NY, USI:DECL.NY), or AMEX (USI:ADVN.AM, USI:DECL.AM) data.
Trend-Based Coloring : RASI line displays user-defined colors (default: black for uptrend, red for downtrend) based on its direction.
Customizable Moving Average: Add a moving average (SMA, EMA, WMA, VWMA, or RMA) with user-defined length and color (default: EMA, 21, green).
Neutral Line at Zero: Marks the neutral level for trend interpretation.
Alerts: Six custom alert conditions for trend changes, MA crosses, and zero-line crosses.
How to Use
Add to Chart: Apply the indicator to any TradingView chart. Ensure access to advancing and declining issues data for the selected exchange.
Select Exchange: Choose NASDAQ, NYSE, or AMEX in the input settings.
Customize Settings: Adjust EMA lengths, RASI colors, MA type, length, and color to match your trading style.
Interpret the Indicator :
RASI Line: Black (default) indicates an uptrend (RASI rising); red indicates a downtrend (RASI falling).
Above Zero: Suggests bullish market breadth (more advancing issues).
Below Zero : Indicates bearish breadth (more declining issues).
MA Crosses: RASI crossing above its MA signals bullish momentum; crossing below signals bearish momentum.
Divergences: Compare RASI with the market index (e.g., NASDAQ Composite) to identify potential reversals.
Large Moves : A +3,600-point move from a low (e.g., -1,550 to +1,950) may signal a significant bull run.
Set Alerts:
Add the indicator to your chart, open the TradingView alert panel, and select from six conditions (see Alerts section).
Configure notifications (e.g., email, webhook, or popup) for each condition.
Settings
Market Selection:
Exchange: Select NASDAQ, NYSE, or AMEX for advancing/declining issues data.
EMA Settings:
19-day EMA Length: Period for the shorter EMA (default: 19).
39-day EMA Length: Period for the longer EMA (default: 39).
RASI Settings:
RASI Uptrend Color: Color for rising RASI (default: black).
RASI Downtrend Color: Color for falling RASI (default: red).
RASI MA Settings:
MA Type: Choose SMA, EMA, WMA, VWMA, or RMA (default: EMA).
MA Length: Set the MA period (default: 21).
MA Color: Color for the MA line (default: green).
Alerts
The indicator uses alertcondition() to create custom alerts. Available conditions:
RASI Trend Up: RASI starts rising (based on RASI > previous RASI, shown as black line).
RASI Trend Down: RASI starts falling (based on RASI ≤ previous RASI, shown as red line).
RASI Above MA: RASI crosses above its moving average.
RASI Below MA: RASI crosses below its moving average.
RASI Bullish: RASI crosses above zero (bullish market breadth).
RASI Bearish: RASI crosses below zero (bearish market breadth).
To set alerts, add the indicator to your chart, open the TradingView alert panel, and select the desired condition.
Notes
Data Requirements: Requires access to advancing/declining issues data (e.g., USI:ADVN.NQ, USI:DECL.NQ for NASDAQ). Some symbols may require a TradingView premium subscription.
Limitations: RASI is a medium- to long-term indicator and may lag in volatile or range-bound markets. Use alongside other technical tools for confirmation.
Data Reliability : Verify the selected exchange’s data accuracy, as inconsistencies can affect results.
Debugging: If no data appears, check symbol validity (e.g., try $ADVN/Q, $DECN/Q for NASDAQ) or contact TradingView support.
Credits
Based on the Ratio-Adjusted McClellan Summation Index methodology by McClellan Financial Publications. No external code was used; the implementation is original, inspired by standard market breadth concepts.
Disclaimer
This indicator is for informational purposes only and does not constitute financial advice. Past performance is not indicative of future results. Conduct your own research and combine with other tools for informed trading decisions.
Gracias mi Dios Sammy IndicadorNASDAQ:QQQ //@version=5
indicator("Gracias mi Dios Sammy Indicador", overlay=true, max_labels_count=500)
// Cálculo de condiciones de velas
isBullish = close > open
isBearish = close < open
prevBullish = close > open
prevBearish = close < open
// Patrón Alcista (A): vela verde envuelve completamente a la roja previa
bullishEngulfing = isBullish and prevBearish and close > open and open < close
// Patrón Bajista (B): vela roja envuelve completamente a la verde previa
bearishEngulfing = isBearish and prevBullish and close < open and open > close
// Marcar con “A” (alcista) y “B” (bajista)
plotshape(bullishEngulfing, title="Alcista", style=shape.labelup, color=color.green, text="A", size=size.tiny, location=location.belowbar, textcolor=color.white)
plotshape(bearishEngulfing, title="Bajista", style=shape.labeldown, color=color.red, text="B", size=size.tiny, location=location.abovebar, textcolor=color.white)
// Alertas
alertcondition(bullishEngulfing, title="Alerta Alcista", message="Patrón Alcista (A) detectado")
alertcondition(bearishEngulfing, title="Alerta Bajista", message="Patrón Bajista (B) detectado")

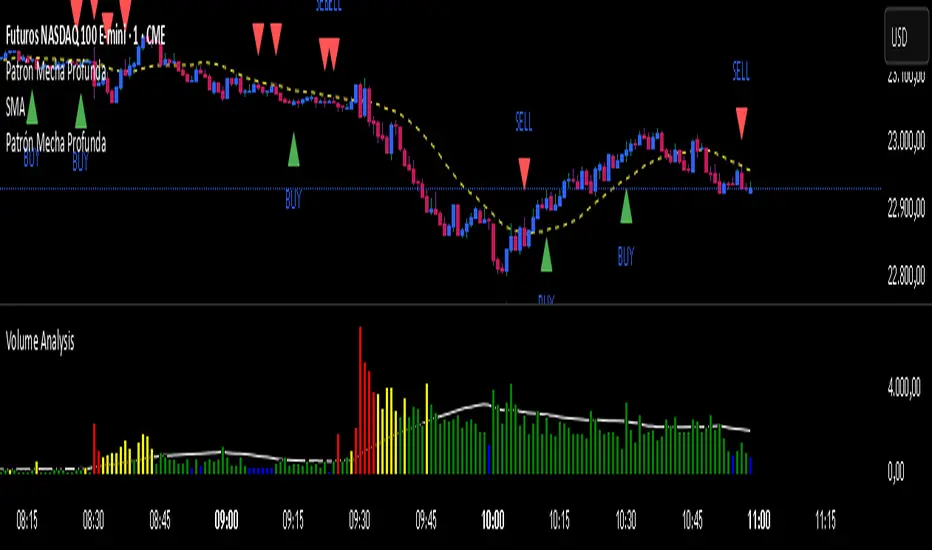
Patrón Mecha ProfundaThis pattern must be combined with a 20-period moving average. It is used to know the direction of the price. When the pattern appears and the price is above the 20-period moving average, it is a bullish signal and vice versa.
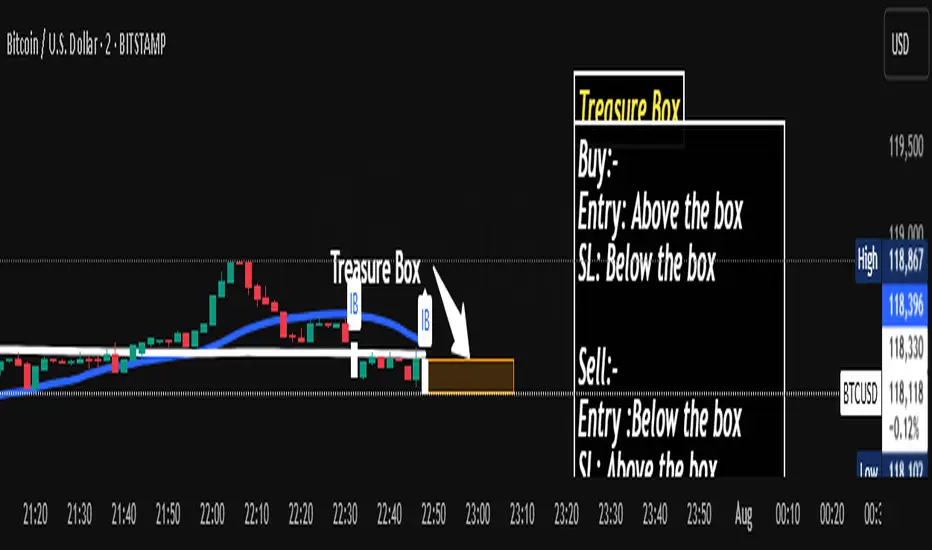
Wx2 Treasure Box – Institutional EntryBuy:-
Entry: Above the box
SL: Below the box
Sell:-
Entry :Below the box
SL: Above the box
RRR: 1:2
Best Location near 200MA
TF: Any TF
Watch My Video:
youtu.be
Auto AVWAP (Anchored-VWAP) with Breakout ScreenerAuto AVWAP (Anchored-VWAP) with Breakout Screener. fINAL VERSION

H1/L1 Trap MarkerH1 L1 Trap Marker based on Al Brooks PA
You can use it to detect trap traders and help determine your trade.

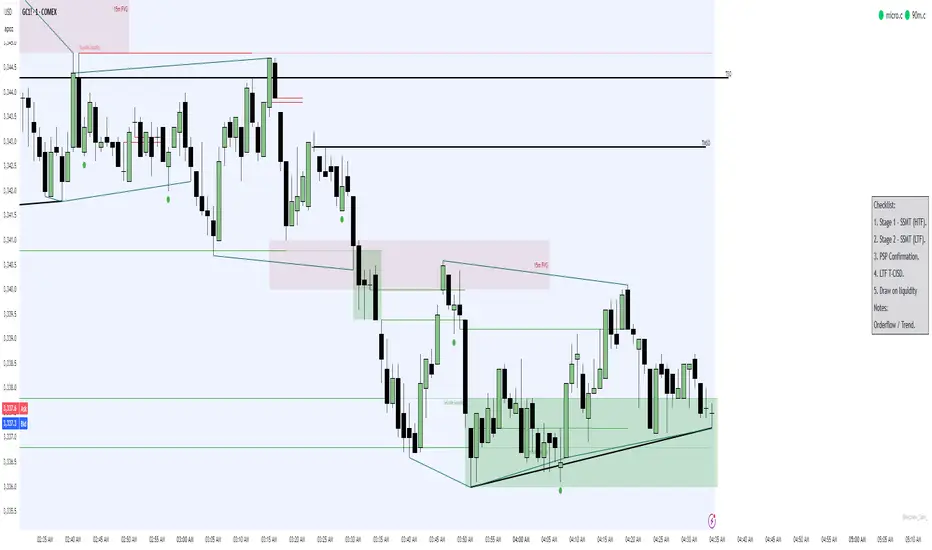
Simple Trading ChecklistCustomisable Simple Trading Checklist
This script overlays a fully customizable trading checklist directly onto your chart, providing an at-a-glance reminder of key trading steps and conditions before entering a position.
It is especially useful for discretionary or rule-based traders who want a consistent on-screen process to follow.
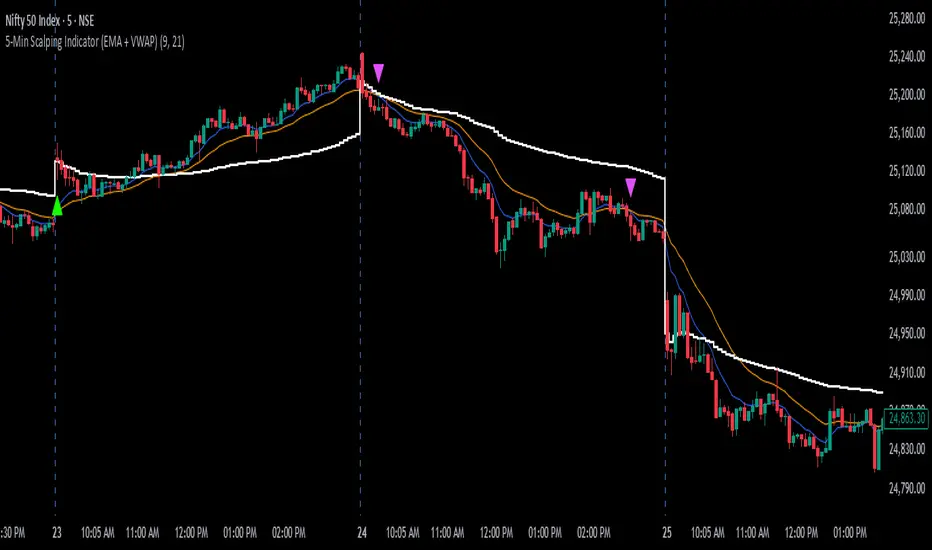
5-Min Scalping Indicator (EMA + VWAP)5-Min Scalping Indicator (EMA + VWAP)
Strategy Logic (for 5-min timeframe):
Long Entry: Price above VWAP, EMA Fast crosses above EMA Slow.
Short Entry: Price below VWAP, EMA Fast crosses below EMA Slow.
Exit: On opposite EMA cross or trailing stop (optional for strategy).
How to Use:
Apply this on a 5-minute chart.
Look for buy signals when:
Fast EMA crosses above Slow EMA.
Price is above VWAP.
Look for sell signals when:
Fast EMA crosses below Slow EMA.
Price is below VWAP.
Combine with price action or volume confirmation for best results.
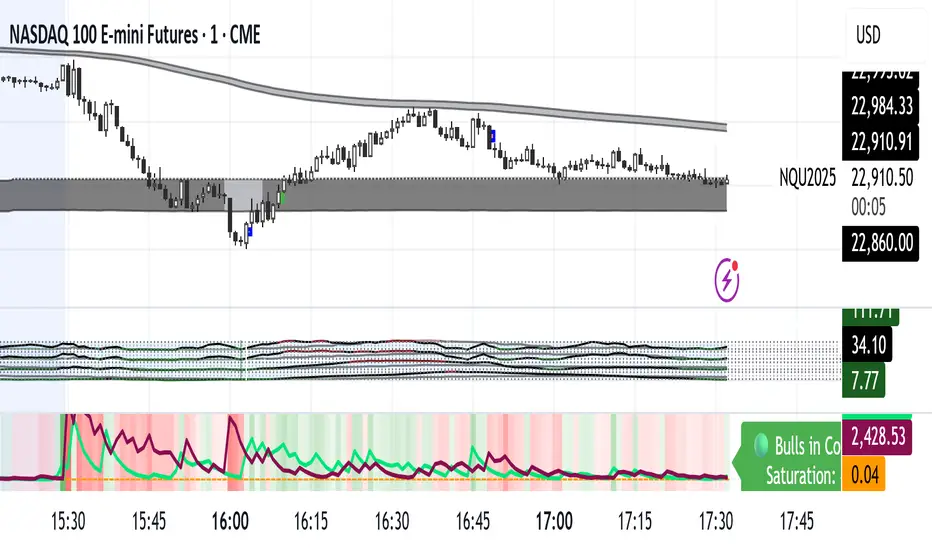
Market Energy – Trend vs Retest (with Saturation %)Market Energy – Trend vs Retest Indicator
This indicator measures the bullish and bearish energy in the market based on volume-weighted price changes.
It calculates two smoothed energy waves — bullish energy and bearish energy — using exponential moving averages of volume-adjusted price movements.
The indicator detects trend changes and retests by comparing the relative strength of these waves.
A saturation percentage quantifies the intensity of the current dominant side (bulls or bears) relative to recent highs.
- High saturation (>70%) indicates strong momentum and dominance by bulls or bears.
- Low saturation (<30%) suggests weak momentum and possible market indecision or consolidation.
The background color highlights the current control: green for bulls, red for bears, with transparency indicating the saturation level.
A label shows which side is currently in control along with the saturation percentage for quick interpretation.
Use this tool to identify strong trends, possible retests, and momentum strength to support your trading decisions.
KILLZONE INDIWhy Use the "KILLZONE INDI" Indicator?
Are you looking for a reliable tool to enhance your gold trading strategy?
Introducing "KILLZONE INDI", a smart and easy-to-use indicator specifically designed to help traders make informed decisions in the gold market.
What Makes "KILLZONE INDI" Stand Out?
* Tailored for Gold (XAUUSD):
Specially optimized to detect crucial trend changes in gold prices, offering you timely signals to buy or sell.
* Precise Entry Points:
Uses smart moving average crossovers to identify the best moments for entry and exit, reducing guessing and improving profitability.
* Real-Time Alerts:
Get instant notifications when buy or sell signals occur—whether you're at your desk or on the go. Never miss a critical trading opportunity again!
* Easy to Use:
Clear visual signals on your chart show exactly when the market is favorable, perfect for both beginners and experienced traders.
* Ideal for Short-Term Trading:
Designed to generate signals on 1-minute charts, helping you capitalize on quick market movements in the fast-paced gold market.
Why Trader's Love It:
* Increase Confidence:
Making trade decisions becomes easier with accurate signals specific to gold trends.
* Save Time:
Automate your analysis—spend less time guessing and more time trading confidently.
* Maximize Profits:
Spot those crucial moments when the price movement is about to turn, giving you a competitive edge.
Start Using "KILLZONE INDI" Today!
Whether you're looking to refine your short-term trading strategy or want a trustworthy tool to guide your trades in gold markets, "KILLZONE INDI" is the perfect addition to your trading arsenal. Try it now and watch your trading confidence and results improve!

TFO + ADX with Histogram & SignalTrend Flow Oscillator (TFO + ADX) – Histogram + Signal
This version of the original TFO+ADX introduces a MACD-style histogram and signal line overlay for clearer momentum and trend visualization.
The Trend Flow Oscillator (TFO+ADX) blends two powerful volume-based tools — the Money Flow Index (MFI) and Chaikin Money Flow (CMF) — along with a normalized Average Directional Index (ADX). The result is a comprehensive momentum and trend strength tool that offers a more precise read on when markets are gaining or losing conviction.
⸻
How It Works
1.Money Flow Index (MFI)
• Measures volume-weighted buying/selling pressure using price and volume.
• Scaled between –1 and +1 for visual clarity.
2.Chaikin Money Flow (CMF)
• Evaluates volume distribution over time — institutional buying (accumulation) or selling (distribution).
• Also scaled between –1 and +1.
3.TFO Composite Line
• Combines MFI and CMF into a single flow reading.
• A signal line (EMA) tracks the trend of this flow.
• A histogram plots the difference between the TFO and its signal, giving clear signals on shifts in momentum.
4.Normalized ADX Overlay
• Shows trend strength on the same scale (–1 to +1).
• ADX > 0 indicates strong trending conditions.
• ADX < 0 signals weak or consolidating conditions.
⸻
Visual Interpretation
1. Histogram Bars
• Green: TFO is above the signal line → bullish momentum accelerating
• Red: TFO is below the signal line → bearish momentum building
• Bar height represents the strength of the momentum shift
2. Signal Line
• Tracks the smoothed trend of the TFO composite
• Histogram crossing above or below zero reflects momentum crossover and can act as entry or exit signals
3. TFO Raw Line (Optional)
• Still available for reference alongside the histogram
• Shows the unsmoothed blended money flow direction (MFI + CMF)
4. Extreme Zones
• Background shading appears when TFO exceeds ±1.0
• Helps highlight areas of stretched or unsustainable momentum, useful for spotting potential reversals or exhaustion

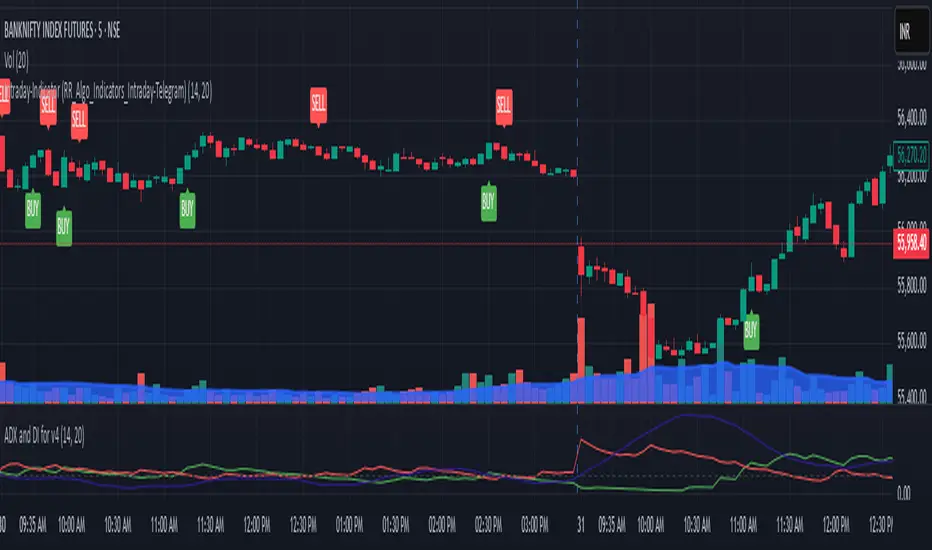
Buy/Sell Labels-RR_AlgoAI (Telegram-RR_Algo_Indicators_Intraday)This indicator uses the Trend Movement to identify shifts in market trend. When the positive movement crosses above the negative, it signals a potential bullish move and marks the chart with a "BUY" label along with a green trend line from the candle's low. Conversely, when Negative movement crosses above Positive Movement, it signals bearish potential, showing a "SELL" label and a red trend line from the candle's high. It also plots the smoothed difference between to show trend strength.
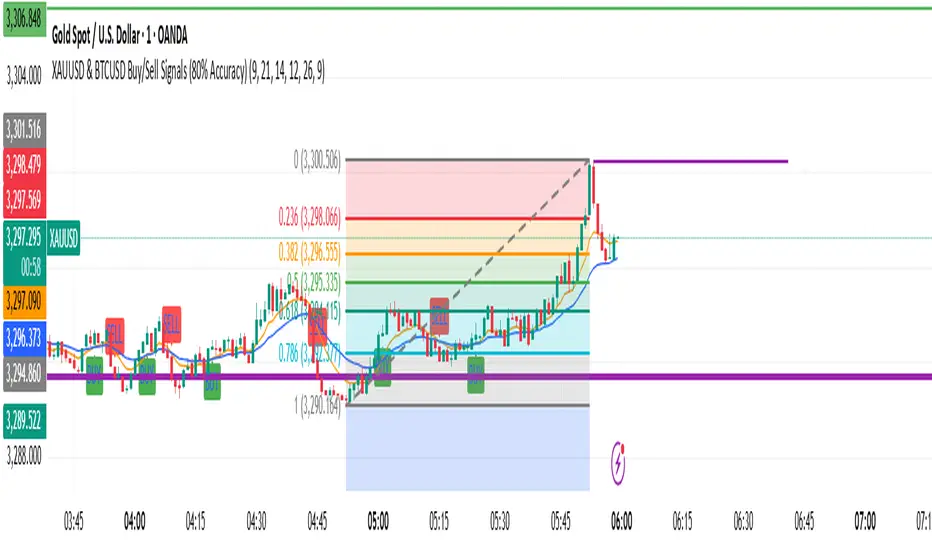
XAUUSD & BTCUSD Buy/Sell Signals (80% Accuracy)this script gives approx 80% real and correct indicators depending on market
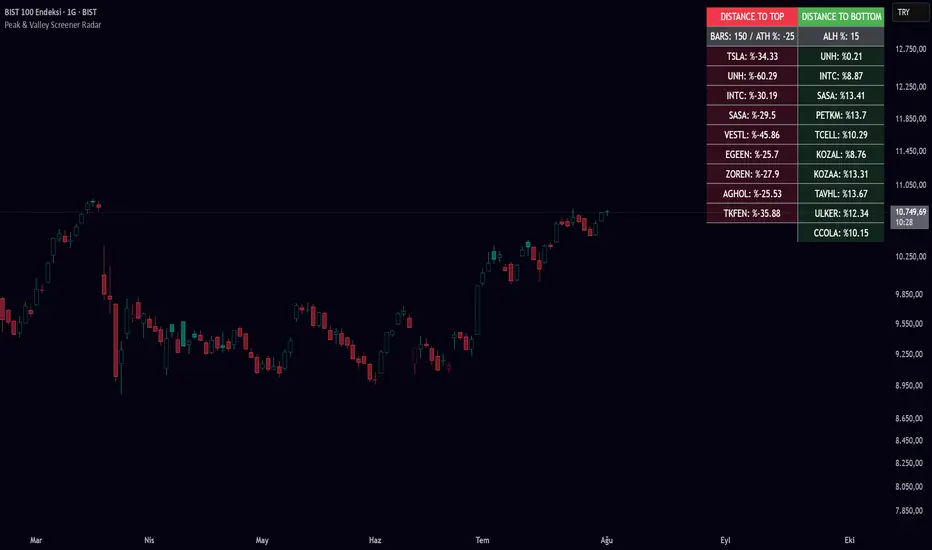
Peak & Valley Screener RadarThis Pine Script indicator is designed to help traders and investors analyze the percentage distance of stock prices from their recent All-Time High (ATH) and All-Time Low (ALH) over a user-defined number of bars.
It functions as a multi-stock screener, scanning a customizable list of stocks (default: 40 BIST 500 stocks) and displaying results in a dynamic table on the chart.
The script identifies stocks that have pulled back more than a specified percentage from their ATH (potential buying opportunities) or risen less than a specified percentage from their ALH (potential caution zones).
Key Features:
Customizable Stock List: Users can input a comma-separated list of stock tickers (e.g., "AAPL,GOOGL,MSFT") to scan any symbols available on TradingView.
User-Defined Parameters: Adjust the lookback period (bars back, default 250), ATH pullback threshold (default 10%), and ALH rise threshold (default 10%).
Dynamic Table Display: Results are shown in a table with two columns: "Distance to TOP" (ATH pullbacks in red) and "Distance to BOTTOM" (ALH rises in green). The table includes input parameters for quick reference and can be positioned anywhere on the chart (top/bottom left/center/right).
Optional Plots: Toggle plots to visualize the percentage distances for the current chart symbol (red for ATH, green for ALH).
Efficient Data Handling: Uses request.security with tuples for optimized multi-symbol data fetching, supporting up to ~80 stocks without exceeding Pine Script limits (adjust table rows if needed for more).
Real-Time Updates: The table updates only on the last bar for performance efficiency.
How It Works:
The script calculates the highest high and lowest low over the specified bars for each stock.
It computes the percentage difference from the current close: negative for ATH (pullback) and positive for ALH (rise).
Stocks meeting the thresholds are listed in the table with their exact percentages.
Usage Tips:
Apply this indicator to any chart (e.g., a BIST index or stock) to run the screener in the background.
Ideal for swing traders scanning for undervalued stocks near ATH or overbought near ALH.
Note: Performance may vary with large stock lists due to TradingView's security call limits (~40-50 calls per script). Test with smaller lists if needed.
You can bypass the 40-stock limit by adding the indicator twice to the chart, entering 40 different stocks in the second indicator and setting a different table position from the first one, allowing you to scan 80 stocks simultaneously. In fact, this way, you can scan as many stocks as your plan's limits allow.
This script is released under the Mozilla Public License 2.0. Feedback and suggestions are welcome, but please adhere to TradingView's House Rules—no guarantees of profitability, use at your own risk.Disclaimer: This is not financial advice. Past performance does not predict future results. Always conduct your own research.
Midnight OpenMidnight Opening Price because there wasn't a single indicator that was specifically marking this.
