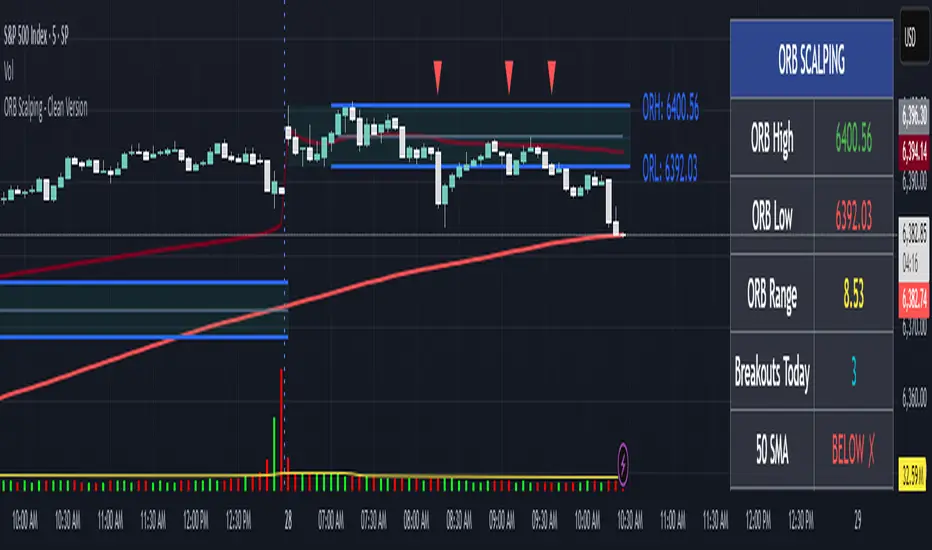
ORB Scalping## Key Features 🎯
Customizable Opening Range: Define the ORB using a specific timeframe (e.g., the first 15, 30, or 60 minutes) or a custom time session (e.g., '09:30-10:00'), making it adaptable to any market (Forex, Crypto, Stocks, Indices).
Clear Visualizations: The opening range is highlighted with a colored box. The high, low, and midline are automatically drawn and extended throughout the trading day, acting as key support and resistance levels.
Real-time Breakout Signals: The script plots a '▲' for a bullish breakout (close crosses above the ORB high) and a '▼' for a bearish breakout (close crosses below the ORB low). The appearance and position of these signals are fully customizable.
ORB Bias Indicator: The ORB box is automatically colored to indicate market sentiment.
Bullish (Green): The current ORB midline is higher than the previous day's midline, suggesting upward momentum.
Bearish (Red): The current ORB midline is lower than the previous day's midline, suggesting downward momentum.
Neutral (Blue): The midline is unchanged or it's the first session on the chart.
Comprehensive Dashboard: An elegant, on-screen table provides all critical information at a glance, including:
ORB High, Low, and Range values.
A count of breakouts for the current day.
The current price's position relative to key moving averages (50, 100, 200 SMA) and VWAP.
The current price and its status relative to the ORB levels.
The daily ORB Bias (Bullish/Bearish).
Built-in Alerts: Never miss a trading opportunity. You can set up alerts that will trigger whenever the price breaks above the ORB high or below the ORB low.
## How to Use 📈
Setup the Opening Range: Go to the indicator settings.
For time-based ORB: Choose the ORB Timeframe (e.g., '30' for the first 30 minutes). Ensure Use ORB Session Time is unchecked.
For session-based ORB: Check Use ORB Session Time and enter your desired ORB Session Time (e.g., 0930-1000). This is ideal for markets with specific opening hours like the NYSE or NSE.
Wait for the Range to Form: The script will draw the ORB box and levels after the defined opening period ends. No trades should be taken while the range is still forming.
Identify a Trading Opportunity:
Long Entry: Look for a bullish breakout signal (▲) when the price closes decisively above the ORB High. For higher probability, check the dashboard for confluence: Is the price also above the VWAP and key SMAs? Is the ORB Bias bullish?
Short Entry: Look for a bearish breakout signal (▼) when the price closes decisively below the ORB Low. For higher probability, check if the price is below the VWAP/SMAs and if the ORB Bias is bearish.
Manage Your Risk:
The ORB levels themselves are excellent reference points for risk management.
For a long trade, a stop-loss could be placed below the breakout candle, at the ORB High line, or at the ORB Midline, depending on your risk tolerance.
For a short trade, a stop-loss could be placed above the breakout candle, at the ORB Low line, or at the ORB Midline.
## Settings Overview
ORB Settings: This is the most important section. Configure your ORB period here. You can also toggle the visibility of the ORB Box, High/Low lines, and the Midline.
Triangle Settings: Customize the size, color, and position of the breakout signals. The 'On ORB Lines' position offers a cleaner, LuxAlgo-inspired visual style.
Visual Settings: Change the colors of the ORB lines and box fills to match your personal chart theme.
Dashboard: Toggle the dashboard on/off, change its position on the screen, and adjust the font size for better readability.
Historical Display: Choose whether to keep previous days' ORB visuals on the chart for historical context or to only display the current day's ORB.
Disclaimer: This indicator is a tool to aid in technical analysis and should not be considered financial advice. Trading involves substantial risk. Always use proper risk management and combine this tool with your own trading strategy and analysis.
Indicators and strategies
Givemepeace EMA + Market Structure//@version=6
indicator("Givemepeace EMA + Market Structure", overlay=true, max_lines_count=20, max_labels_count=50)
//Settings
length = input.int(21, "Swing Length", minval=5, maxval=50)
ema_length = input.int(55, "EMA Length", minval=1)
show_ema = input.bool(true, "Show EMA Lines")
show_swing = input.bool(true, "Show Swing Points")
show_fibo = input.bool(true, "Show Fibonacci Levels")
show_weekly = input.bool(true, "Show Weekly Levels")
show_monday = input.bool(true, "Show Monday High/Low")
show_prev_weekly = input.bool(true, "Show Previous Weekly Levels")
//Style
swinghCss = input.color(color.red, 'Swing High Color', group = 'Style')
swinglCss = input.color(color.teal, 'Swing Low Color', group = 'Style')
// EMA Lines
ema_15m = request.security(syminfo.tickerid, "15", ta.ema(close, ema_length))
ema_1h = request.security(syminfo.tickerid, "60", ta.ema(close, ema_length))
ema_4h = request.security(syminfo.tickerid, "240", ta.ema(close, ema_length))
// Plot EMA lines
plot(show_ema ? ema_15m : na, title="EMA 15m", color=color.purple, linewidth=1)
plot(show_ema ? ema_1h : na, title="EMA 1H", color=color.blue, linewidth=2)
plot(show_ema ? ema_4h : na, title="EMA 4H", color=color.red, linewidth=3)
// Weekly Levels
weekly_open = request.security(syminfo.tickerid, "1W", open, lookahead=barmerge.lookahead_on)
prev_weekly_open = request.security(syminfo.tickerid, "1W", open , lookahead=barmerge.lookahead_on)
prev_weekly_high = request.security(syminfo.tickerid, "1W", high , lookahead=barmerge.lookahead_on)
prev_weekly_low = request.security(syminfo.tickerid, "1W", low , lookahead=barmerge.lookahead_on)
// Monday High/Low (first day of week)
is_monday = dayofweek == dayofweek.monday
var float monday_high = na
var float monday_low = na
if is_monday and na(monday_high )
monday_high := high
monday_low := low
else if is_monday
monday_high := math.max(monday_high, high)
monday_low := math.min(monday_low, low)
// Reset Monday levels on new week
if ta.change(time("1W")) != 0
monday_high := na
monday_low := na
// Draw horizontal lines with labels (only latest ones)
var line wo_line = na
var line mh_line = na
var line ml_line = na
var line pwo_line = na
var line pwh_line = na
var line pwl_line = na
var label wo_label = na
var label mh_label = na
var label ml_label = na
var label pwo_label = na
var label pwh_label = na
var label pwl_label = na
if show_weekly and not na(weekly_open) and barstate.islast
if not na(wo_line)
line.delete(wo_line)
label.delete(wo_label)
wo_line := line.new(bar_index, weekly_open, bar_index + 10, weekly_open, color=color.black, width=1, style=line.style_solid)
wo_label := label.new(bar_index + 10, weekly_open, "WO", style=label.style_none, color=color(na), textcolor=color.black, size=size.small)
if show_monday and not na(monday_high) and barstate.islast
if not na(mh_line)
line.delete(mh_line)
label.delete(mh_label)
mh_line := line.new(bar_index, monday_high, bar_index + 10, monday_high, color=color.red, width=1, style=line.style_solid)
mh_label := label.new(bar_index + 10, monday_high, "MH", style=label.style_none, color=color(na), textcolor=color.red, size=size.small)
if show_monday and not na(monday_low) and barstate.islast
if not na(ml_line)
line.delete(ml_line)
label.delete(ml_label)
ml_line := line.new(bar_index, monday_low, bar_index + 10, monday_low, color=color.red, width=1, style=line.style_solid)
ml_label := label.new(bar_index + 10, monday_low, "ML", style=label.style_none, color=color(na), textcolor=color.red, size=size.small)
// Previous Weekly Levels
if show_prev_weekly and not na(prev_weekly_open) and barstate.islast
if not na(pwo_line)
line.delete(pwo_line)
label.delete(pwo_label)
pwo_line := line.new(bar_index, prev_weekly_open, bar_index + 10, prev_weekly_open, color=color.gray, width=1, style=line.style_dashed)
pwo_label := label.new(bar_index + 10, prev_weekly_open, "PWO", style=label.style_none, color=color(na), textcolor=color.gray, size=size.small)
if show_prev_weekly and not na(prev_weekly_high) and barstate.islast
if not na(pwh_line)
line.delete(pwh_line)
label.delete(pwh_label)
pwh_line := line.new(bar_index, prev_weekly_high, bar_index + 10, prev_weekly_high, color=color.gray, width=1, style=line.style_dashed)
pwh_label := label.new(bar_index + 10, prev_weekly_high, "PWH", style=label.style_none, color=color(na), textcolor=color.gray, size=size.small)
if show_prev_weekly and not na(prev_weekly_low) and barstate.islast
if not na(pwl_line)
line.delete(pwl_line)
label.delete(pwl_label)
pwl_line := line.new(bar_index, prev_weekly_low, bar_index + 10, prev_weekly_low, color=color.gray, width=1, style=line.style_dashed)
pwl_label := label.new(bar_index + 10, prev_weekly_low, "PWL", style=label.style_none, color=color(na), textcolor=color.gray, size=size.small)
// Swing Detection (LuxAlgo style)
var float phy = na // Previous high
var float ply = na // Previous low
var float last_hh = na // Last Higher High
var float last_hl = na // Last Higher Low
var int last_hh_bar = na
var int last_hl_bar = na
ph = ta.pivothigh(length, length)
pl = ta.pivotlow(length, length)
n = bar_index
// Process Swing Highs
if not na(ph)
H = ph > phy ? 'HH' : 'LH'
if show_swing
label.new(n , ph, H, color = color(na), style = label.style_label_down, textcolor = swinghCss, size = size.normal)
// Track HH for Fibonacci
if H == 'HH'
last_hh := ph
last_hh_bar := n
phy := ph
// Process Swing Lows
if not na(pl)
L = pl < ply ? 'LL' : 'HL'
if show_swing
label.new(n , pl, L, color = color(na), style = label.style_label_up, textcolor = swinglCss, size = size.normal)
// Track HL and draw Fibonacci from last HH to this HL
if L == 'HL' and show_fibo and not na(last_hh)
last_hl := pl
last_hl_bar := n
// Calculate Fibonacci levels from HH to HL
swing_range = last_hh - last_hl
fib_236 = last_hl + (swing_range * 0.236)
fib_382 = last_hl + (swing_range * 0.382)
fib_500 = last_hl + (swing_range * 0.500)
fib_618 = last_hl + (swing_range * 0.618)
fib_705 = last_hl + (swing_range * 0.705)
fib_786 = last_hl + (swing_range * 0.786)
// Draw Fibonacci lines from HH to future
start_bar = last_hh_bar
end_bar = bar_index + 30
// Draw key Fibonacci levels
line.new(start_bar, fib_236, end_bar, fib_236, color=color.gray, width=1, style=line.style_dotted)
line.new(start_bar, fib_382, end_bar, fib_382, color=color.blue, width=1, style=line.style_dashed)
line.new(start_bar, fib_500, end_bar, fib_500, color=color.purple, width=2, style=line.style_solid)
line.new(start_bar, fib_618, end_bar, fib_618, color=color.yellow, width=2, style=line.style_dashed)
line.new(start_bar, fib_705, end_bar, fib_705, color=color.orange, width=2, style=line.style_dashed)
line.new(start_bar, fib_786, end_bar, fib_786, color=color.red, width=1, style=line.style_dashed)
// Add Fibonacci labels
label.new(end_bar - 5, fib_236, "23.6", style=label.style_label_left, color=color.gray, textcolor=color.white, size=size.small)
label.new(end_bar - 5, fib_382, "38.2", style=label.style_label_left, color=color.blue, textcolor=color.white, size=size.small)
label.new(end_bar - 5, fib_500, "50.0", style=label.style_label_left, color=color.purple, textcolor=color.white, size=size.small)
label.new(end_bar - 5, fib_618, "61.8", style=label.style_label_left, color=color.yellow, textcolor=color.black, size=size.small)
label.new(end_bar - 5, fib_705, "70.5", style=label.style_label_left, color=color.orange, textcolor=color.black, size=size.small)
label.new(end_bar - 5, fib_786, "78.6", style=label.style_label_left, color=color.red, textcolor=color.white, size=size.small)
// Add info box
if barstate.islast
var table info_table = table.new(position.top_right, 2, 5, bgcolor=color.white, border_width=1)
table.cell(info_table, 0, 0, "Last HH:", text_color=color.black, text_size=size.small)
table.cell(info_table, 1, 0, str.tostring(last_hh, '#.####'), text_color=color.red, text_size=size.small)
table.cell(info_table, 0, 1, "Last HL:", text_color=color.black, text_size=size.small)
table.cell(info_table, 1, 1, str.tostring(last_hl, '#.####'), text_color=color.teal, text_size=size.small)
table.cell(info_table, 0, 2, "Fib Range:", text_color=color.black, text_size=size.small)
table.cell(info_table, 1, 2, str.tostring(swing_range, '#.####'), text_color=color.blue, text_size=size.small)
table.cell(info_table, 0, 3, "WO:", text_color=color.black, text_size=size.small)
table.cell(info_table, 1, 3, str.tostring(weekly_open, '#.####'), text_color=color.black, text_size=size.small)
table.cell(info_table, 0, 4, "Mon H/L:", text_color=color.black, text_size=size.small)
table.cell(info_table, 1, 4, str.tostring(monday_high, '#.##') + "/" + str.tostring(monday_low, '#.##'), text_color=color.red, text_size=size.small)
ply := pl
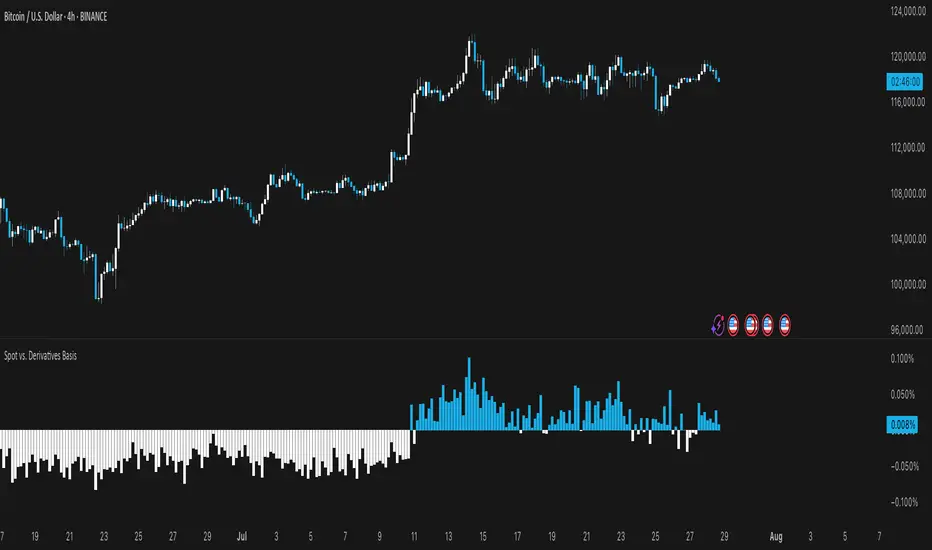
Spot vs. Derivatives BasisThis indicator calculates the basis between average spot and average perpetual futures prices across selected exchanges. It helps identify deviations between spot and perp markets — a key signal for funding pressure, arbitrage, or market dislocation.
Key Features:
Manual Pair Control – Enable or disable specific trading pairs as needed
Flexible Basis Smoothing – Apply SMA, EMA, WMA, or VWMA to filter noise
Anomaly Highlighting – Automatically flags basis deviations beyond ±0.1%
Level Master Pro+ [MMT]Level Master Pro+ Indicator
The Level Master Pro+ is a highly customizable Pine Script indicator designed for TradingView, built to plot key pivot point levels, support and resistance zones, and additional price levels such as previous close, bottom central (BC), and top central (TC) on a chart. This indicator is tailored for traders who rely on pivot-based strategies, offering flexibility in timeframe selection, visual styling, and level visibility to suit various trading styles.
Key Features:
- Pivot Point Levels:
Plots traditional pivot points (P), up to six levels of support (S1–S6) and resistance (R1–R6), previous close (PC), base control (BC), and top control (TC).
Automatically calculates R6 and S6 using the pivot range (high - low) for extended analysis.
Supports customizable timeframes for pivot calculations (default: 1D).
- Customization Options:
Pivot History : Adjust the number of historical pivots displayed (1–200).
Line Styling : Choose line width (1–10), style (solid, dashed, dotted), and transparency (0–100%).
Label Styling : Toggle labels and price values, set label position (left or right), size (tiny to huge), and background transparency.
Color Customization : Assign unique colors to each level (P, S1–S6, R1–R6, PC, BC, TC) with default settings like green for support, red for resistance, and purple for BC/TC.
Extend to Current Bar : Optionally extend pivot lines to the current bar for real-time tracking.
- Visual and Performance Optimization :
Uses an overlay to plot levels directly on the price chart.
Supports up to 500 lines and labels to prevent performance issues.
Efficiently manages historical pivot data by removing outdated graphics when the maximum pivot count is exceeded.
- Dynamic Updates :
Automatically updates pivot lines and labels when a new timeframe period begins (e.g., new day for daily pivots).
Ensures smooth rendering with real-time adjustments for extended lines and label positions.
Use Case:
The Level Master Pro+ is ideal for traders employing pivot point strategies to identify potential support and resistance zones, reversal points, or breakout levels. Its extensive customization options make it suitable for day trading, swing trading, or long-term analysis across various markets (stocks, forex, crypto, etc.).
How It Works:
Data Source : Uses request.security to fetch pivot data based on the selected timeframe.
Level Calculations: Computes traditional pivot points and derives additional levels (R6, S6, BC, TC) using high, low, and close prices from the previous period.
Rendering : Draws lines and labels for each enabled level, with options to extend lines to the current bar or anchor them to the timeframe’s end.
Memory Management : Stores pivot graphics in a matrix and removes older pivots to stay within the user-defined historical limit.
Settings Overview :
Pivot Timeframe : Set the timeframe for pivot calculations (e.g., daily, weekly).
Show Labels/Prices : Enable or disable level labels and price values.
Line Style : Customize line appearance and transparency.
Label Style : Adjust label size and background transparency.
Level Visibility : Toggle visibility for each level (P, S1–S6, R1–R6, PC, BC, TC) and customize their colors.
This indicator empowers traders with a robust tool to visualize critical price levels with precision and flexibility, enhancing technical analysis and decision-making.

Elliott Wave Probability System Pro v2🎯 Major Improvements Made to Elliott Wave Script
Key Changes:
1. Advanced Trend Detection (Lines 55-82)
Uses 5 different methods to determine trend over last 75 bars:
Price position in range
Linear regression slope
Moving average alignment
Higher highs/lows pattern
Up vs down bar count
Combines all methods into a trendScore for accurate direction
2. Adaptive Target Direction
New input: adaptiveTargets (line 28) - can toggle on/off
When ON: Targets follow the 75-bar trend regardless of short-term indicators
When OFF: Works like original (based on current momentum)
3. Improved Target Calculation
Bullish targets use extensions from current price to recent high
Bearish targets use retracements from current price to recent low
More realistic price levels based on actual market structure
4. Enhanced Status Display
Added "Trend (75 bars)" row showing BULLISH/BEARISH/NEUTRAL
Helps you see why targets are pointing a certain direction
5. Better Probability Calculation
Base probability adjusts with trend strength (70% if strong trend, 50% if not)
Gradual probability decay with distance
Minimum 15% probability (more realistic than 10%)
New Features:
Trend-Based Alerts
Alerts when 75-bar trend changes from bullish to bearish (or vice versa)
Trend Weight in Scoring
Added trendWeight to the total score calculation
Makes signals more aligned with larger trend
Visual Improvements
Projection lines now show at 40% probability (was 50%)
Better visibility of likely targets
How It Works Now:
If last 75 bars show a downtrend , targets will be bearish (even if RSI is oversold)
If last 75 bars show an uptrend , targets will be bullish (even if RSI is overbought)
The probability adjusts based on trend strength
This solves the issue where the script was showing bullish targets in a clear downtrend. Now it properly reflects the dominant trend direction while still considering short-term indicators for probability calculations.

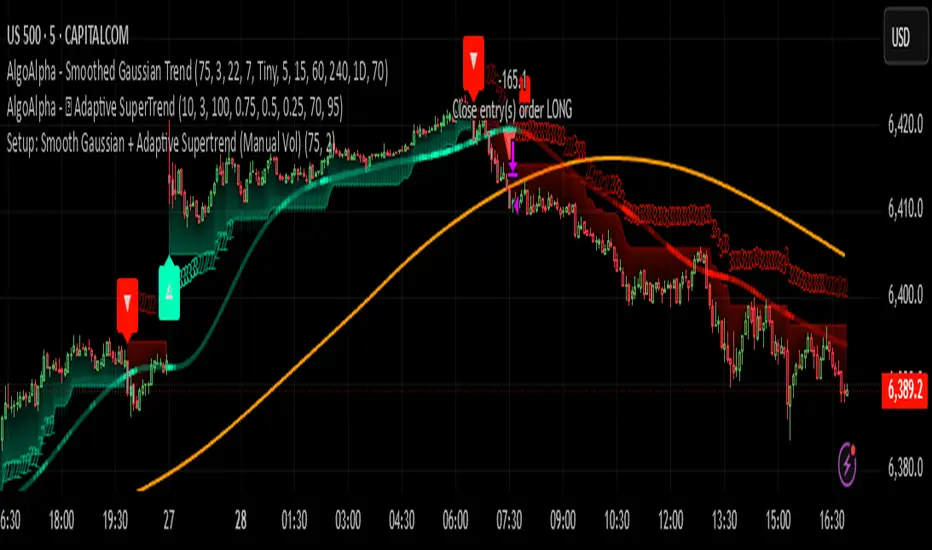
Setup: Smooth Gaussian + Adaptive Supertrend (Manual Vol)Overview
This strategy combines two powerful trend-based tools originally developed by Algo Alpha: the Smooth Gaussian Trend (simulated) and the Adaptive Supertrend. The objective is to capture sustained bullish movements in periods of controlled volatility by filtering for high-probability entries.
Entry Logic
Long Entry Conditions:
The closing price is above the Smooth Gaussian Trend line (with length = 75), and
The volatility setting from the Adaptive Supertrend is manually defined as either 2 or 3
Exit Condition:
The closing price falls below the Smooth Gaussian Trend line
This script uses a simulated version of the Gaussian Trend line via double-smoothed SMA, as the original Algo Alpha indicator is protected and cannot be accessed directly in code.
Features
Plots entry and exit signals directly on the chart
Manual toggle to enable or disable the volatility filter
Lightweight design to allow flexible backtesting even without access to proprietary indicators
Important Note
This strategy does not connect to the actual Adaptive Supertrend from Algo Alpha. Users must manually input the volatility level based on what they observe on the chart when the original indicator is also applied. The Smooth Gaussian Trend is approximated and may differ slightly from the original.
Suggested Use
Recommended timeframes: 1H, 4H, or Daily
Best used alongside the original indicators displayed on the chart
Consider incorporating additional structure, momentum, or volume filters to enhance performance
If you have suggestions or would like to contribute improvements, feel free to reach out or fork the script.
Multi-Timeframe TrendBelow is a PineScript that calculates the trend for multiple timeframes (5 minutes, 15 minutes, 1 hour, 4 hours, and daily) using the Relative Strength Index (RSI) and Moving Averages (MA) to determine bullish, bearish, or neutral trends. The script displays the trend information on the TradingView chart using a table.
PulseLinesLibPulseLinesLib v1.3.1
PulseLines morphic-level calculator (support & resistance)
Exports:
• getLevels(lookback:int, wickRatioThresh:float, flatCandles:int, tolerancePips:float, atrMult:float) → float
Gaussian Volatility Adjusted Gaussian Volatility Adjusted Indicator
The Gaussian Volatility Adjusted indicator is a powerful tool designed to identify trend direction and momentum by combining a Gaussian-filtered moving average with volatility-based thresholds. By smoothing price data with a Gaussian filter and adjusting for market volatility using Average True Range (ATR) and Standard Deviation (SD), this indicator generates clear bullish and bearish signals. The Exponential Moving Average (EMA) of the momentum difference and price bars are dynamically colored to highlight trend strength, making it easier for traders to identify potential entry and exit points in various market conditions.
How It Works
Gaussian Filter Calculations
Gaussian Filter: Applies a Gaussian smoothing filter to a user-defined price source, typically an EMA of the closing price, over a configurable length (default: 70) with a specified sigma (default: 12). The Gaussian filter uses a weighted sum based on a Gaussian distribution to reduce noise while preserving significant price trends. Weights are calculated using the Gaussian formula and normalized to ensure accurate smoothing.
Base Moving Average: Optionally applies an EMA (default: enabled, length: 45) to the closing price before Gaussian filtering, providing a smoother input for the Gaussian calculation to enhance signal reliability.
Volatility Adjustments
ATR-Based Bands: Calculates the Average True Range (ATR) over a user-defined period (default: 24), scaled by a sensitivity factor (default: 1) and an ATR factor (default: 0.85). These form volatility-adjusted bands around the Gaussian-filtered value:
Upper Band: Gaussian value + (ATR × ATR Factor).
Lower Band: Gaussian value - (ATR × ATR Factor).
Standard Deviation Bands: Computes the Standard Deviation (SD) of the closing price over a user-defined period (default: 27), scaled by the sensitivity factor. These form additional bands:
Upper SD Band: Gaussian value + SD.
Lower SD Band: Gaussian value - SD.
Trend and Momentum SignalsTrend
Detection:Bullish Trend: Triggered when the closing price exceeds the upper SD band, setting the trend to +1.
Bearish Trend: Triggered when the closing price falls below the upper ATR-based band, setting the trend to -1.
Momentum Calculation: Computes a momentum difference (Diff) based on the trend:
For a bullish trend (+1), Diff = Close - Upper ATR Band.
For a bearish trend (-1), Diff = Close - (Gaussian + SD).
EMA of Momentum: Applies an EMA (default length: 45) to the momentum difference to smooth the momentum signal.
Final Trend with EMA Confluences:
If EMA confluence is enabled (default: true), a bullish signal (+1) is confirmed when the trend is +1 and Diff exceeds the EMA of Diff. A bearish signal (-1) is confirmed when the trend is -1 and Diff is below the EMA of Diff.
If EMA confluence is disabled, the final trend follows the initial trend direction (±1).
Visual Representation
The indicator provides a clear and intuitive visual interface:
EMA Line: Plots the EMA of the momentum difference, colored based on the final trend:
Green: Bullish trend (Final_Trend = +1).
Red: Bearish trend (Final_Trend = -1).
Gray: Neutral or no trend.
Zero Line: A dashed line at zero (semi-transparent) serves as a reference for the EMA plot.
Bar Coloring: Price bars are colored to reflect the trend:
Green: Bullish trend (Final_Trend = +1).
Red: Bearish trend (Final_Trend = -1).
No Color: Neutral or no trend.
Volatility Bands: While not plotted in the provided script, the ATR and SD bands are calculated and could be plotted for additional context, marking key levels for trend detection.
Customization & Parameters
The Gaussian Volatility Adjusted indicator offers flexible parameters to suit various trading styles:
Volatility Parameters:
ATR Length: Period for ATR calculation (default: 24).
ATR Factor: Multiplier for ATR-based bands (default: 0.85).
SD Length: Period for Standard Deviation calculation (default: 27).
Sensitivity: Scales ATR and SD for band sensitivity (default: 1).
Moving Average Parameters:
Use EMA Confluence: Enable/disable EMA confluence for trend confirmation (default: true).
EMA Length: Period for EMA calculations (default: 45).
Gaussian Parameter:
Gaussian Length: Period for Gaussian filter (default: 70).
Sigma: Controls the Gaussian filter’s smoothness (default: 12).
Color Settings: EMA line and bars use green for bullish signals, red for bearish signals, and gray for neutral states, with customizable transparency for the zero line.
Trading Applications
This indicator is versatile and can be applied across various markets and strategies:
Trend Following:
Use the final trend signals and bar coloring to identify and follow bullish or bearish trends, with the Gaussian filter reducing noise for clearer trend detection.
Momentum Trading: The EMA of the momentum difference highlights strong momentum shifts, ideal for entering or exiting trades based on trend strength.
Reversal Detection: Monitor price crossings of the ATR and SD bands to identify potential trend reversals, especially when confirmed by the EMA confluence.
Scalping and Swing Trading: Adjust parameters (e.g., ATR length, Gaussian length, or sensitivity) to suit short-term scalping or longer-term swing trading strategies.
Final Note
The Gaussian Volatility Adjusted indicator is a robust tool for traders seeking to leverage smoothed price data and volatility-adjusted thresholds for trend and momentum analysis. Its combination of Gaussian filtering, ATR and SD-based bands, and EMA confluence provides a comprehensive framework for identifying trading opportunities. The dynamic coloring of the EMA line and price bars enhances visual clarity, making it easier to act on signals. As with all indicators, backtest thoroughly and integrate into a comprehensive trading strategy for optimal results.

Trend Magic Real-Time Cross for TradersPostTrend Magic Real-Time Cross for TradersPost. IIIIIIIIIIIIIIIIIIIIIIIIIIIIIIIIIIIIIIIIIIIIIIIIIIIIIIIIIIIIIIIIIIIIIIIIII

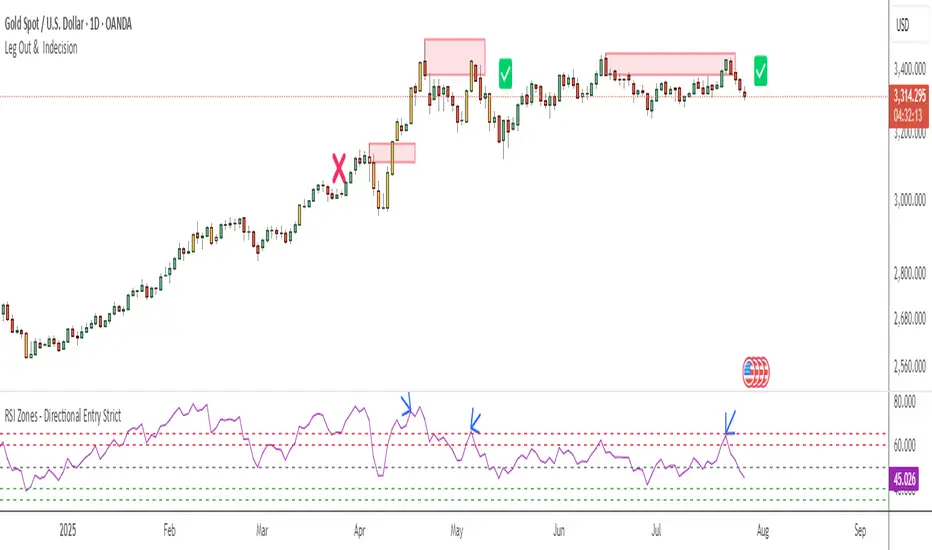
RSI Zones - Directional Entry Strict RSI Zones – Directional Entry Tool (Modified RSI)
This is a simple modification of the standard RSI indicator. I’ve added two custom horizontal lines at the 60–65 and 35–40 zones to help spot momentum shifts and potential reversal points.
60–65 zone: When RSI returns here from above 65, it often signals weakening bullish momentum — useful for spotting short opportunities.
35–40 zone: When RSI returns here from below 35, it can indicate momentum loss on the downside — good for potential long setups.
This version helps traders filter out weak signals and avoid chasing extreme moves.
It works best when combined with price action, structure, or divergence.
Only 2 lines were added to the default RSI for better zone awareness. Everything else remains unchanged.
Kalman VWMA For LoopKalman VWMA For Loop Indicator
The Kalman VWMA For Loop indicator is a sophisticated tool designed to smooth price data using a Kalman filter applied to a Volume Weighted Moving Average (VWMA). By combining the VWMA’s volume-weighted price sensitivity with the adaptive noise reduction of a Kalman filter, this indicator provides traders with a robust momentum and trend-following signal. The indicator includes a customizable for-loop mechanism to potentially iterate over a range of calculations or parameters, enhancing flexibility for advanced trading strategies. Visual outputs are plotted to help traders identify trends and potential trading opportunities with reduced noise.
How It Works
VWMA Calculations
Volume Weighted Moving Average (VWMA): Computes a VWMA based on a user-selected price source (default: Close) over a configurable period (default: 14). The VWMA weights price data by trading volume, providing a more accurate representation of market activity compared to a simple moving average.
Kalman Filter Calculation
Kalman Filter: Applies a Kalman filter to the price source to smooth price movements and reduce noise.
The filter uses:
Process Noise: Controls the adaptability of the filter to price changes (default: 0.01).
Measurement Noise: Adjusts sensitivity to price fluctuations (default: 3).
Filter Order (N): Defines the number of states in the Kalman filter (default: 3), allowing for multi-state modeling of price dynamics.
The Kalman filter iteratively predicts and updates the price estimate using state estimates and error covariances stored in arrays. This process minimizes noise while preserving significant price trends.
For-Loop Mechanism
The script includes a for-loop structure with user-defined parameters (from and to_, defaulting to 1 and 25, respectively). While the provided code does not fully implement the for-loop’s functionality, it is intended to allow iterative calculations or parameter sweeps, such as testing multiple periods or thresholds within the specified range. This feature enhances the indicator’s flexibility for optimization or multi-scenario analysis.
Visual Representations
The indicator plots the VWMA as a red line on the chart, providing a clear visual reference for the volume-weighted trend.
The Kalman-filtered price is calculated but not plotted in the provided code. When plotted, it would appear as a smoothed price line, highlighting the underlying trend with reduced noise.
The for-loop parameters suggest potential for additional visual outputs (e.g., multiple VWMA lines or signals) if fully implemented, but the current script only plots the VWMA.
Customization & Parameters
The Kalman VWMA For Loop indicator offers flexible parameters to suit various trading styles:
Moving Average Parameters:
Price Source: Select the input price (default: Close; options: Close, High, Low, Open).
MA Period: Adjust the VWMA calculation period (default: 14).
Kalman Parameters:
Process Noise: Adjusts the filter’s adaptability to price changes (default: 0.01).
Measurement Noise: Controls sensitivity to price fluctuations (default: 3).
Filter Order (N): Sets the number of states for the Kalman filter (default: 3).
For-Loop Parameters:
From: Starting value for the for-loop (default: 1).
To: Ending value for the for-loop (default: 25).
Color Settings: The VWMA is plotted in red, with potential for additional customizable colors if the for-loop is expanded to plot multiple outputs.
Trading Applications
This indicator is versatile and can be applied across various markets and strategies:
Trend Following:
Use the Kalman-filtered price and VWMA to identify the direction and strength of trends, with the smoothed output reducing false signals in volatile markets.
Momentum Trading: The VWMA highlights volume-driven price movements, allowing traders to enter or exit based on momentum shifts.
Parameter Optimization: The for-loop structure (if fully implemented) enables testing multiple VWMA periods or Kalman parameters, aiding in strategy optimization.
Scalping and Swing Trading: Adjust the MA period and Kalman parameters to suit short-term (scalping) or longer-term (swing trading) strategies.
Final Note
The Kalman VWMA For Loop indicator is a powerful tool for traders seeking to combine volume-weighted price analysis with advanced noise reduction via a Kalman filter. Its customizable parameters and potential for iterative calculations through the for-loop make it adaptable to various trading styles. While the for-loop functionality is not fully implemented in the provided code, completing it could enable dynamic parameter testing or signal generation. As with all indicators, backtest thoroughly and integrate into a comprehensive trading strategy for optimal results.

Trading Checklist - DrFXAiTrading Checklist is a customizable indicator designed for traders who want to stay disciplined and stick to their trading rules. Using this indicator, you can easily create and display your own personalized checklist of trading rules directly on your TradingView chart.
The Title and the Body are two different sections, so you can set two different styles.
This indicator allows you to customize:
Text color
Text size
Text alignment
🚀 Join the Pantheon of Profitable Traders
📩 Contact us on Telegram:👉 t.me

Super-Elliptic BandsThe core of the "Super-Elliptic Bands" indicator lies in its use of a super-ellipse mathematical model to create dynamic price bands around a central Simple Moving Average (SMA). Here's a concise breakdown of its essential components:
Central Moving Average (MA):
A Simple Moving Average (ta.sma(close, maLen)) serves as the baseline, anchoring the bands to the average price over a user-defined period (default: 50 bars).
Super-Ellipse Formula:
The bands are generated using the super-ellipse equation: |y/b| = (1 - |x/a|^p)^(1/p), where:
x is a normalized bar index based on a user-defined cycle period (periodBase, default: 64), scaled to range from -1 to +1.
a = 1 (fixed semi-major axis).
b is the volatility-based semi-minor axis, calculated as volRaw * mult, where volRaw comes from ta.stdev, ta.atr, or ta.tr (user-selectable).
p (shapeP, default: 2.0) controls the band shape:
p = 2: Elliptical bands.
p < 2: Pointier, diamond-like shapes.
p > 2: Flatter, rectangular-like shapes.
This formula creates bands that dynamically adjust their width and shape based on price volatility and a cyclical component.
enjoy....
NDX Levels Adjusted to Active TickerThis indicator allows you to plot custom NDX levels directly on the NQ1! (E-mini NASDAQ-100 Futures) chart, automatically adjusting for the spread between NDX and NQ1!. This is particularly useful for traders who perform technical analysis on NDX but execute trades on NQ1!.
Features:
Input up to three NDX key levels to track (e.g., 23000, 24000, 25000).
The script adjusts these levels in real-time based on the current spread between NDX and NQ1!
Displays the spread in the chart header for quick reference
Plots updated horizontal lines that move with the spread
Includes optional labels showing the spread periodically to reduce clutter
Supports Multiple Tickers: NQ1!, QQQ, NAS100 and NAS100USD.
Ideal for futures traders who want SPX context while trading NQ1!, QQQ, NAS100 or NAS100USD..

This is a multi-layered swing breakout scanner design🧠 What It Does:
Dynamically plots swing highs and lows using customizable pivot length
Confirms breakout signals with:
✅ Volume spike (above 20-period SMA × multiplier)
✅ RSI trend confirmation (RSI > 50 for longs, < 50 for shorts)
✅ EMA trend filter (price above/below EMA to align with momentum)
🔔 Alerts Included:
"Break Above Swing High" (volume + trend confirmed)
"Break Below Swing Low" (volume + trend confirmed)
📈 Use this tool on any timeframe (5m, 1H, 4H) and asset (stocks, crypto, ETFs).
It is ideal for:
Momentum swing traders
Intraday breakout scalpers
Traders filtering false signals using volume & structure

OI Scalp AnShkjgjkjhghjhjgjgkkjhgkkjhjkjgfdfhhgghghfhfhdfhdffhdfhffhfhdfhgfhgdgfgdhgfgfgdhgfgdhgfdhgfdfhhh
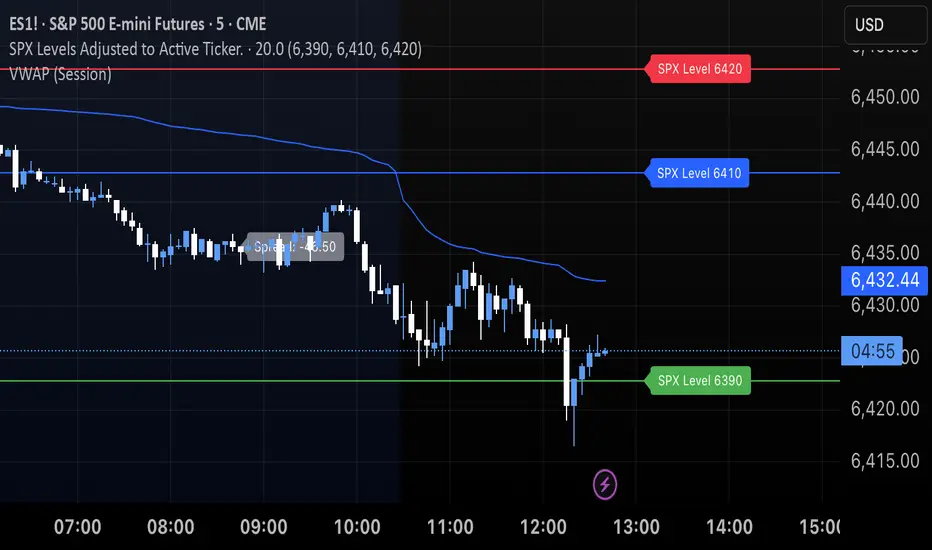
SPX Levels Adjusted to Active TickerThis indicator allows you to plot custom SPX levels directly on the ES1! (E-mini S&P 500 Futures) chart, automatically adjusting for the spread between SPX and ES1!. This is particularly useful for traders who perform technical analysis on SPX but execute trades on ES1!.
Features:
Input up to three SPX key levels to track (e.g., 5000, 4950, 4900)
The script adjusts these levels in real-time based on the current spread between SPX and ES1!
Displays the spread in the chart header for quick reference
Plots updated horizontal lines that move with the spread
Includes optional labels showing the spread periodically to reduce clutter
Supports Multiple Tickers, ES1!, SPY and SPX500USD.
Ideal for futures traders who want SPX context while trading ES1!.
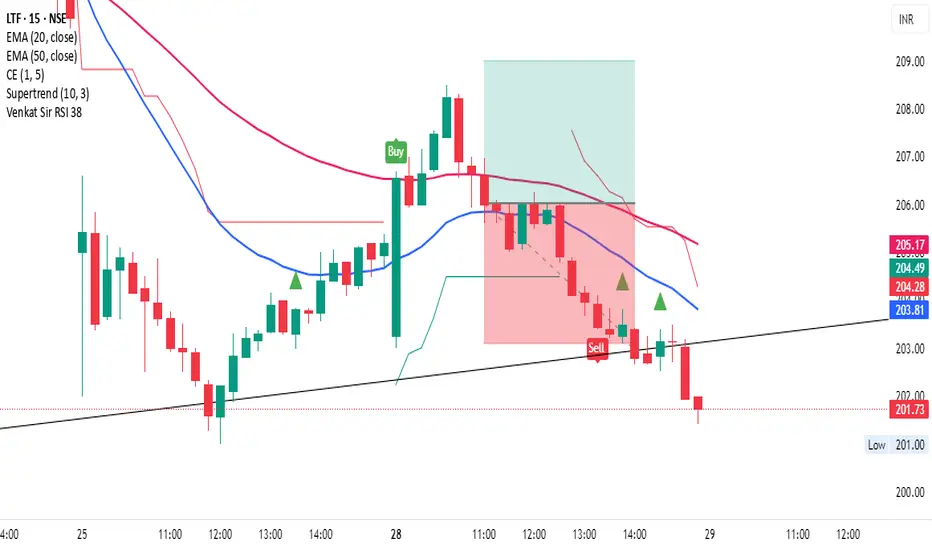
Venkat Sir RSI 38Here's a Pine Script (TradingView) code that does the following:
Uses the RSI indicator (Relative Strength Index).
Watches for RSI crossing below level 38 and then crossing above 38.
When RSI crosses above 38 (after having gone below), it plots a green triangle-up symbol above the candle that triggered the cross.
Ashish indicator//@version=5
// Copyright (c) 2021-present, Alex Orekhov (everget)
indicator('Ashish indicator', overlay=true)
amplitude = input(title='Amplitude', defval=1)
channelDeviation = input(title='Channel Deviation', defval=2)
showArrows = input(title='Show Arrows', defval=true)
showChannels = input(title='Show Channels', defval=false)
var int trend = 0
var int nextTrend = 0
var float maxLowPrice = nz(low , low)
var float minHighPrice = nz(high , high)
var float up = 0.0
var float down = 0.0
float atrHigh = 0.0
float atrLow = 0.0
float arrowUp = na
float arrowDown = na
atr2 = ta.atr(100) / 2
dev = channelDeviation * atr2
highPrice = high
lowPrice = low
highma = ta.sma(high, amplitude)
lowma = ta.sma(low, amplitude)
if nextTrend == 1
maxLowPrice := math.max(lowPrice, maxLowPrice)
if highma < maxLowPrice and close < nz(low , low)
trend := 1
nextTrend := 0
minHighPrice := highPrice
minHighPrice
else
minHighPrice := math.min(highPrice, minHighPrice)
if lowma > minHighPrice and close > nz(high , high)
trend := 0
nextTrend := 1
maxLowPrice := lowPrice
maxLowPrice
if trend == 0
if not na(trend ) and trend != 0
up := na(down ) ? down : down
arrowUp := up - atr2
arrowUp
else
up := na(up ) ? maxLowPrice : math.max(maxLowPrice, up )
up
atrHigh := up + dev
atrLow := up - dev
atrLow
else
if not na(trend ) and trend != 1
down := na(up ) ? up : up
arrowDown := down + atr2
arrowDown
else
down := na(down ) ? minHighPrice : math.min(minHighPrice, down )
down
atrHigh := down + dev
atrLow := down - dev
atrLow
ht = trend == 0 ? up : down
var color buyColor = color.purple
var color sellColor = color.red
htColor = trend == 0 ? buyColor : sellColor
htPlot = plot(ht, title='Ashish indicator', linewidth=2, color=htColor)
atrHighPlot = plot(showChannels ? atrHigh : na, title='ATR High', style=plot.style_circles, color=sellColor)
atrLowPlot = plot(showChannels ? atrLow : na, title='ATR Low', style=plot.style_circles, color=buyColor)
fill(htPlot, atrHighPlot, title='ATR High Ribbon', color=sellColor, transp=90)
fill(htPlot, atrLowPlot, title='ATR Low Ribbon', color=buyColor, transp=90)
buySignal = not na(arrowUp) and trend == 0 and trend == 1
sellSignal = not na(arrowDown) and trend == 1 and trend == 0
plotshape(showArrows and buySignal ? atrLow : na, title='Arrow Up', style=shape.triangleup, location=location.belowbar, size=size.tiny, color=buyColor)
plotshape(showArrows and sellSignal ? atrHigh : na, title='Arrow Down', style=shape.triangledown, location=location.abovebar, size=size.tiny, color=sellColor)
alertcondition(buySignal, title='Alert: Ashish indicator Buy', message='Ashish indicator Buy')
alertcondition(sellSignal, title='Alert: Ashish indicator Sell', message='Ashish indicator Sell')

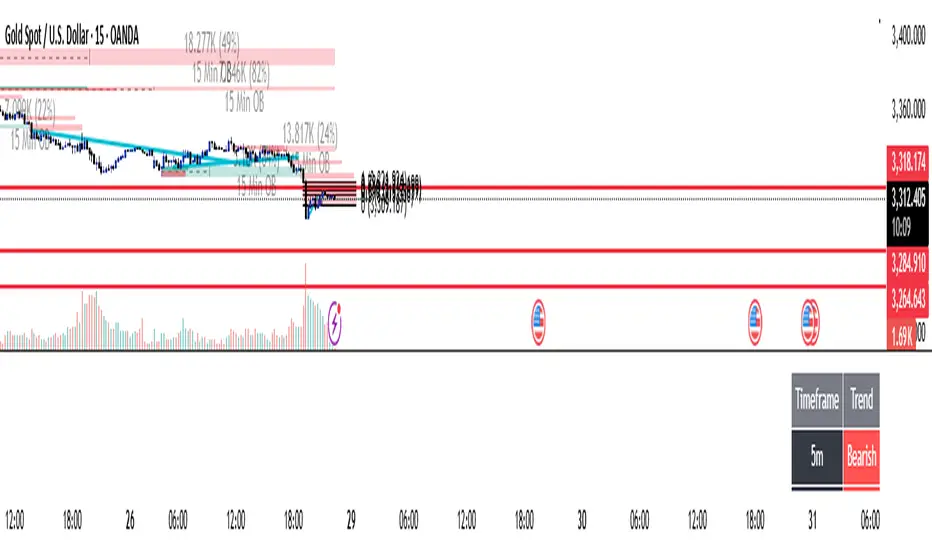
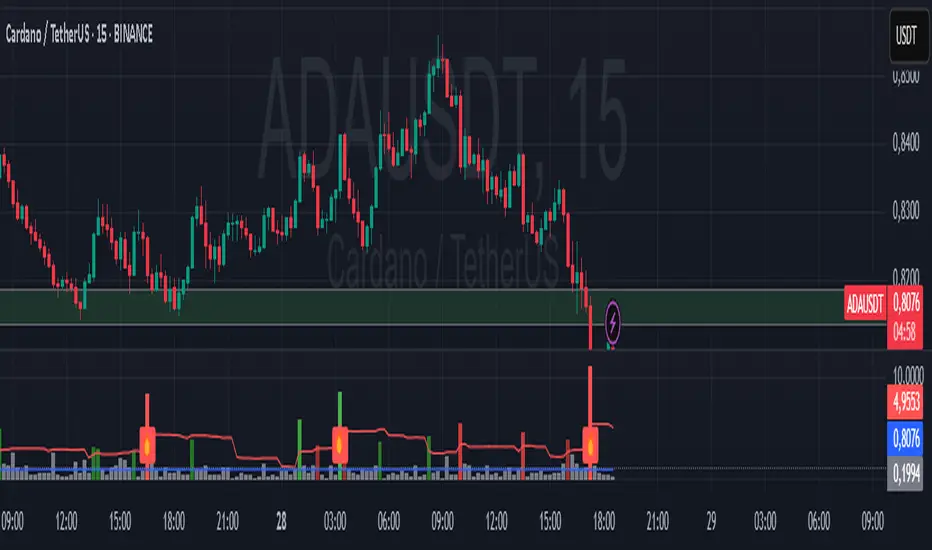
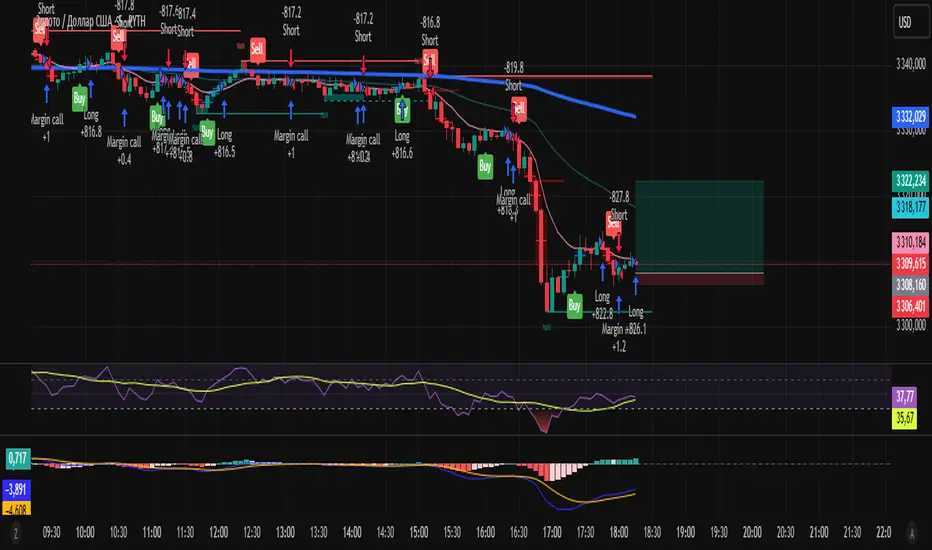
CE XAU/USDT Strategy📌 Auto-Trading Strategy Using CE on XAU/USDT (5M)
Indicator: CE
Parameters:
• ATR Period: 1
• ATR Multiplier: 1.85
Timeframe: 5 minutes
Instrument: Gold (XAU/USD)
🔁 Logic:
• Buy signal → Close short, open long
• Sell signal → Close long, open short
⚙️ Automation:
1. CE indicator on TradingView generates signals
2. Signals are sent via webhook to a Python bot
3. The bot opens/closes trades in MT5 accordingly
✅ Advantages:
• Full automation
• Operates 24/7 without manual intervention
⚠️ Important:
• Always test on a demo account
• Manage risk and position size properly
📌 Стратегия автоторговли по CE на XAU/USDT (5М)
Индикатор: CE
Параметры:
• ATR Period: 1
• ATR Множитель: 1.85
Таймфрейм: 5 минут
Инструмент: Золото (XAU/USD)
🔁 Логика:
• Buy сигнал → закрыть шорт, открыть лонг
• Sell сигнал → закрыть лонг, открыть шорт
⚙️ Автоматизация:
1. CE в TradingView генерирует сигналы
2. Webhook отправляет их в Python-бот
3. Бот открывает/закрывает сделки в MT5
✅ Плюсы:
• Полная автоматизация
• Работа 24/7 без вмешательства
⚠️ Важно:
• Тестируй на демо
• Управляй рисками и лотами
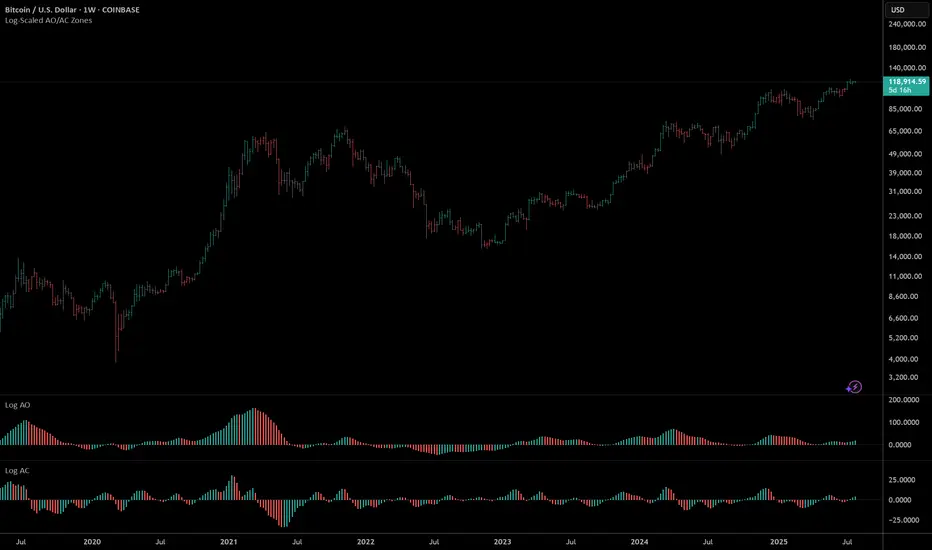
AO/AC Zones (Log Price)William's AO/AC Zones scaled to work with log-price AO/AC indicators.
When the log AO and log AC are green = price bar is painted green
When the log AO and log AC are different = price bar painted gray
When the log AO and log AC are red = price bar painted red
Useful for seeing when momentum is beginning to increase or decrease, and direction on the AO/AC could be changing. Can also be used with William's standard entry and exit signals. Works with the log indicators, made for volatile and long-term charts which exhibit logarithmic trends.
Pivot and Wick Boxes with Break Signals█ OVERVIEW
This Pine Script® indicator draws support and resistance levels based on high and low pivot points and the wicks of pivot candles. When the price breaks these levels, breakout signals are generated, with an optional volume filter for greater precision. The indicator is fully customizable, allowing users to adjust box styles, pivot length, and signal settings.
█ CONCEPTS
The indicator relies on several key elements to identify and visualize important price levels and trading signals:
Pivot Identification
High and low pivots are detected using the ta.pivothigh and ta.pivotlow functions with a configurable pivot length. Boxes are drawn based on the pivot level and the wick of the pivot candle (top for high pivots, bottom for low pivots).
List of Features
1 — High and Low Pivot Boxes: The indicator draws boxes based on high pivot candles (red) and low pivot candles (green) and their wicks, with options to customize colors, border styles, and background gradient. Boxes are limited to 500 bars back, meaning support and resistance levels older than 500 candles are not displayed to maintain chart clarity.
2 — Breakout Signals: When the price closes above the upper edge of a high pivot box, a breakout signal is generated (green triangle below the bar). When the price closes below the lower edge of a low pivot box, a breakout signal is generated (red triangle above the bar).
Signals can be filtered using volume, requiring the volume at the breakout to exceed the average volume multiplied by a configurable multiplier.
3 — Box Management: The indicator limits the number of displayed boxes (default is 15 for high pivots and 15 for low pivots), removing the oldest boxes when the limit is reached. Boxes older than 500 bars are automatically removed.
Volume Filtering
An optional volume filter allows users to require breakout signals to be confirmed by volume exceeding the moving average of volume (calculated over a selected period, default is 20 days).
█ OTHER SECTIONS
FEATURES
• Show High/Low Pivot Boxes: Enables or disables the display of boxes for high and low pivots.
• Pivot Length: Specifies the number of bars back and forward for detecting pivots (default is 5).
• Max Boxes: Sets the maximum number of boxes for high and low pivots (default is 15).
• Volume Filter: Enables a volume filter for breakout signals, with a configurable multiplier and average period.
• Box Style: Allows customization of border color, background gradient, border width, and border style (solid, dashed, dotted).
HOW TO USE
1 — Add the indicator to your TradingView chart by selecting “Pivot and Wick Boxes with Break Signals” from the indicators list.
2 — Configure the settings in the indicator’s dialog window, adjusting pivot length, maximum number of boxes, colors, and style.
3 — Enable the volume filter if you want signals to be confirmed by high volume.
4 — Monitor breakout signals (green triangles below bars for upward breakouts, red triangles above bars for downward breakouts) on the chart.
LIMITATIONS
• New pivots are detected with a delay equal to the set pivot length. A lower pivot length value results in faster pivot detection but produces pivots with less significance as support or resistance levels compared to those generated with a longer value.
• Breakout signals may produce false signals in volatile market conditions, especially without the volume filter.
• Boxes are limited to 500 bars back, which may exclude older pivots on long-term charts.
