Indicators and strategies
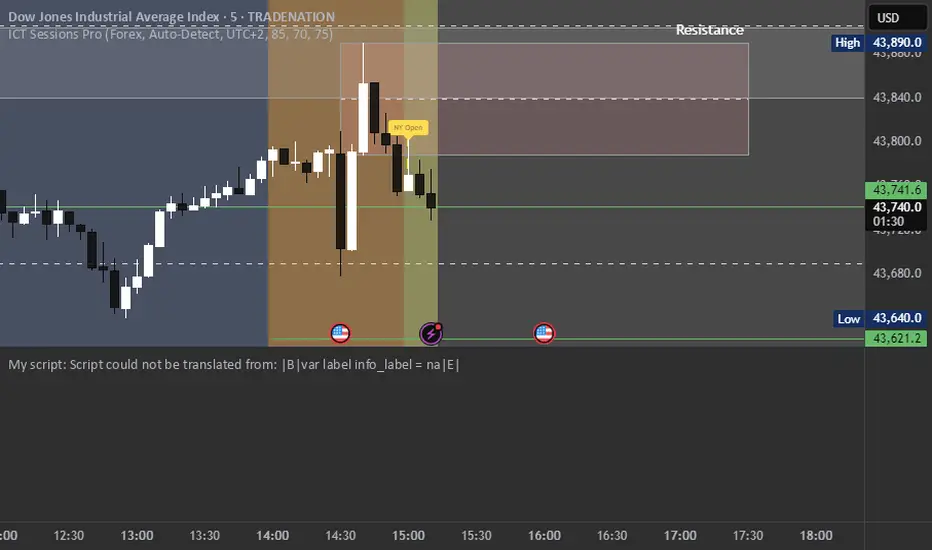
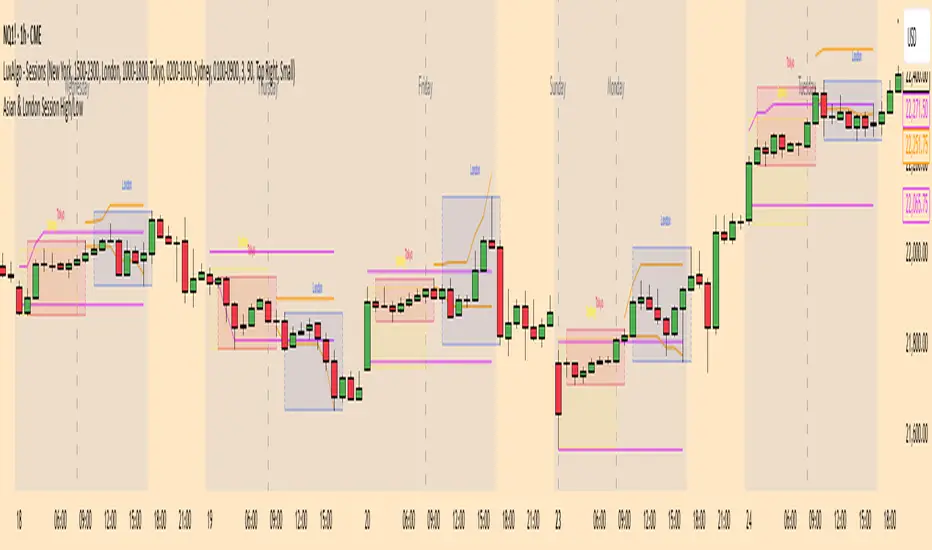
Asian & London Session High/LowThis Pine Script v6 indicator plots the high and low of the Asian and London trading sessions on the chart before the New York session opens.
Asian session is defined from 00:00 to 08:00 (Europe/Sofia time).
London session is defined from 09:00 to 16:30 (Europe/Sofia time).
The session highs and lows are tracked live and updated as new candles form within the session time ranges.
At 16:30, when the New York session opens, all high/low values are reset to na to prepare for the next day.
Horizontal lines are plotted using plot.style_linebr to extend the lines until the next candle.
This tool helps traders identify key support/resistance zones formed during the most active pre-New York hours.

Power candle addPower candle add++++Power candle add++++Power candle add++++Power candle add++++Power candle add++++Power candle add++++Power candle add++++Power candle add++++Power candle add++++Power candle add++++Power candle add++++Power candle add++++Power candle add++++
EMA 8 & 21 crossover change EMA 8 & 21 crossover change Indicator This custom TradingView indicator highlights trend shifts by changing candle colors when the 8 EMA crosses the 21 EMA. Bullish crossovers turn candles different color, while bearish crossovers turns different as well—making it easy to visually identify emerging trends and momentum shifts in real time.

Range Filter Strategy [Real Backtest]Range Filter Strategy - Real Backtesting
# Overview
Advanced Range Filter strategy designed for realistic backtesting with precise execution timing and comprehensive risk management. Built specifically for cryptocurrency markets with customizable parameters for different assets and timeframes.
Core Algorithm
Range Filter Technology:
- Smooth Average Range calculation using dual EMA filtering
- Dynamic range-based price filtering to identify trend direction
- Anti-noise filtering system to reduce false signals
- Directional momentum tracking with upward/downward counters
Key Features
Real-Time Execution (No Delay)
- Process orders on tick: Immediate execution without waiting for bar close
- Bar magnifier integration for intrabar precision
- Calculate on every tick for maximum responsiveness
- Standard OHLC bypass for enhanced accuracy
Realistic Price Simulation
- HL2 entry pricing (High+Low)/2 for realistic fills
- Configurable spread buffer simulation
- Random slippage generation (0 to max slippage)
- Market liquidity validation before entry
Advanced Signal Filtering
- Volume-based filtering with customizable ratio
- Optional signal confirmation system (1-3 bars)
- Anti-repetition logic to prevent duplicate signals
- Daily trade limit controls
Risk Management
- Fixed Risk:Reward ratios with precise point calculation
- Automatic stop loss and take profit execution
- Position size management
- Maximum daily trades limitation
Alert System
- Real-time alerts synchronized with strategy execution
- Multiple alert types: Setup, Entry, Exit, Status
- Customizable message formatting with price/time inclusion
- TradingView alert panel integration
Default Parameters
Optimized for BTC 5-minute charts:
- Sampling Period: 100
- Range Multiplier: 3.0
- Risk: 50 points
- Reward: 100 points (1:2 R:R)
- Spread Buffer: 2.0 points
- Max Slippage: 1.0 points
Signal Logic
Long Entry Conditions:
- Price above Range Filter line
- Upward momentum confirmed
- Volume requirements met (if enabled)
- Confirmation period completed (if enabled)
- Daily trade limit not exceeded
Short Entry Conditions:
- Price below Range Filter line
- Downward momentum confirmed
- Volume requirements met (if enabled)
- Confirmation period completed (if enabled)
- Daily trade limit not exceeded
Visual Elements
- Range Filter line with directional coloring
- Upper and lower target bands
- Entry signal markers
- Risk/Reward ratio boxes
- Real-time settings dashboard
Customization Options
Market Adaptation:
- Adjust Sampling Period for different timeframes
- Modify Range Multiplier for various volatility levels
- Configure spread/slippage for different brokers
- Set appropriate R:R ratios for trading style
Filtering Controls:
- Enable/disable volume filtering
- Adjust confirmation requirements
- Set daily trade limits
- Customize alert preferences
Performance Features
- Realistic backtesting results aligned with live trading
- Elimination of look-ahead bias
- Proper order execution simulation
- Comprehensive trade statistics
Alert Configuration
Alert Types Available:
- Entry signals with complete trade information
- Setup alerts for early preparation
- Exit notifications for position management
- Filter direction changes for market context
Message Format:
Symbol - Action | Price: XX.XX | Stop: XX.XX | Target: XX.XX | Time: HH:MM
Usage Recommendations
Optimal Settings:
- Bitcoin/Major Crypto: Default parameters
- Forex: Reduce sampling period to 50-70, multiplier to 2.0-2.5
- Stocks: Reduce sampling period to 30-50, multiplier to 1.0-1.8
- Gold: Sampling period 60-80, multiplier 1.5-2.0
TradingView Configuration:
- Recalculate: "On every tick"
- Orders: "Use bar magnifier"
- Data: Real-time feed recommended
Risk Disclaimer
This strategy is designed for educational and analytical purposes. Past performance does not guarantee future results. Always test thoroughly on paper trading before live implementation. Consider market conditions, broker execution, and personal risk tolerance when using any automated trading system.
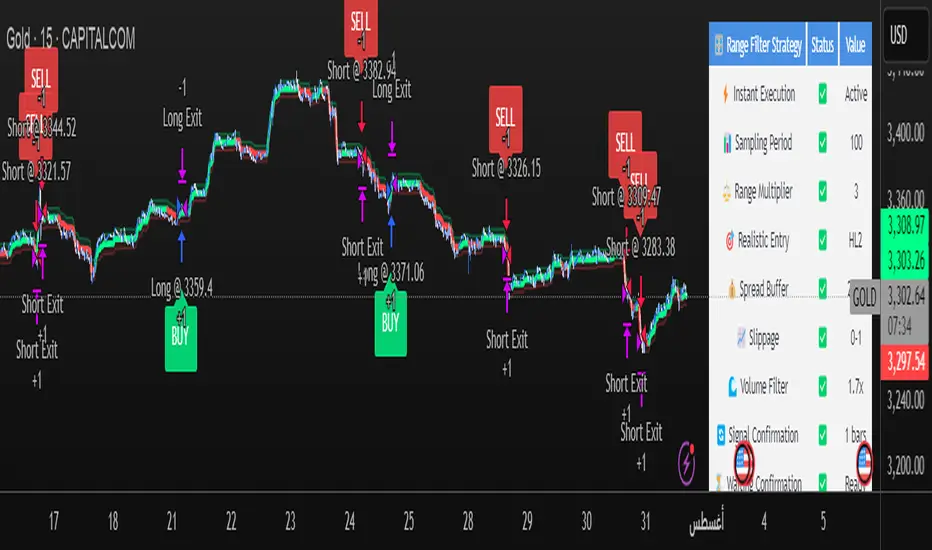
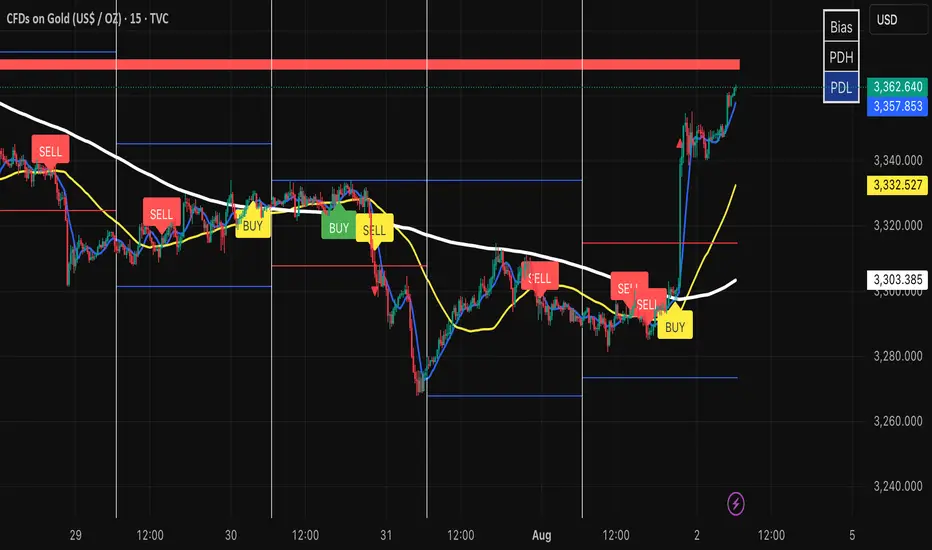
Best Settings Found for Gold 15-Minute Timeframe
After extensive testing and optimization, these are the most effective settings I've discovered for trading Gold (XAUUSD) on the 15-minute timeframe:
Core Filter Settings:
Sampling Period: 100
Range Multiplier: 3.0
Professional Execution Engine:
Realistic Entry: Enabled (HL2)
Spread Buffer: 2 points
Dynamic Slippage: Enabled with max 1 point
Volume Filter: Enabled at 1.7x ratio
Signal Confirmation: Enabled with 1 bar confirmation
Risk Management:
Stop Loss: 50 points
Take Profit: 100 points (2:1 Risk-Reward)
Max Trades Per Day: 5
These settings provide an excellent balance between signal accuracy and realistic market execution. The volume filter at 1.7x ensures we only trade during periods of sufficient market activity, while the 1-bar confirmation helps filter out false signals. The spread buffer and slippage settings account for real trading costs, making backtest results more realistic and achievable in live trading.
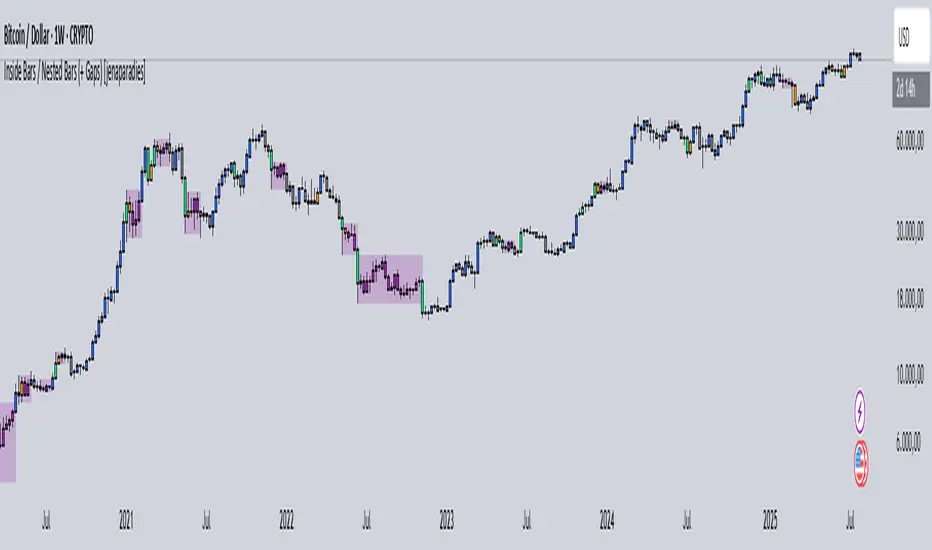
Inside Bars / Nested Bars (+ Gaps) [jenaparadies]📌 Features
Highlight inside bars
Highlight bars that remain within the range of a mother bar (called nested bars )
Highlight the mother bar (optional)
Highlight consecutive nested bars using a visual box (optional)
Enable no-gap candle logic (optional, see below)
Show no-gap candles on the chart (optional)
Fully customizable colors and appearance
📌 Method
An inside bar is any candle whose high is lower than or equal to the previous candle's high, and whose low is higher than or equal to the previous candle's low. In other words, the entire price action of the inside bar remains within the range of the previous candle without exceeding it. The preceding candle is referred to as the mother bar .
Occasionally, the candle following the inside bar may break above or below the inside bar's range, while still remaining fully within the high and low of the mother bar. These candles are referred to as nested bars and are highlighted in a different color.
Optionally, sequences of consecutive nested bars can be enclosed within a box to emphasize consolidation zones.
📌 No-Gap Candles (Optional)
This feature adjusts each candle’s opening price so that it matches the closing price of the previous candle. It is particularly useful for assets that frequently experience large gaps between candles.
By extending each candle's effective range to include the previous candle's close, the indicator maintains structural consistency over timeframes, especially when the open price deviates significantly from the prior close. Inside bars are then identified relative to the extended range of the mother bar.
Optionally, the adjusted no-gap candles can be visualized directly on the chart for better clarity.
🎁 Bonus
Activating the "Show No-Gap Candles" option transforms any line chart into a gap-free bar chart ‒ ideal for visualizing economic data such as inflation rates.
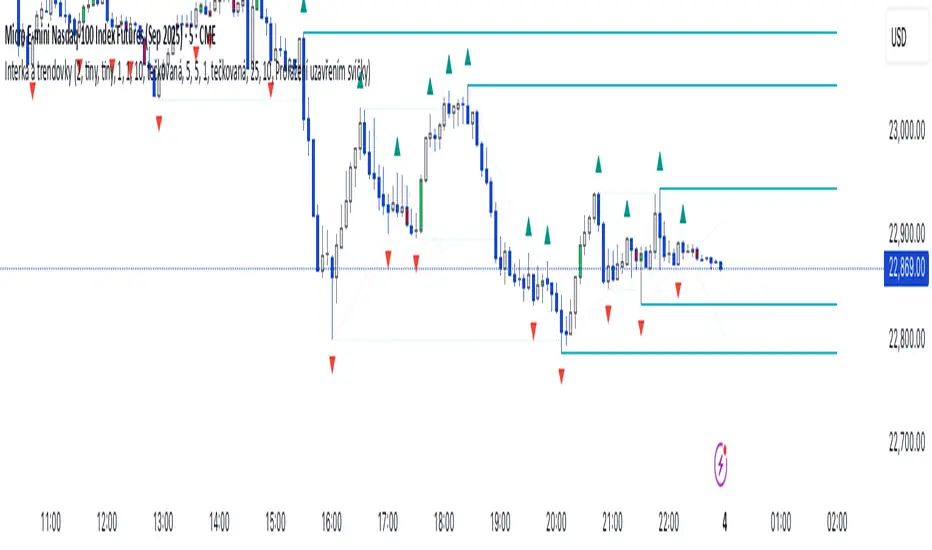
Fraktály a Trendovkyal shlash dlka sklhsda hasd klnasdnlkcalknacs 654 as64asd 65ads 156as 13ads 32asd 165as
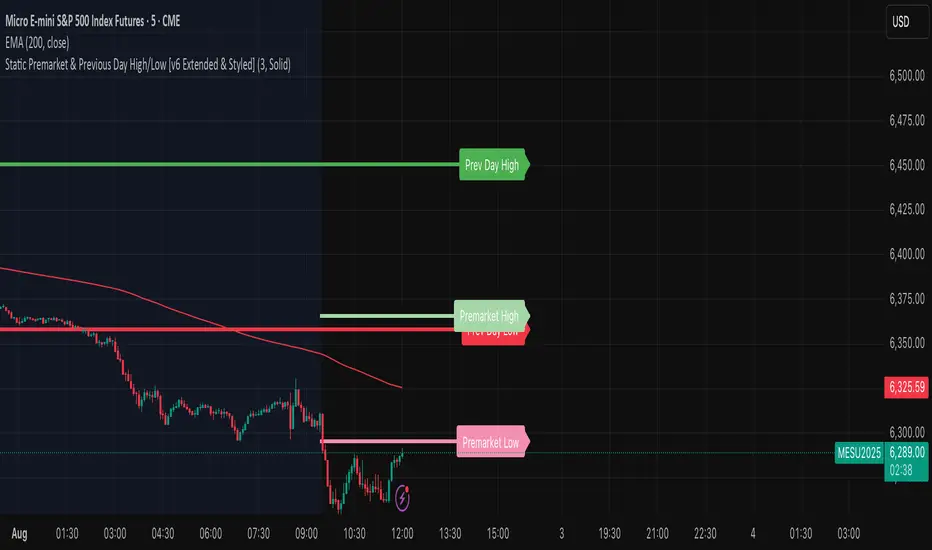
High/Low Premarket & Previous Day This scripts adds lines for previous day and premarket high/low with labels that you can toggle on and off. The lines extend through current premarket and trading session
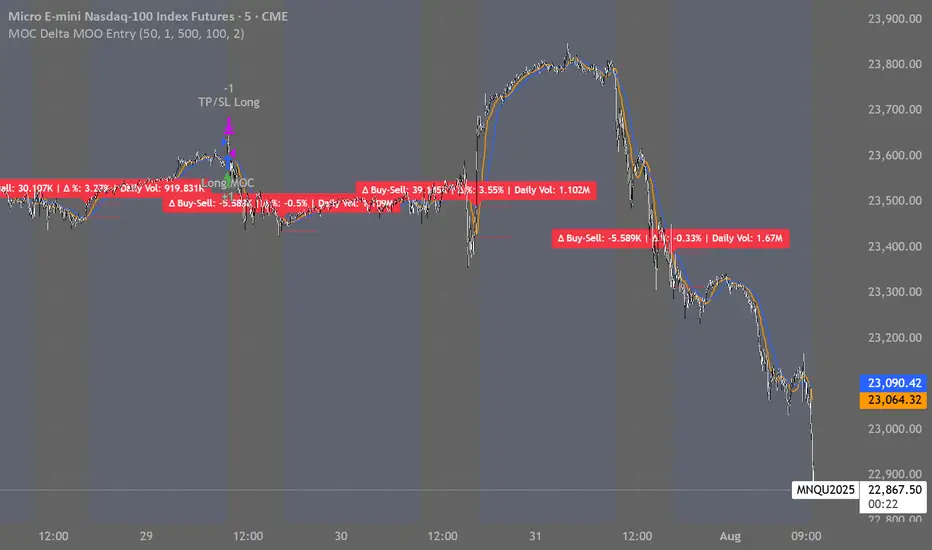
MOC Delta MOO Entry
This model is a momentum-based futures strategy that uses the buy/sell delta during the MOC window (3:50–3:59 EST) to determine market sentiment. If the MOC delta exceeds a customizable percentage of total daily volume, a trade is triggered at the next day’s 9:30 open, but only if the price opens above or below the 15 and 30 SMAs (for long or short entries, respectively). All trades are exited at 3:50 PM EST on the same day.
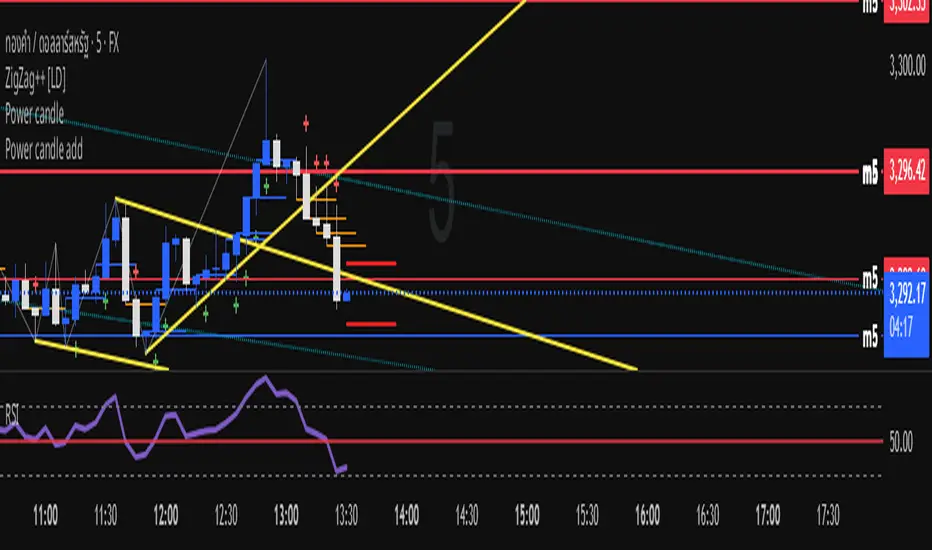
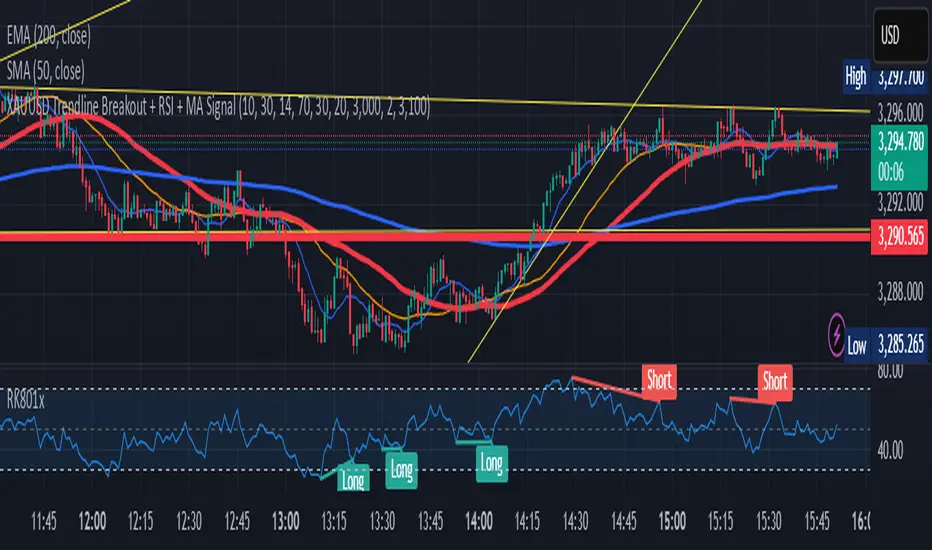
XAUUSD Trendline Breakout + RSI + MA Signal//@version=5
indicator("XAUUSD Trendline Breakout + RSI + MA Signal", overlay=true)
// --- Inputs ---
lengthFast = input.int(10, title="Fast MA Length")
lengthSlow = input.int(30, title="Slow MA Length")
rsiLength = input.int(14, title="RSI Length")
rsiOverbought = input.int(70, title="RSI Overbought Level")
rsiOversold = input.int(30, title="RSI Oversold Level")
// --- Moving Averages ---
fastMA = ta.sma(close, lengthFast)
slowMA = ta.sma(close, lengthSlow)
// --- RSI ---
rsi = ta.rsi(close, rsiLength)
// --- Trendline (Manual input) ---
// Use fixed default price values here, change manually based on your chart.
trend_x1 = input.int(20, title="Trendline Point 1 X (bars ago)")
trend_y1 = input.float(3000.0, title="Trendline Point 1 Y (price)") // constant default
trend_x2 = input.int(2, title="Trendline Point 2 X (bars ago)")
trend_y2 = input.float(3100.0, title="Trendline Point 2 Y (price)") // constant default
bar_idx1 = bar_index - trend_x1
bar_idx2 = bar_index - trend_x2
trendline_y_value(bar) =>
m = (trend_y2 - trend_y1) / (bar_idx2 - bar_idx1)
c = trend_y1 - m * bar_idx1
m * bar + c
trend_y_curr = trendline_y_value(bar_index)
trend_y_prev = trendline_y_value(bar_index - 1)
// --- Signals ---
// Trendline breakout
buyBreakout = (close < trend_y_prev) and (close > trend_y_curr)
sellBreakout = (close > trend_y_prev) and (close < trend_y_curr)
// MA crossover
maBuy = ta.crossover(fastMA, slowMA)
maSell = ta.crossunder(fastMA, slowMA)
// RSI confirmation
rsiBuy = rsi < rsiOversold
rsiSell = rsi > rsiOverbought
// Final buy/sell signal with all conditions
buySignal = buyBreakout and maBuy and rsiBuy
sellSignal = sellBreakout and maSell and rsiSell
// --- Plot ---
plot(fastMA, color=color.blue, title="Fast MA")
plot(slowMA, color=color.orange, title="Slow MA")
plotshape(buySignal, title="Buy Signal", location=location.belowbar, color=color.green, style=shape.labelup, text="BUY")
plotshape(sellSignal, title="Sell Signal", location=location.abovebar, color=color.red, style=shape.labeldown, text="SELL")
// Plot trendline
var line trendLine = na
if barstate.islast
if na(trendLine)
trendLine := line.new(bar_idx1, trend_y1, bar_idx2, trend_y2, color=color.yellow, width=2)
else
line.set_xy1(trendLine, bar_idx1, trend_y1)
line.set_xy2(trendLine, bar_idx2, trend_y2)
// --- Alerts ---
alertcondition(buySignal, title="Buy Alert", message="XAUUSD Buy Signal")
alertcondition(sellSignal, title="Sell Alert", message="XAUUSD Sell Signal")
TrailingPE//@version=6
indicator("TrailingPE", shorttitle="TPE", overlay=true)
// === USER INPUTS ===
pos_x = input.string("Right", "Horizontal Position", options= )
pos_y = input.string("Top", "Vertical Position", options= )
text_color = input.color(color.white, "Text Color")
bg_color = input.color(color.new(color.blue, 80), "Background Color")
text_size = input.string("Normal", "Font Size", options= )
// === POSITION MAPPING ===
get_position_y() =>
switch pos_y
"Top" =>
switch pos_x
"Left" => position.top_left
"Center" => position.top_center
"Right" => position.top_right
"Middle" =>
switch pos_x
"Left" => position.middle_left
"Center" => position.middle_center
"Right" => position.middle_right
"Bottom" =>
switch pos_x
"Left" => position.bottom_left
"Center" => position.bottom_center
"Right" => position.bottom_right
get_text_size() =>
switch text_size
"Tiny" => size.tiny
"Small" => size.small
"Normal" => size.normal
"Large" => size.large
"Huge" => size.huge
// === PE CALCULATION ===
eps_ttm = request.financial(syminfo.tickerid, "EARNINGS_PER_SHARE_DILUTED", "TTM")
if na(eps_ttm)
eps_ttm := request.financial(syminfo.tickerid, "EARNINGS_PER_SHARE_BASIC", "TTM")
current_price = close
pe_ratio = eps_ttm > 0 ? current_price / eps_ttm : na
is_data_valid = not na(pe_ratio) and eps_ttm > 0
// === COMPACT SINGLE-LINE DISPLAY ===
if barstate.islast
var table pe_table = table.new(get_position_y(), 1, 1,
bgcolor=bg_color,
border_width=1,
border_color=color.gray)
table.clear(pe_table, 0, 0, 0, 0)
if is_data_valid
// Single line: "PE : Value" - removed text_style parameter
pe_rounded = math.ceil(pe_ratio)
pe_text = "PE : " + str.tostring(pe_rounded)
table.cell(pe_table, 0, 0, pe_text,
text_color=text_color,
text_size=get_text_size(),
bgcolor=bg_color)
else
table.cell(pe_table, 0, 0, "PE : N/A",
text_color=color.red,
text_size=get_text_size(),
bgcolor=bg_color)

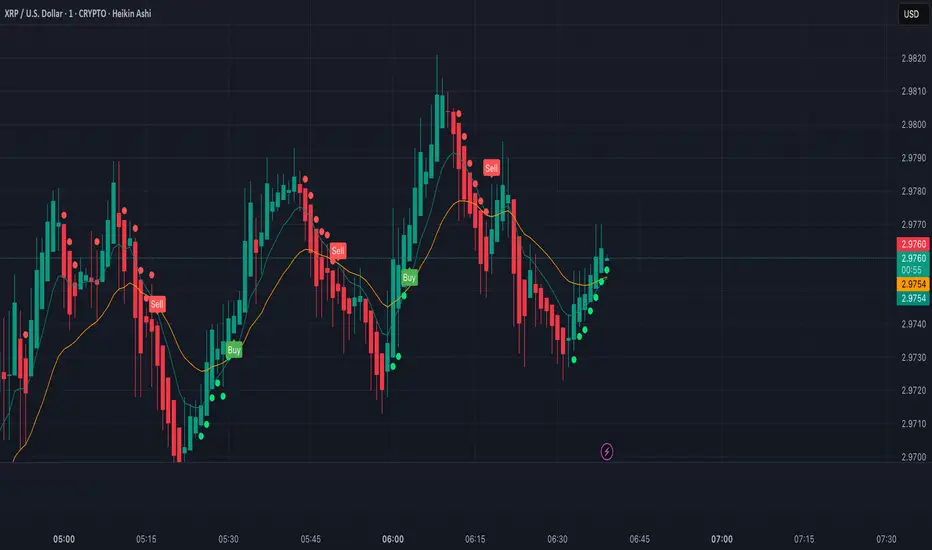
XRP Scalping with EMA Crossover Anticipation This script is designed to detect scalping opportunities on XRP by anticipating EMA crossovers, reinforced with technical confirmation filters.
Methodology
- The core signal is based on the crossover between a fast EMA (9) and a slow EMA (21).
- RSI (14) conditions are applied to avoid weak setups: RSI must be above 40 for buy signals and below 70 for sell signals.
- Before any crossover is validated, the script requires at least two consecutive “pre-crossover” signals. These indicate favorable momentum and convergence conditions before the crossover occurs.
- Final signals are only displayed if this minimum number of preconditions is met.
Application
This system is optimized for scalping on the 1-minute to 5-minute timeframes but can be adapted for longer-term setups by adjusting parameters. The anticipation logic helps reduce lagging entries and improves signal selectivity during volatile conditions.
Both pre-crossover and confirmed crossover conditions include alert options. The code is fully editable and customizable.
BTC 1m Chop Top/Bottom Reversal (Stable Entries)Strategy Description: BTC 5m Chop Top/Bottom Reversal (Stable Entries)
This strategy is engineered to capture precise reversal points during Bitcoin’s choppy or sideways price action on the 5-minute timeframe. It identifies short-term tops and bottoms using a confluence of volatility bands, momentum indicators, and price structure, optimized for high-probability scalping and intraday reversals.
Core Logic:
Volatility Filter: Uses an EMA with ATR bands to define overextended price zones.
Momentum Divergence: Confirms reversals using RSI and MACD histogram shifts.
Price Action Filter: Requires candle confirmation in the direction of the trade.
Locked Signal Logic: Prevents repaints and disappearing trades by confirming signals only once per bar.
Trade Parameters:
Short Entry: Above upper band + overbought RSI + weakening MACD + bearish candle
Long Entry: Below lower band + oversold RSI + strengthening MACD + bullish candle
Take Profit: ±0.75%
Stop Loss: ±0.4%
This setup is tuned for traders using tight risk control and leverage, where execution precision and minimal drawdown tolerance are critical.

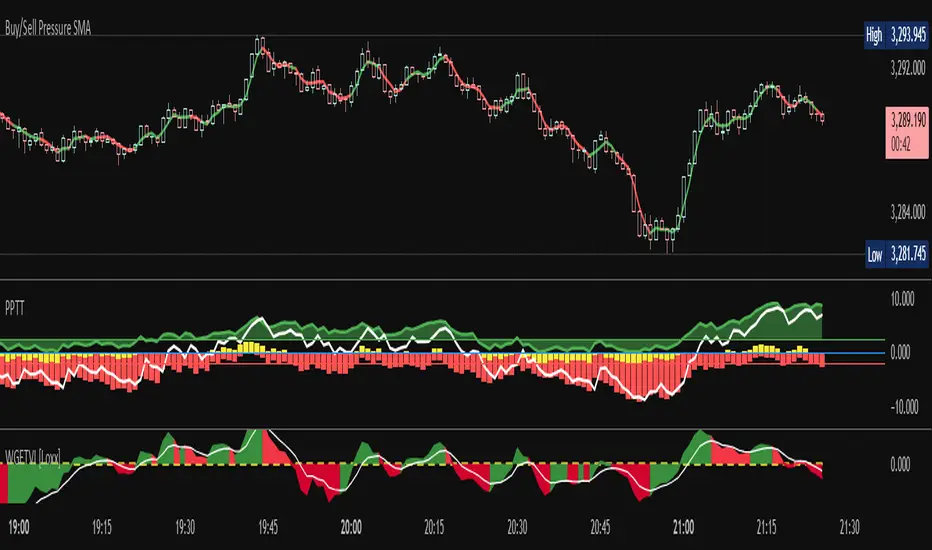
Buy/Sell Demand Pressure SMAThis indicator shows when competing buying and selling pressure has changed.
When bullish buying offsets bearish transaction volume, the indicator turns green. When bearish selling pressure offsets bullish buying volume the indicator is red.
Can be used as a normal SMA or to confirm buy/sell signals of other indicators.
Works best at the start of trades...and not exits but if set properly, it is a good indicator of when a trend has reversed.
~ jb tuttle
Trailing TP Bot • Crossover-based Trend Strategy using two simple moving averages (SMAs)
• Includes Take Profit and optional Trailing Take Profit
• Trades both long and short
• No pyramiding, i.e., one position at a time

EMA X/Y🔍 EMA X/Y Indicator Description
This indicator combines two different EMA ( Exponential Moving Average ) values into a single script, allowing you to visualize both short-term and long-term trends on the same chart.
📌 X: First EMA length (typically for short-term trends)
📌 Y: Second EMA length (typically for long-term trends)
🎯 Purpose:
– Track overall trend direction and potential reversals
– Generate buy/sell signals based on EMA X and Y crossovers
– Analyze market momentum across timeframes

Opaline Color ChangeONLY USE for serious full time trading strategy, or running away from Military/City.
Multi Kernel Regression with Alert.

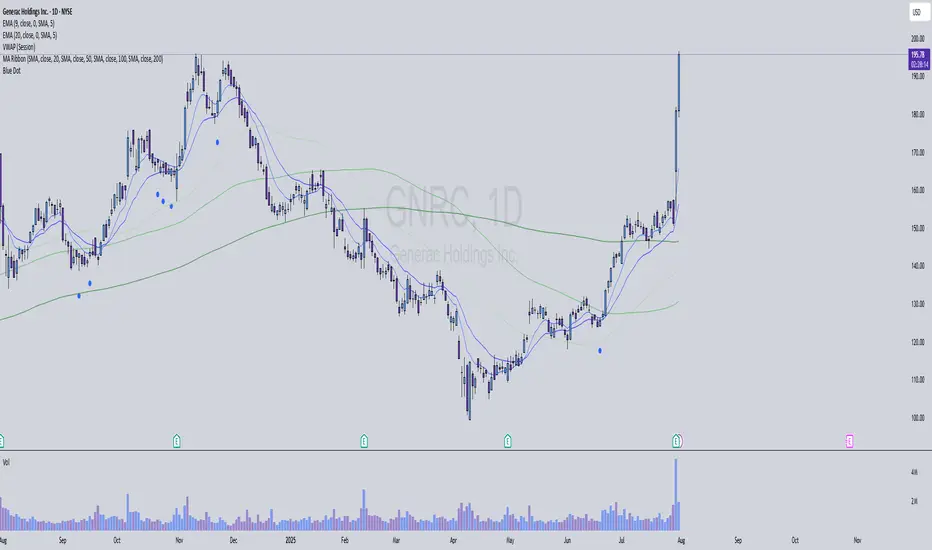
Blue DotThis indicator identifies high-probability long entry signals by combining stochastic momentum analysis with moving average trend confirmation. It's designed to catch oversold bounces in stocks that are already in established uptrends.
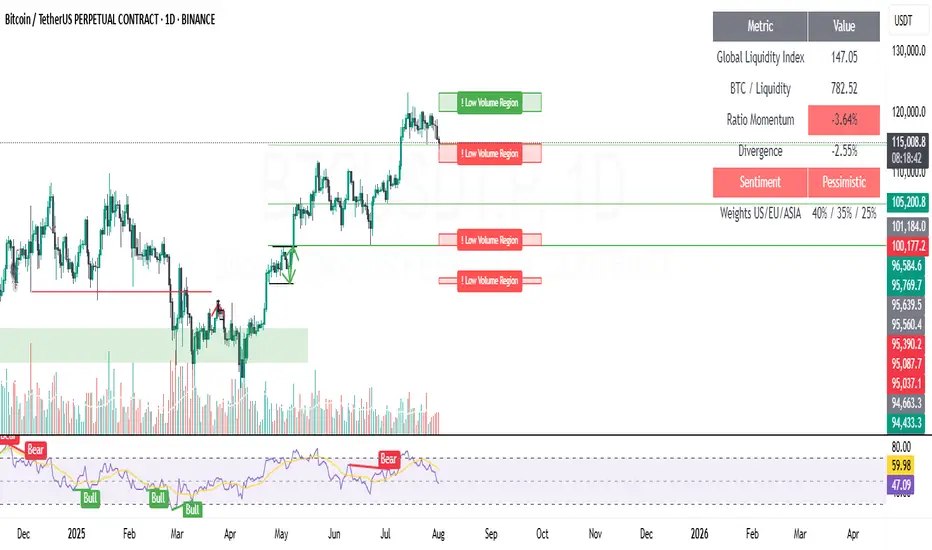
Low Volume Regions (Captura de liquidez)"Low Volume Regions"
Detects and highlights price zones where Bitcoin rapidly moved through with unusually low traded volume—approximating low-volume nodes. Adjacent sparse-volume bins are merged into cleaner regions. Zones above the current price are green, below are red; the emptiest zone (strongest low-volume signature) is tagged with “! Low Volume Region.” Opacity encodes scarcity: darker/less transparent means lower volume. Designed to surface liquidity capture areas likely to be revisited.
This indicator identifies and visualizes “low volume regions” in the price action of Bitcoin—price areas that were traversed quickly with little trading activity, creating potential liquidity gaps that the market may later revisit. These regions approximate what traders refer to as low-volume nodes (LVNs) or thin zones on a volume profile, without relying on native volume-profile data.
How it works:
It analyzes the last N candles (configurable lookback) and divides the price range into discrete bins.
Volume is accumulated per bin based on historical closes to estimate where trading was sparse.
Bins with volume below a chosen percentile threshold are marked as low-volume.
Nearby low-volume bins are merged into broader regions to reduce clutter and reflect meaningful sparse-volume zones.
Each merged zone’s average volume is used to compute a “scarcity” score; zones with comparatively less volume are rendered more opaque (stronger visual emphasis).
Zones above the current price are colored green, zones below are colored red.
The most extreme low-volume region (the one with the lowest relative volume) is flagged with the label “! Low Volume Region”, while others are labeled “Low Volume Region”.
Visuals:
Filled boxes (zones) show aggregated low-volume price regions projected forward.
Opacity scales: emptier (lower volume) regions are darker/less transparent.
Single label per region indicates its nature; the strongest zone includes an exclamation mark prefixed to the label.
Color indicates relative position to current price (bullish above / bearish below).
Key inputs / parameters:
lookback: Number of candles to include in the volume analysis window.
binsCount: Granularity of price partitioning.
percentileThreshold: Defines how “low” volume must be to qualify (e.g., 25 picks the bottom 25% by volume).
zoneWidthBars: How far the detected region extends to the right for visibility.
mergeGapFactor: Controls how aggressively adjacent low-volume bins are merged.
Interpretation:
Traders can use these regions as potential areas of liquidity capture or imbalance. Price often revisits such thin zones to fill them (retracement) before continuing in the prevailing direction. The highlighted “strongest” zone (with the exclamation) is the most pronounced candidate for such behavior.
Usage tips:
Combine with overall trend/context to decide if a revisit is a corrective opportunity or a trap.
Use the zones as potential support/resistance or entries/exits when price returns.
Adjust lookback and binsCount to suit the time frame (higher lookback + more bins for higher timeframes).
Limitations:
This is an approximation of volume-profile behavior using only candle close-based binning; it does not replace full-profile footprint or order-book analysis.
Zones are recalculated on the latest candle only to reduce clutter; historical persistence or revisit detection must be handled externally if needed.
Example use case:
On a daily BTC chart, a sharp green candle that quickly leaps above a narrow consolidation with low volume leaves behind a “Low Volume Region.” If price later retraces, traders watch that zone for potential liquidity capture or a bounce.
Triple MA Buy & Sell SignalsTriple MA Buy & Sell Signals Indicator
This indicator is designed to help traders identify high-probability entry points based on the combination of three moving averages (8, 50, and 200) while filtering signals in the direction of the main trend.
How It Works
Trend Filter (200 MA)
If the price is above the 200 MA, only BUY signals are displayed.
If the price is below the 200 MA, only SELL signals are displayed.
8 MA and 50 MA Cross (Regular Signals)
BUY (Green): When the 8 MA crosses above the 50 MA, and the price is above the 200 MA.
SELL (Red): When the 8 MA crosses below the 50 MA, and the price is below the 200 MA.
8 MA and 200 MA Cross (Major Trend Signals)
BUY (Yellow): When the 8 MA crosses above the 200 MA.
SELL (Yellow): When the 8 MA crosses below the 200 MA.
Purpose
This indicator is particularly useful for traders who follow Smart Money Concepts (SMC) or ICT-based strategies, as it helps:
Identify trend direction with the 200 MA.
Spot short-term trade entries using the 8/50 MA cross.
Highlight major trend reversals using the 8/200 MA cross.
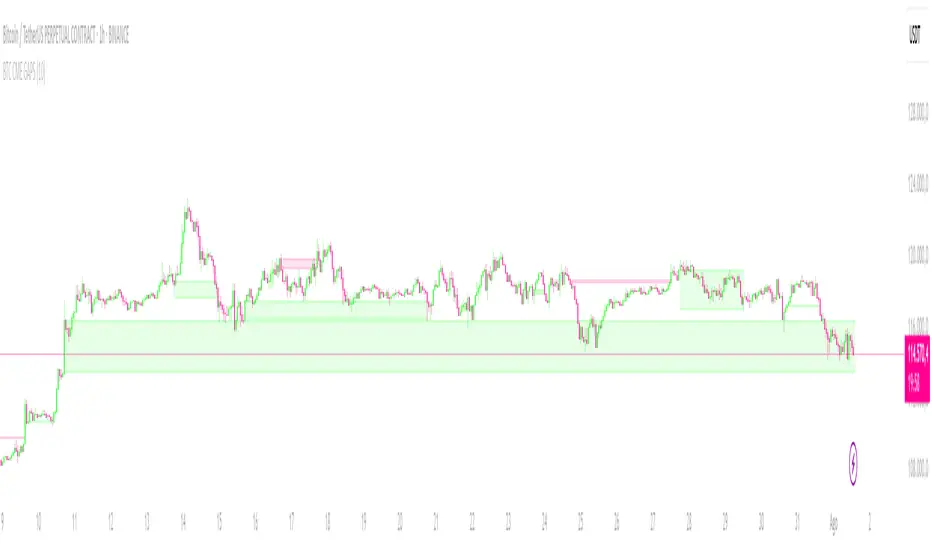
CRYPTO CME GAPS- Can be used in any crypto symbol of any exchange, (not necessarily the CME exchange)
- Displays the CME gaps with the colors green or red depending on the sentiment of the gap
- Extends the gaps displayed until they are filled.
- In the end of the code there are the boolean values 'filled_bull' and 'filled_bear' that can be used to create a strategy script.
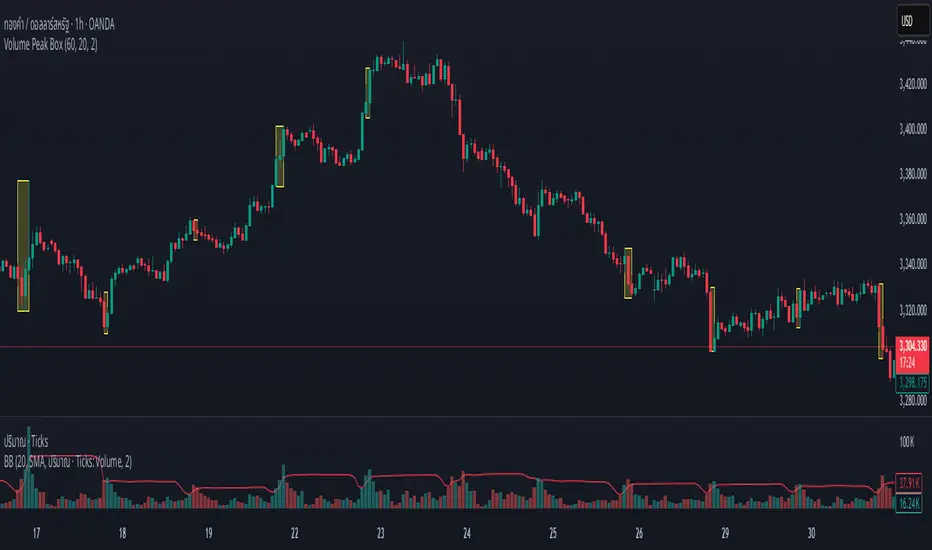
Volume Peak BoxTH Description
Volume Peak Box
อินดิเคเตอร์นี้ใช้ตรวจจับช่วงที่มี Volume สูงผิดปกติ โดยใช้ Bollinger Band กับข้อมูล Volume ที่ดึงจาก Timeframe ที่ล็อกไว้ (เช่น 1 ชั่วโมง) และจะแสดงผลในรูปแบบ กล่องครอบช่วงราคาสูง–ต่ำ ของช่วง Volume Peak นั้น
🔧 วิธีทำงาน:
คำนวณ Bollinger Band จาก Volume ของ Timeframe ที่กำหนด
ถ้า Volume สูงกว่า Upper Band → ถือว่าเป็น Volume Peak
วาดกล่องครอบ High–Low ของแท่งที่อยู่ในช่วง Volume Peak
กล่องจะแสดงบนทุก Timeframe แต่ใช้ข้อมูลจาก Timeframe ที่ล็อกไว้เท่านั้น
🧠 เหมาะสำหรับการดู:
โซน Breakout
การเคลื่อนไหวของสถาบัน
ความไม่สมดุลของอุปสงค์/อุปทาน
เหมาะมากหากใช้ร่วมกับการอ่านพฤติกรรมราคาใน Timeframe ย่อย เพื่อดูปฏิกิริยาราคาต่อแรง Volume จาก Timeframe ใหญ่
________________
ENG Description
Volume Peak Box
This indicator detects volume spikes based on Bollinger Bands applied to volume from a locked timeframe (e.g. 1H), and draws a box around the price range during those peak periods.
🔧 How it works:
Calculates Bollinger Bands on volume from the selected timeframe.
If volume exceeds the upper band, it is marked as a volume peak.
When a volume peak starts and ends, the indicator draws a box covering the high–low price range during that period.
These boxes remain visible on all timeframes, but always reflect data from the locked timeframe.
🧠 Great for identifying:
Breakout zones
Institutional activity
Supply/demand imbalances
Tip: Use with lower timeframe price action to see how the market reacts near volume peaks from higher timeframes.