EPS+Sales+Net Profit+MCap+Sector & Industry📄 Full Description
This script displays a comprehensive financial data panel directly on your TradingView chart, helping long-term investors and swing traders make informed decisions based on fundamental trends. It consolidates key financial metrics and business classification data into a single, visually clear table.
🔍 Key Features:
🧾 Financial Metrics (Auto-Fetched via request.financial):
EPS (Earnings Per Share) – Displayed with trend direction (QoQ or YoY).
Sales / Revenue – In ₹ Crores (for Indian stocks), trend change also included.
Net Profit – Also in ₹ Crores, along with percentage change.
Market Cap – Automatically calculated using outstanding shares × price, shown in ₹ Cr.
Free Float Market Cap – Based on float shares × price, also in ₹ Cr.
🏷️ Sector & Industry Info:
Automatically identifies and displays the Sector and Industry of the stock using syminfo.sector and syminfo.industry.
Displayed inline with metrics, making it easy to know what business the stock belongs to.
📊 Table View:
Compact and responsive table shown on your chart.
Columns: Date | EPS | QoQ | Sales | QoQ | Net Profit | QoQ | Metrics
Metrics column dynamically shows:
Market Cap
Free Float
Sector (Row 4)
Industry (Row 5)
🌗 Appearance:
Supports Dark Mode and Mini Mode toggle.
You can also customize:
Number of data points (last 4+ quarters or years)
Table position and size
🎯 Use Case:
This script is ideal for:
Fundamental-focused traders who use EPS/Sales trends to identify momentum.
Swing traders who combine price action with fundamental tailwinds.
Portfolio builders who want to see sector/industry alignment quickly.
It works best with fundamentally sound stocks where earnings and profitability are a major factor in price movements.
✅ Important Notes:
Script uses request.financial which only works with supported symbols (mostly stocks).
Market Cap and Free Float are calculated in ₹ Crores.
All financial values are rounded and formatted for readability (e.g., 1,234 Cr).
🙏 Credits:
Developed and published by Sameer Thorappa
Built with a clean, minimalist approach for high readability and functionality.
Indicators and strategies
Nifty Trend Dashboard with RSIthis is for learning purpose only. it will show current trend and overall trend

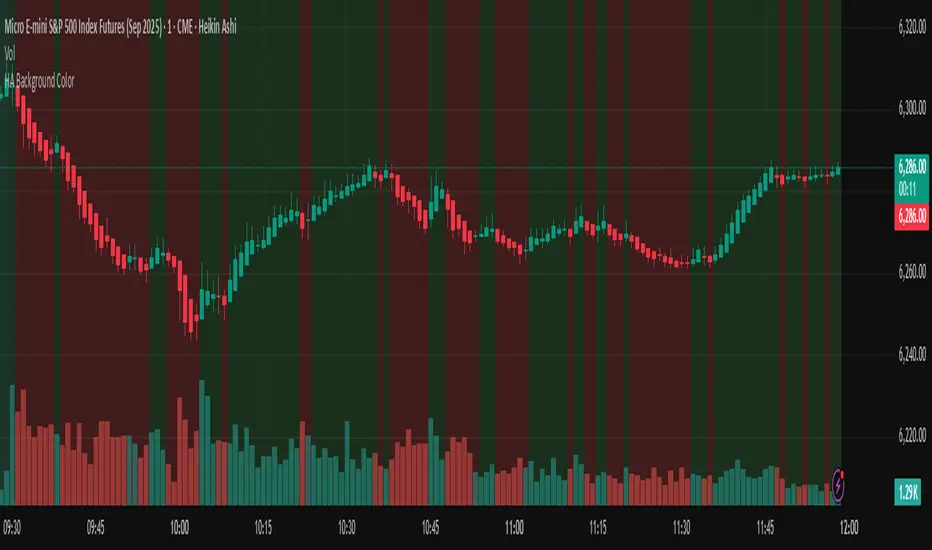
HA Background ColorThis indicator colors the entire chart background based on the current Heikin Ashi candle direction:
🟩 Green background = Bullish Heikin Ashi candle
🟥 Red background = Bearish Heikin Ashi candle
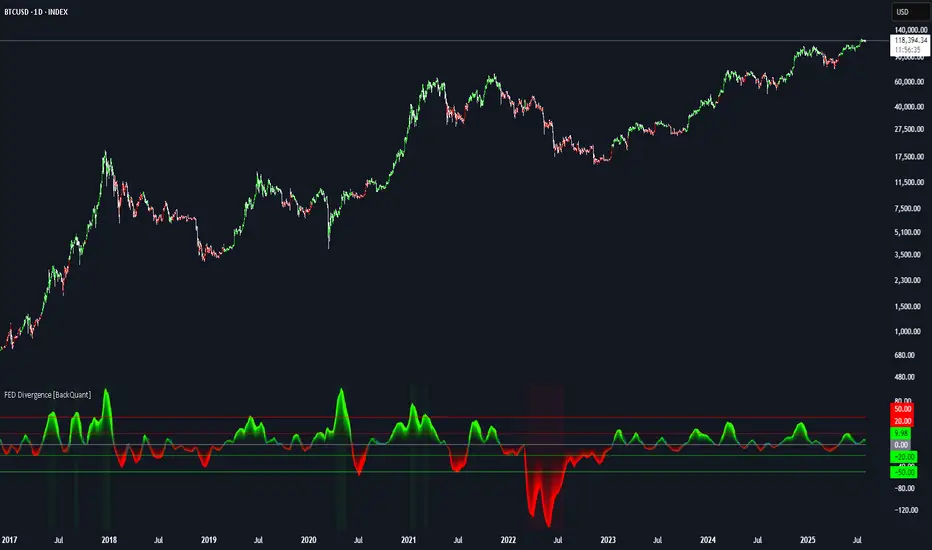
FEDFUNDS Rate Divergence Oscillator [BackQuant]FEDFUNDS Rate Divergence Oscillator
1. Concept and Rationale
The United States Federal Funds Rate is the anchor around which global dollar liquidity and risk-free yield expectations revolve. When the Fed hikes, borrowing costs rise, liquidity tightens and most risk assets encounter head-winds. When it cuts, liquidity expands, speculative appetite often recovers. Bitcoin, a 24-hour permissionless asset sometimes described as “digital gold with venture-capital-like convexity,” is particularly sensitive to macro-liquidity swings.
The FED Divergence Oscillator quantifies the behavioural gap between short-term monetary policy (proxied by the effective Fed Funds Rate) and Bitcoin’s own percentage price change. By converting each series into identical rate-of-change units, subtracting them, then optionally smoothing the result, the script produces a single bounded-yet-dynamic line that tells you, at a glance, whether Bitcoin is outperforming or underperforming the policy backdrop—and by how much.
2. Data Pipeline
• Fed Funds Rate – Pulled directly from the FRED database via the ticker “FRED:FEDFUNDS,” sampled at daily frequency to synchronise with crypto closes.
• Bitcoin Price – By default the script forces a daily timeframe so that both series share time alignment, although you can disable that and plot the oscillator on intraday charts if you prefer.
• User Source Flexibility – The BTC series is not hard-wired; you can select any exchange-specific symbol or even swap BTC for another crypto or risk asset whose interaction with the Fed rate you wish to study.
3. Math under the Hood
(1) Rate of Change (ROC) – Both the Fed rate and BTC close are converted to percent return over a user-chosen lookback (default 30 bars). This means a cut from 5.25 percent to 5.00 percent feeds in as –4.76 percent, while a climb from 25 000 to 30 000 USD in BTC over the same window converts to +20 percent.
(2) Divergence Construction – The script subtracts the Fed ROC from the BTC ROC. Positive values show BTC appreciating faster than policy is tightening (or falling slower than the rate is cutting); negative values show the opposite.
(3) Optional Smoothing – Macro series are noisy. Toggle “Apply Smoothing” to calm the line with your preferred moving-average flavour: SMA, EMA, DEMA, TEMA, RMA, WMA or Hull. The default EMA-25 removes day-to-day whips while keeping turning points alive.
(4) Dynamic Colour Mapping – Rather than using a single hue, the oscillator line employs a gradient where deep greens represent strong bullish divergence and dark reds flag sharp bearish divergence. This heat-map approach lets you gauge intensity without squinting at numbers.
(5) Threshold Grid – Five horizontal guides create a structured regime map:
• Lower Extreme (–50 pct) and Upper Extreme (+50 pct) identify panic capitulations and euphoria blow-offs.
• Oversold (–20 pct) and Overbought (+20 pct) act as early warning alarms.
• Zero Line demarcates neutral alignment.
4. Chart Furniture and User Interface
• Oscillator fill with a secondary DEMA-30 “shader” offers depth perception: fat ribbons often precede high-volatility macro shifts.
• Optional bar-colouring paints candles green when the oscillator is above zero and red below, handy for visual correlation.
• Background tints when the line breaches extreme zones, making macro inflection weeks pop out in the replay bar.
• Everything—line width, thresholds, colours—can be customised so the indicator blends into any template.
5. Interpretation Guide
Macro Liquidity Pulse
• When the oscillator spends weeks above +20 while the Fed is still raising rates, Bitcoin is signalling liquidity tolerance or an anticipatory pivot view. That condition often marks the embryonic phase of major bull cycles (e.g., March 2020 rebound).
• Sustained prints below –20 while the Fed is already dovish indicate risk aversion or idiosyncratic crypto stress—think exchange scandals or broad flight to safety.
Regime Transition Signals
• Bullish cross through zero after a long sub-zero stint shows Bitcoin regaining upward escape velocity versus policy.
• Bearish cross under zero during a hiking cycle tells you monetary tightening has finally started to bite.
Momentum Exhaustion and Mean-Reversion
• Touches of +50 (or –50) come rarely; they are statistically stretched events. Fade strategies either taking profits or hedging have historically enjoyed positive expectancy.
• Inside-bar candlestick patterns or lower-timeframe bearish engulfings simultaneously with an extreme overbought print make high-probability short scalp setups, especially near weekly resistance. The same logic mirrors for oversold.
Pair Trading / Relative Value
• Combine the oscillator with spreads like BTC versus Nasdaq 100. When both the FED Divergence oscillator and the BTC–NDQ relative-strength line roll south together, the cross-asset confirmation amplifies conviction in a mean-reversion short.
• Swap BTC for miners, altcoins or high-beta equities to test who is the divergence leader.
Event-Driven Tactics
• FOMC days: plot the oscillator on an hourly chart (disable ‘Force Daily TF’). Watch for micro-structural spikes that resolve in the first hour after the statement; rapid flips across zero can front-run post-FOMC swings.
• CPI and NFP prints: extremes reached into the release often mean positioning is one-sided. A reversion toward neutral in the first 24 hours is common.
6. Alerts Suite
Pre-bundled conditions let you automate workflows:
• Bullish / Bearish zero crosses – queue spot or futures entries.
• Standard OB / OS – notify for first contact with actionable zones.
• Extreme OB / OS – prime time to review hedges, take profits or build contrarian swing positions.
7. Parameter Playground
• Shorten ROC Lookback to 14 for tactical traders; lengthen to 90 for macro investors.
• Raise extreme thresholds (for example ±80) when plotting on altcoins that exhibit higher volatility than BTC.
• Try HMA smoothing for responsive yet smooth curves on intraday charts.
• Colour-blind users can easily swap bull and bear palette selections for preferred contrasts.
8. Limitations and Best Practices
• The Fed Funds series is step-wise; it only changes on meeting days. Rapid BTC oscillations in between may dominate the calculation. Keep that perspective when interpreting very high-frequency signals.
• Divergence does not equal causation. Crypto-native catalysts (ETF approvals, hack headlines) can overwhelm macro links temporarily.
• Use in conjunction with classical confirmation tools—order-flow footprints, market-profile ledges, or simple price action to avoid “pure-indicator” traps.
9. Final Thoughts
The FEDFUNDS Rate Divergence Oscillator distills an entire macro narrative monetary policy versus risk sentiment into a single colourful heartbeat. It will not magically predict every pivot, yet it excels at framing market context, spotting stretches and timing regime changes. Treat it as a strategic compass rather than a tactical sniper scope, combine it with sound risk management and multi-factor confirmation, and you will possess a robust edge anchored in the world’s most influential interest-rate benchmark.
Trade consciously, stay adaptive, and let the policy-price tension guide your roadmap.
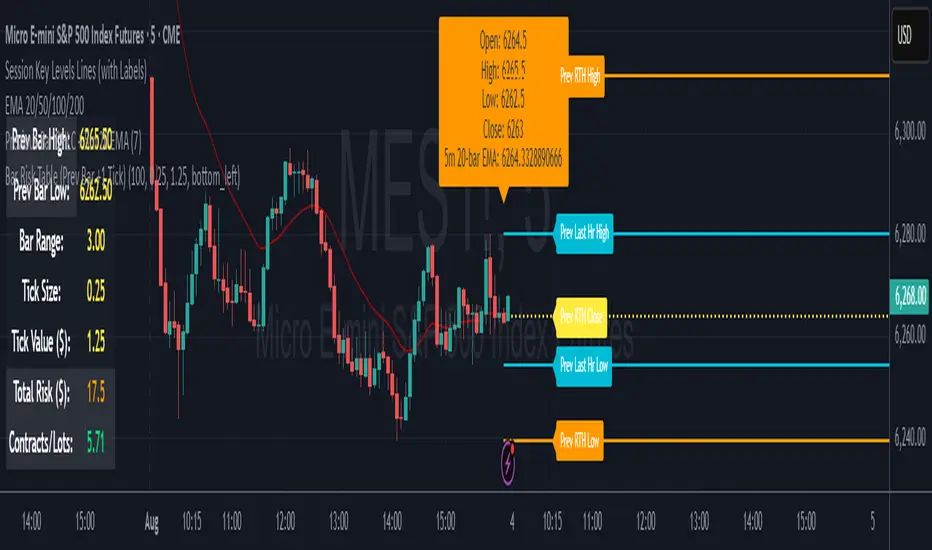
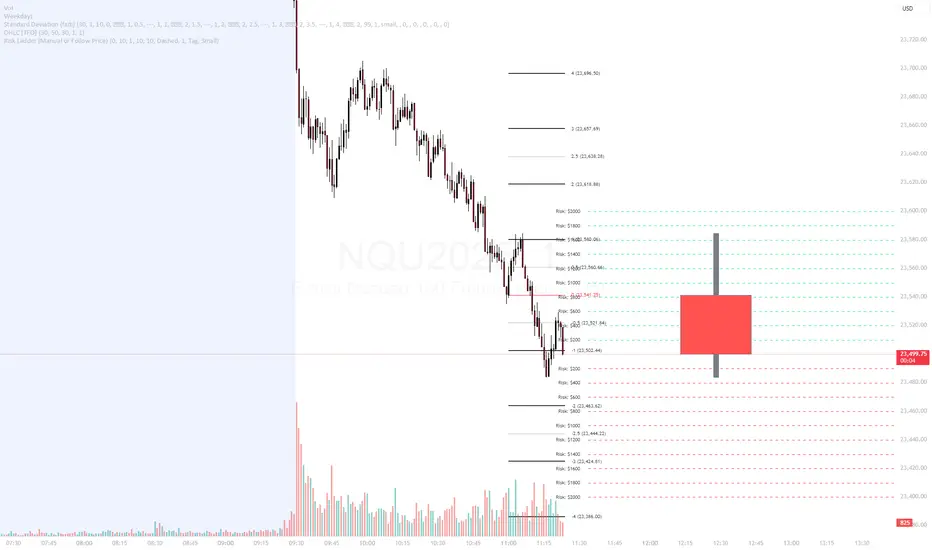
Risk Ladder📝 Description:
The Risk Ladder plots visual risk levels above and below a selected price, helping traders instantly assess risk exposure per contract across key price intervals.
This tool offers two modes:
✅ Live Mode – Automatically anchors to the current market price
✅ Manual Mode – Anchor the ladder to your custom trade entry price (e.g., after placing a position)
Each level displays the cumulative risk in dollars, calculated based on:
Contract size
Tick value for the symbol (auto-detected for ES, NQ, CL, etc.)
Distance from entry price
🎨 Fully Customizable:
Interval between levels (e.g. every 10 points)
Number of levels above/below
Line color, width, and style
Label size, shape (tag or box), color, and offset
Toggle between live or manual entry modes
💡 Use Cases:
Visualize risk tiers before or after entering a position
Define profit-taking and stop-loss zones based on risk multiples
Clean overlay to complement your price action, VWAP, or R:R strategy
🔁 How to Use:
Select whether to use manual entry or follow live price
Adjust your risk interval and contract size
Watch the ladder instantly reflect total risk every level
CnagdaCnagda Indicator ek comprehensive trading tool hai jo multiple technical analysis concepts ko combine karta hai:
special thanks to - tradingview.sweetlogin.com because its modify version of Breaks and Retests with Volatility Stop
Support & Resistance Detection - Dynamic pivot-based levels
Breakout & Retest System - Precise entry/exit signals
Anchored VWAP - Volume-weighted average price from swing points
Volatility Stop - Trend-following mechanism
Moving Average Crossovers - EMA/WMA signals
Smart Alerts - Real-time notifications
🔧 Key Features
Support & Resistance System
Lookback Range: 20 bars (customizable) se pivot points detect karta hai
Dynamic Boxes: Support/resistance levels ko visual boxes ke saath display
Auto-Extension: Levels ko future bars tak extend kar sakta hai
Color Coding: Support (Red) aur Resistance (Green) ke liye alag colors
Anchored VWAP System
Swing High/Low Anchoring: Major swing points se VWAP calculate karta hai
Volume Integration: Price aur volume dono consider karta hai
Dynamic Updates: Har naye swing point par reset hota hai
Visual Markers: Anchor points ko clearly mark karta hai
Breakout Detection
Real-time Alerts: Support/resistance break hone par instant notification
Confirmation Options: Candle close confirmation ya high/low based
Repainting Control: 3 modes - On/Off with different confirmation methods
📈 Entry/Exit Strategy Guide
BUY SIGNALS (Long Entry)
Primary Entry Conditions:
Support Retest Confirmed + Price Above Anchored VWAP
Entry: Support level ka successful retest
Stop Loss: Support level ke neeche 5-10 pips
Target: Next resistance level ya 1:2 Risk-Reward
Bullish MA Crossover + Above Volatility Stop (Green)
Entry: EMA(20) crosses above WMA(50)
Stop Loss: Volatility stop level
Target: Next resistance ya swing high
Resistance Breakout + Volume Confirmation
Entry: Clean breakout above resistance box
Stop Loss: Resistance level (ab support ban gaya)
Target: Measured move ya next major level
Confirmation Filters:
✅ Anchored VWAP upward trending
✅ Volatility Stop showing green (uptrend)
✅ Price above both moving averages
✅ Volume increase during breakout
SELL SIGNALS (Short Entry)
Primary Entry Conditions:
Resistance Retest Confirmed + Price Below Anchored VWAP
Entry: Resistance level ka successful retest
Stop Loss: Resistance level ke upar 5-10 pips
Target: Next support level ya 1:2 Risk-Reward
Bearish MA Crossover + Below Volatility Stop (Red)
Entry: EMA(20) crosses below WMA(50)
Stop Loss: Volatility stop level
Target: Next support ya swing low
Support Breakout + Volume Confirmation
Entry: Clean breakdown below support box
Stop Loss: Support level (ab resistance ban gaya)
Target: Measured move ya next major level
Confirmation Filters:
✅ Anchored VWAP downward trending
✅ Volatility Stop showing red (downtrend)
✅ Price below both moving averages
✅ Volume increase during breakdown
⚠️ Risk Management Rules
Position Sizing
Maximum Risk: 1-2% per trade
Stop Loss: Always mandatory
Position Size: Calculate based on stop distance
Exit Strategy
Profit Targets:
Target 1: 1:1 Risk-Reward (book 50%)
Target 2: 1:2 Risk-Reward (book remaining)
Trailing Stops:
Use Volatility Stop as trailing mechanism
Move stop to breakeven after 1:1 achieved
Time-based Exit:
Exit if no momentum within 5-10 bars
Avoid holding overnight without clear trend
🚨 Alert System
Available Alerts:
New Support/Resistance Levels
Breakout Confirmations
Retest Signals (Potential + Confirmed)
MA Crossovers (Bullish/Bearish)
Anchored VWAP Crosses
Volatility Stop Changes
Alert Messages (Hindi):
"EMA/WMA Bullish crossover hua hai, BUY!"
"EMA/WMA Bearish crossover hua hai, SELL!"
"Price Anchored VWAP ke upar break kar gaya!"
"Naya Anchored VWAP anchor point set hua hai!"
⚙️ Customization Options
Visual Settings:
Label Types: Full descriptions ya Simple (Br, Re, P.Re)
Label Sizes: Tiny to Huge
Colors: Fully customizable for all elements
Line Styles: Dotted, Dashed, Solid
Extensions: None, Right, Left, Both
Technical Parameters:
Lookback Range: 1-100 bars
Retest Detection: 1-20 bars
MA Lengths: Customizable EMA/WMA periods
Volatility Stop: Length aur multiplier adjustable
VWAP Anchoring: Swing detection sensitivity
📋 Best Timeframes
Recommended Usage:
Scalping: 1M, 5M (quick signals)
Day Trading: 15M, 30M, 1H (balanced approach)
Swing Trading: 4H, 1D (major levels)
Market Conditions:
Trending Markets: Excellent for breakout trades
Range-bound: Perfect for retest strategies
High Volatility: Volatility stop works best
Low Volume: Wait for volume confirmation
🎯 Performance Tips
Multi-timeframe Analysis: Higher timeframe trend + lower timeframe entry
Volume Confirmation: Always check volume during breakouts
Market Context: Consider overall market sentiment
News Events: Avoid trading during major announcements
Backtesting: Test on historical data before live trading

Market Energy – Trend vs RetestShows who is in control of the market. The red lines are sellers in control and the green are the buyers in control
DEMACROSSOVA BY FLACODouble EMAs for entry signals
ATR Bands for stoploss
Fibonacci bollinger bands for early exit confirmation

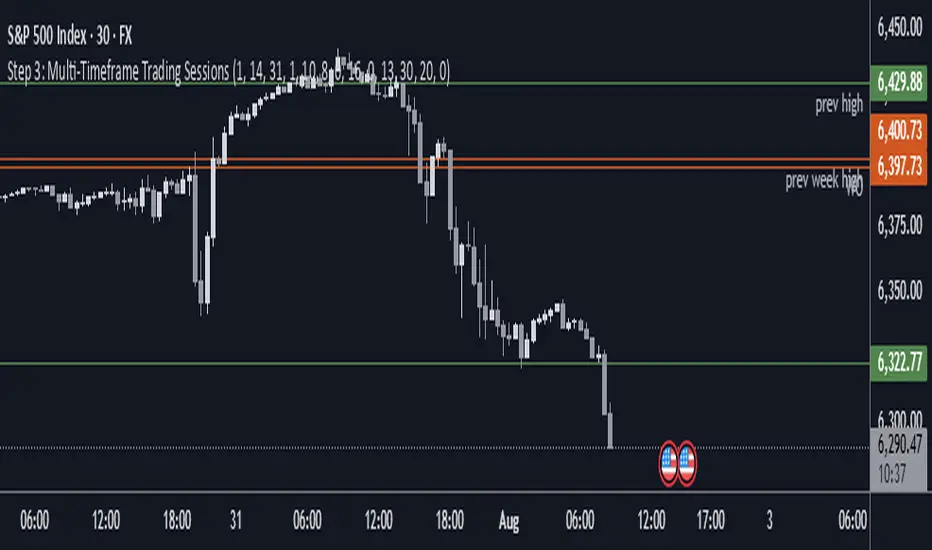
Step 3: Multi-Timeframe Trading SessionsFor editing purposes,
This is for editing purposes for developer to edit it before publishing.
Chaos Volume Trend //Chaos Volume Trend不公开提供,请在网站 okx.tw 购买
//Chaos Volume Trend不公開提供,請在網站 okx.tw 購買
//Chaos Volume Trend is not publicly available. Please purchase it on the website okx.tw

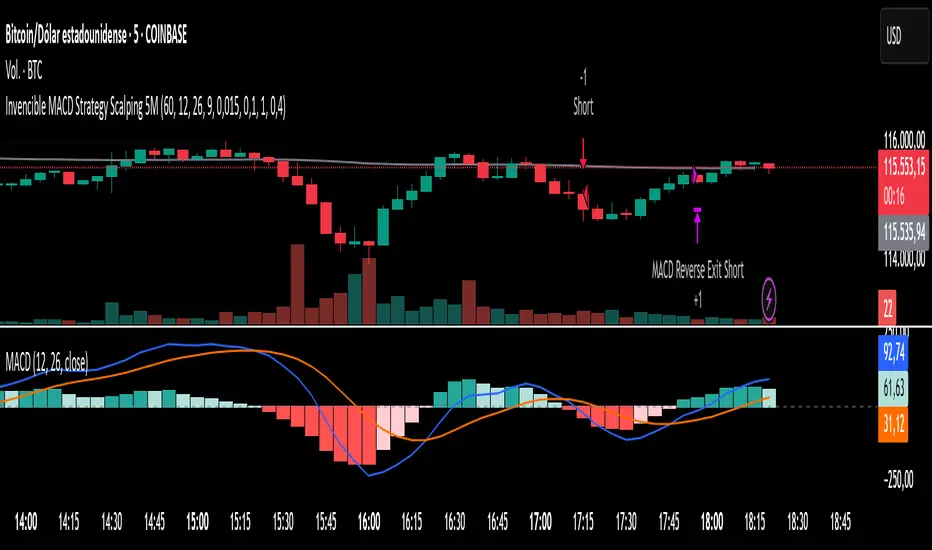
Invencible MACD Strategy Scalping 5MInvencible MACD Strategy Scalping 5M
The Invencible MACD Strategy is a precision scalping system designed for short-term traders who want to capture fast and effective entries on trending moves.
This strategy uses a multi-timeframe MACD combined with a histogram impulse filter, ATR-based volatility filter, and optional EMA200 trend confirmation to identify high-probability trade setups.
Entry Conditions:
Long Entry: When MACD crosses above Signal Line, histogram rises with sufficient impulse, ATR confirms volatility, and price is above EMA200 (optional).
Short Entry : When MACD crosses below Signal Line, histogram falls with sufficient impulse, ATR confirms volatility, and price is below EMA200 (optional).
Exit Conditions:
Take Profit and Stop Loss are calculated as fixed percentages.
A position is also closed immediately if MACD reverses and crosses in the opposite direction.
The strategy does not use trailing stops, allowing trades to fully reach their target when conditions are favorable.
Recommended use:
This strategy is optimized for 5-minute charts and works particularly well with:
XAUUSD (Gold)
BTCUSD (Bitcoin)
If you find this strategy helpful, please share it, leave a comment, and drop a like. Scalpers, give it a try and let us know how it works for you.
Los 7 Capitales
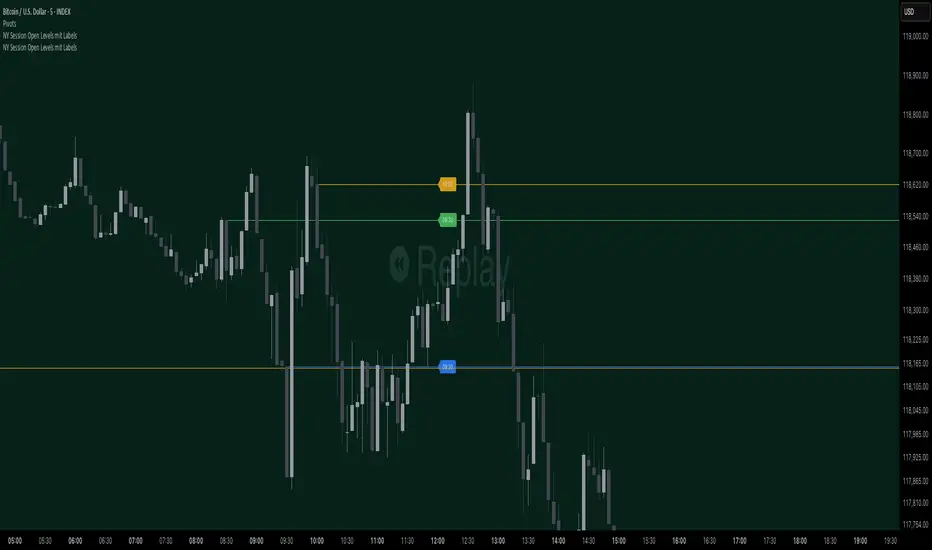
NY Session Open Levels This indicator automatically draws horizontal lines at the opening prices of the New York trading session at 08:30, 09:30, and 10:00 AM NY time. Each line is labeled and extended to the right, providing clear reference points for key intraday levels. The lines and labels reset daily and are ideal for identifying reaction zones during the early U.S. trading hours.

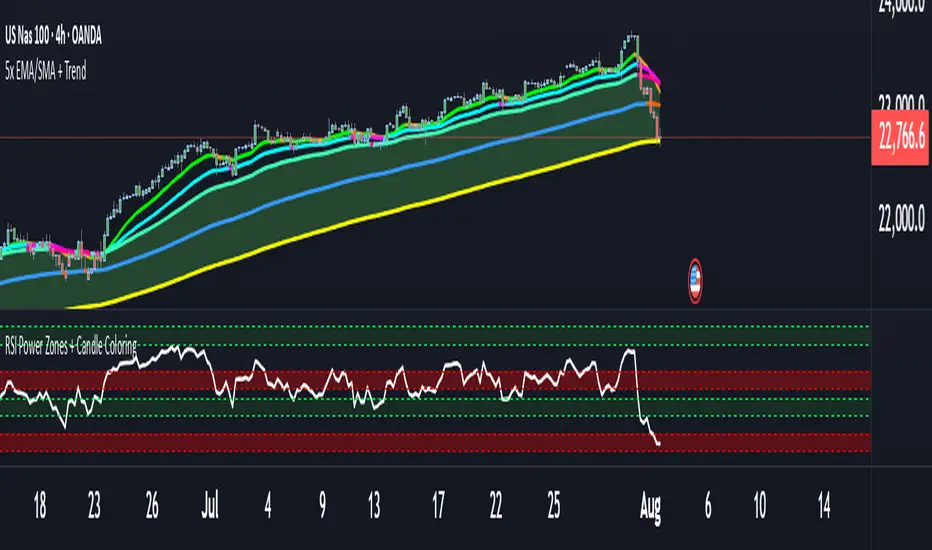
RSI Power Zones + Candle ColoringOk , So here is the newly revised PowerZones
With CAndle Coloring Showing you what the PowerZones Show you if it is in a bullish upTrend
or if the trend is currently in a downtrend
Along with my newly created indicator5x EMA/SMA Trend Indicator with the Cloud that coincides with new RSI PowerZones Indictor showing you the candles colored if it is bullish or Bearish Currently
Moving Average RibbonMoving Averages creating a what I call internally a "ribbon". Rename as see fit.

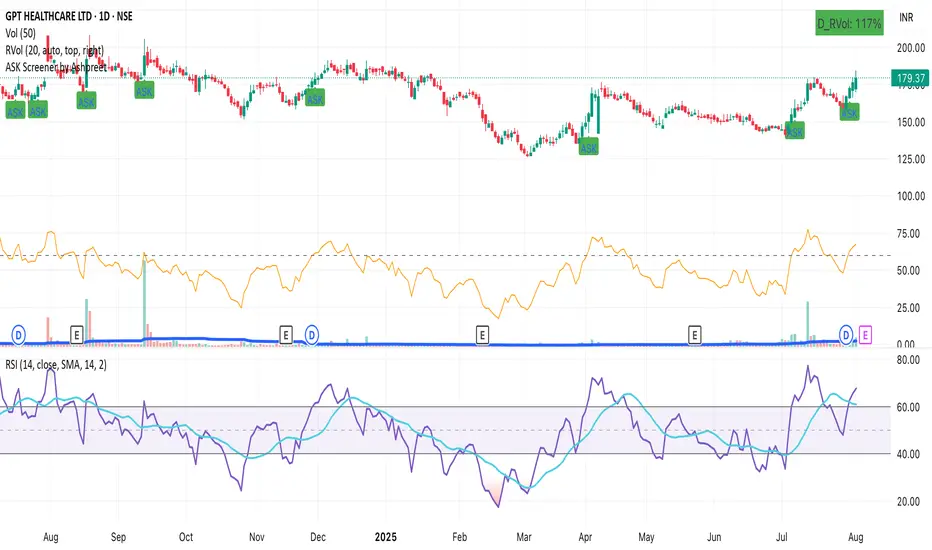
ASK Screener by AshpreetThe ASK Indicator is a custom-built breakout and trend continuation system designed for swing traders seeking high-probability entries with strong risk-reward ratios. Built using a combination of moving averages, momentum filters, volume confirmation, and price structure, this indicator helps identify stocks poised for explosive moves.
It uses three key moving averages: the 44-period SMA (medium trend), 20-period DEMA (short-term strength, custom-coded), and 50-period WEMA (institutional trendline). Trades are only triggered when the price is above 50 WEMA, and the 20 DEMA is above the 44 SMA.
Momentum is confirmed using RSI(14) within a healthy zone of 40–60, ensuring the stock is not overbought or oversold. To focus on breakout candidates, the stock must be trading within 10% of its 52-week high, and the weekly candle range must be under 10%, signaling compression before expansion.
A valid ASK Signal occurs when these conditions are met along with a breakout above the previous day’s high and volume exceeding 1.5× the 20-day average. Once triggered, the indicator auto-plots the stop-loss (1× ATR) and two profit targets: 1:2 (TP1) and 1:4 (TP2).
Additionally, the system detects a narrow range setup, where the last 3 daily candles are inside the previous 3-day range — a powerful consolidation signal. Alerts for both ASK entries and narrow ranges are included.
This system is ideal for positional and short-term swing traders who want to combine structure, momentum, and volume in one powerful tool.
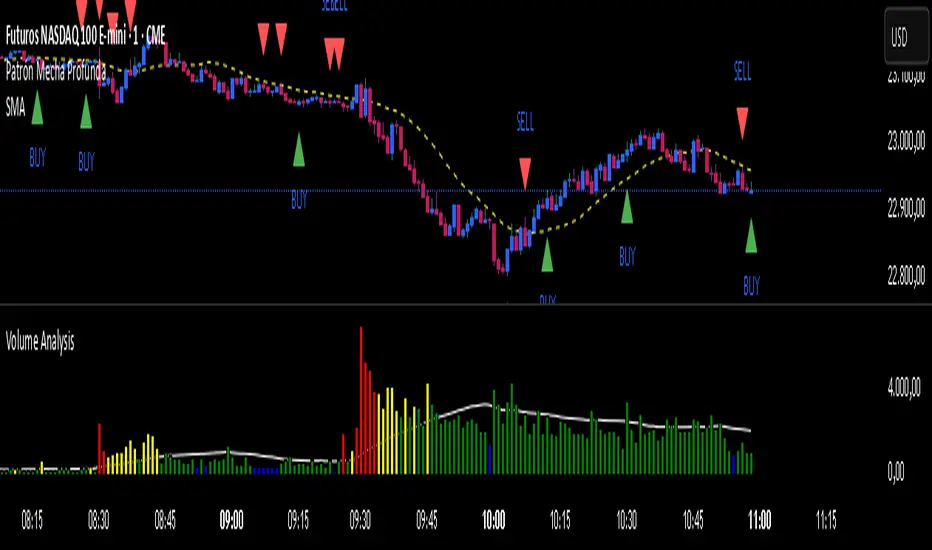
Patrón Mecha Profunda
This pattern must be combined with a 20-period moving average. It is used to know the direction of the price. When the pattern appears and the price is above the 20-period moving average, it is a bullish signal and vice versa.
NY Session Open Levels mit LabelsThis indicator automatically draws horizontal lines at the opening prices of the New York trading session at 08:30, 09:30, and 10:00 AM NY time. Each line is labeled and extended to the right, providing clear reference points for key intraday levels. The lines and labels reset daily and are ideal for identifying reaction zones during the early U.S. trading hours.
Momentum Commitment Delta (MCD)What it is
M C D fuses five micro-structure clues into one 0-to-1 score that says, “how hard are traders actually leaning on this move?”
1. Body-Delta Momentum – average net candle body direction.
2. Volume Commitment – up-volume ÷ down-volume over the same window.
3. Wick Compression – shrinking upper/lower wicks = clean conviction.
4. Candle Sequencing – rewards orderly, staircase-style body growth.
5. Pin Ratio – where the close pins inside each candle’s range.
The five factors are multiplied, then auto-normalized so extremes always land near 0 / 1 on any symbol or timeframe.
I recommend tweaking the settings to fit your edge, the pre-loaded settings may not be suitable for most traders. The MCD works on all timeframes as well :)
⸻
How to read basic signals
• Fresh cross above 0.70 → often the birth of a real breakout.
• Cluster of > 0.70 bars → “commitment lock,” pull-backs usually shallow.
• Price makes new high while M C D doesn’t → beware...
• Cross back below 0.30 after a run → momentum is out of fuel.
⸻
Because M C D is multiplicative, it’s hard to hit the extremes—so when the bars light lime green, the print is usually telling the truth.
I personally use the MCD to identify the peak of a high-conviction range, NOT a breakout. If a bar prints over 0.70 (green) and then a range forms off of the bar which exceeded 0.70, the breakout has a high chance to be explosive, regardless of what MCD reads at the breakout inflection point.
Play around with it, im sure there are plenty of other patterns.
Disclaimer: The Momentum Commitment Delta (MCD) indicator is provided strictly for educational and informational purposes. It does not constitute financial or investment advice, nor is it a recommendation to buy or sell any security. Trading involves substantial risk, and you should always perform your own due diligence and consult a qualified financial professional before making any trading decisions. Past performance is not indicative of future results.
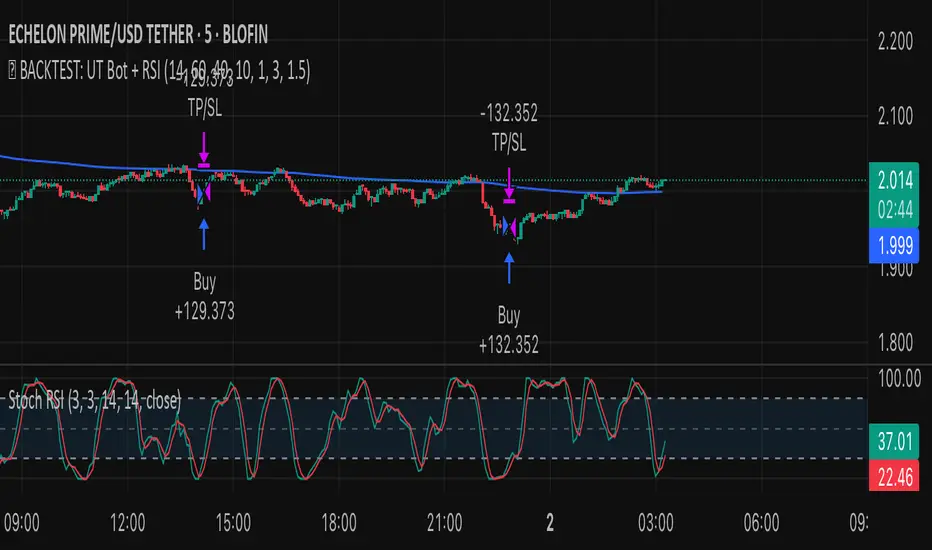
✅ BACKTEST: UT Bot + RSIRSI levels widened (60/40) — more signals.
Removed ATR volatility filter (to let trades fire).
Added inputs for TP and SL using ATR — fully dynamic.
Cleaned up conditions to ensure alignment with market structure.