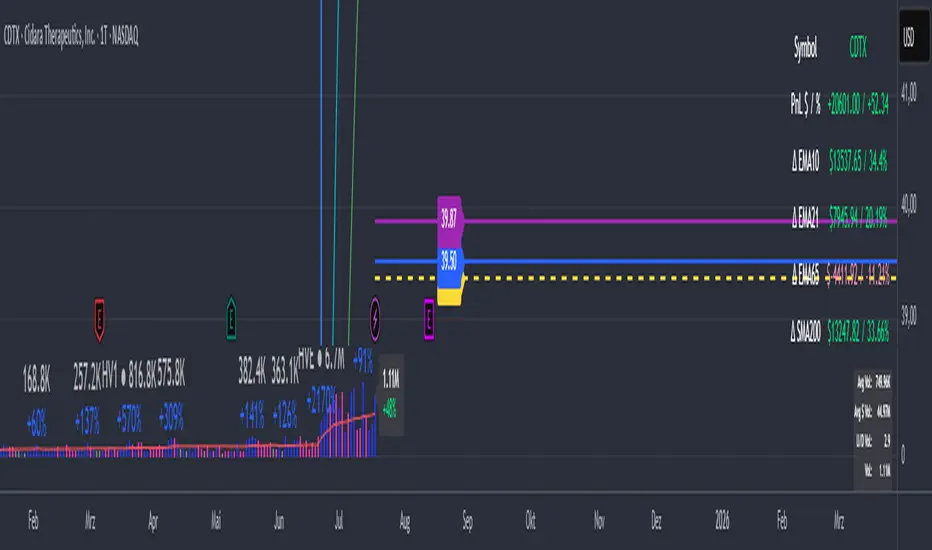
PnL_EMA_TRACK12_PRO_3.3_full_adjusted# Multi-Ticker Support
Manage up to 12 tickers simultaneously.
- For each symbol, input share quantities, entry prices, and two optional additional entry points (E2, E3) with their own shares and offset percentages.
- Dynamic handling of inputs using arrays for easier maintenance and scalability.
# Average Cost and PnL Calculation
- Computes weighted average entry costs across all position parts (E1 and optionally E2 and E3).
- Calculates real-time Profit & Loss (PnL) both in USD and percentage relative to the current price.
- Color-coded values: green for profit, red for loss — for quick visual feedback.
# Moving Averages as Benchmarks
- Uses daily EMAs (10, 21, 65) and 15-minute SMA 200 as reference levels.
- Calculates percentage deviations of these moving averages from the average entry price.
- Calculates dollar differences based on the total shares held.
# Chart Visualization
- Draws a dashed yellow line for the average cost of each position.
- Optionally draws two additional lines and labels for E2 (blue) and E3 (purple) if activated.
- Lines extend to the right to emphasize current relevance.
- Labels can be positioned left or right, with customizable horizontal offset.
# Interactive Table in Chart
- Positions the info table in any chosen corner or center of the chart (top/right/left/middle, etc.).
- Displays symbol, PnL (dollar and percentage), and deviations to key EMAs and SMA.
- Colors PnL values according to profit or loss for instant clarity.
# User-Friendly Settings
- Flexible font size options for both the table and labels.
- Customizable colors for positive and negative values (default green/red).
- Choice of label position and X-axis offset to fit your chart style.
Indicators and strategies
Daily Vertical LinesThe Vertical line to divide the day breaks with a dotted line.
This helps to identify the day end and start.
I find it most helpful while back testing.

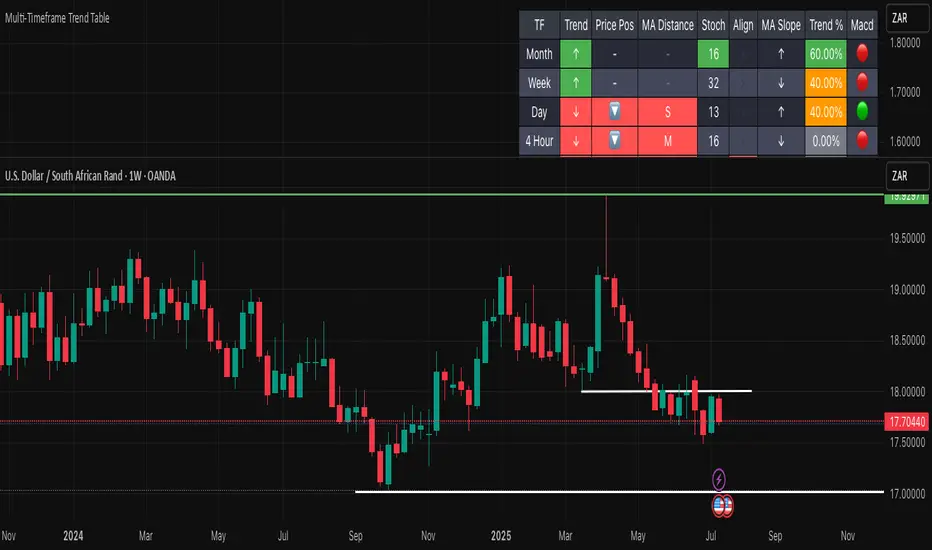
Multi-Timeframe Trend TableThis is an adaptation of the Multi-Timeframe Trend Table by feliperazeek . I have made it possible to change the time frames. I've messaged him to see if he wants to change it to include my amendments.
Khalid SPX Indicator - Auto WeeklyKey Features:
Levels for publishing: We define three levels: low, mid, and high.
Alerts: The script checks for price crosses over the mid-level. Alerts are set up using alertcondition() so you can be notified when the price crosses these levels.
Background Color: The background changes color when the price crosses the mid-level to visually indicate the event.
How to use this script:
Apply the Script: Apply this indicator on TradingView.
Set Alerts: After applying the indicator, you can set up alerts in TradingView using the alertcondition that we defined in the script.
Click the Alert button on TradingView.
Choose the conditions for your alert (e.g., "Price Cross Up" or "Price Cross Down").
You can set up webhook notifications in the alert settings to "publish" the data elsewhere (e.g., send it to a server or API).
Publisher via Alerts:
Once the alert triggers, you can configure webhooks to send the alert data to an external server, allowing you to "publish" the data elsewhere.
In the alert creation window, enable the Webhook URL and provide the URL to which the data should be sent.
Confluence AVWAP Breakout RibbonThis advanced indicator overlays up to five Anchored VWAPs—Daily Session, Weekly, Monthly, Prior Swing High, and Prior Swing Low—directly onto your chart. It highlights a "confluence ribbon" between these levels, visually mapping the real-time price zone where institutional activity may cluster. The ribbon is colored dynamically so you can instantly spot which side of value price is breaking towards.
How it works:
• The script automatically recalculates each selected VWAP anchor in real time.
• For swing-high and swing-low anchors, it starts a new VWAP every time a new price swing is confirmed.
• You can enable or disable any anchor via the script’s Inputs panel to suit your trading style or asset.
Entry Signals:
• A long breakout (green up-arrow) triggers only on the first candle that closes above all active VWAP anchors.
• A short breakout (red down-arrow) triggers only on the first close below all active anchors.
• These signals help confirm when price makes a decisive move out of a key value zone, filtering out false or weak breakouts.
How to use:
Add the indicator to any chart or timeframe.
In the Inputs, choose which VWAP anchors to activate.
Watch for the ribbon color and width: a wider ribbon means more confluence between price zones.
Trade signals (arrows) are only painted on the first candle to break out above or below all anchors, making them easy to see and avoiding repaint.
Optional: Set up alerts using the built-in TradingView alerts for each breakout direction.
Customization:
• Toggle each anchor on/off for your preferred strategy.
• Adjust the swing length for pivots.
• Change ribbon opacity for better chart visibility.
Why it’s unique:
• Most VWAP scripts only plot a single line, or show basic session anchors.
• This indicator lets you stack up to five important VWAP anchors and requires consensus: price must clear all active anchors in one move to signal a breakout.
• The live ribbon and dynamic visuals provide clear confluence zones and breakout cues that go beyond traditional VWAP use.
Best practices:
• Works well on all major assets (stocks, crypto, FX, indices) and all chart timeframes.
• For highest reliability, use two or more anchors at a time.
• Consider using alongside your preferred trend or volatility filter.
For educational and research purposes only. This is not financial advice or a recommendation to buy or sell. Always use proper risk management and test before live trading.

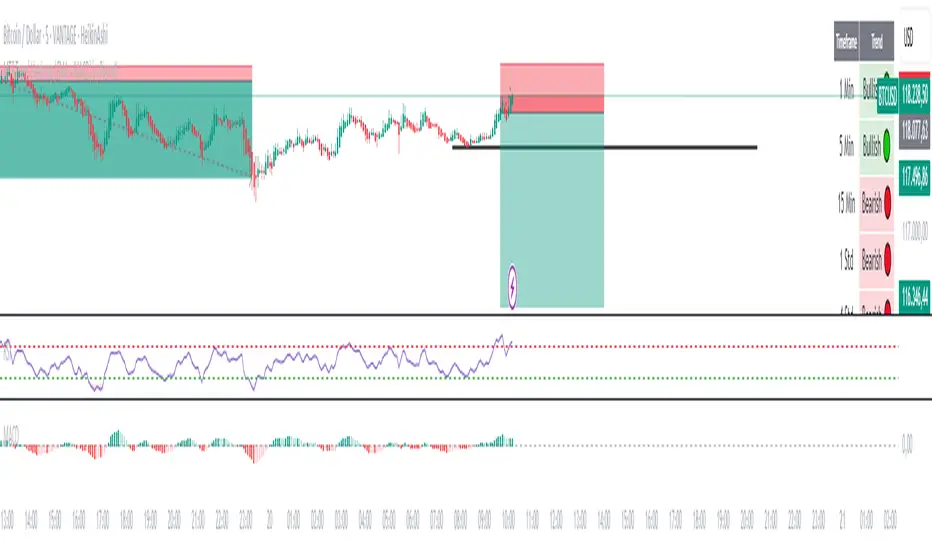
MTF Trend Heatmap (EMA + MACD) by PierreKMTF Trend Heatmap (EMA + MACD) by PierreK
This indicator offers a compact and clear heatmap that visualizes the current trend status of an instrument across multiple key timeframes. Based on the combination of the EMA 50 and EMA 200, as well as the MACD indicator, the heatmap shows whether the trend is bullish (green dot) or bearish (red dot) on the 1-minute, 5-minute, 15-minute, 1-hour, 4-hour, and 1-day timeframes.
Highlights:
• Multi-timeframe analysis at a glance - perfect for traders who want to keep an eye on multiple timeframes.
• Clearly defined trend logic: EMA 50 > EMA 200 and MACD above signal and zero line.
‣ Simple color scheme for quick trend decisions.
Optimized for all markets and assets (forex, stocks, cryptocurrencies, etc.).
• Chart overload - heatmap as a separate, clearly positioned table.
Ideal for day traders, swing traders, and anyone who needs quick trend overviews for their trading.
FAQ
Q. Which markets is the indicator suitable for?
A: The indicator works universally on forex, stocks, cryptocurrencies, and other TradingView symbols.
Q: Can I add additional timeframes?
A: Currently, 1m, 5m, 15m, 1h, 4h, and 1d are preset. Adjustments are possible in the code if you are familiar with Pine Script.
Q: How accurate is the trend determination?
A: The trend is determined very reliably using the combination of the EMA 50/200 and MACD (via the signal line and the zero line).
Q: Can I use alerts with this indicator?
A: Alerts are not included in the standard script, but can be added individually.
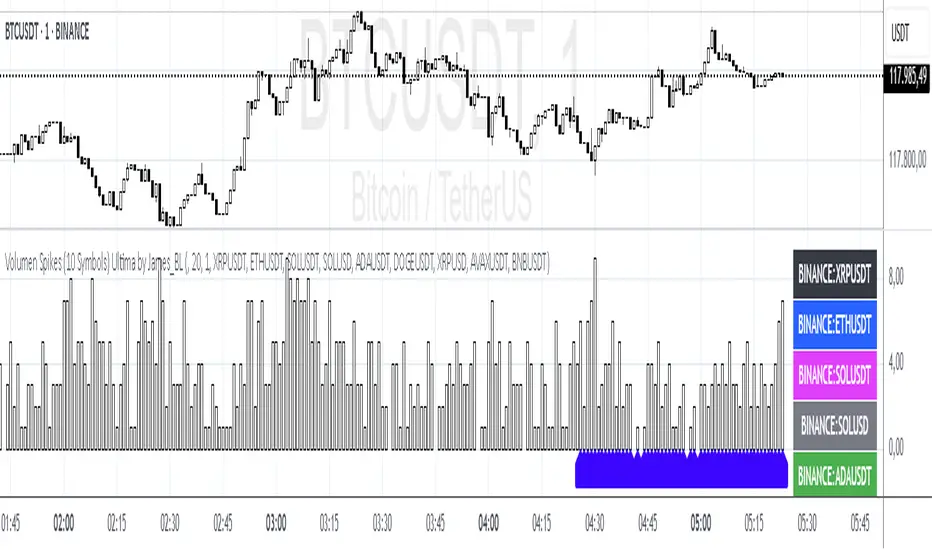
Volumen Spike Übersicht (10 Symbole) Ultima by James_BLThe script checks up to 10 volume sources simultaneously to see if they are above average.
There is also a volume spike factor that allows you to specify the strength compared to the average.
It supports alerts for each individual volume or for any one out of ten, which minimizes the limited number of available alerts.
myLMAsLibrary "myLMAs"
SMA(sourceData, maxLength)
Dynamic SMA
Parameters:
sourceData (float)
maxLength (int)
EMA(src, length)
Dynamic EMA
Parameters:
src (float)
length (int)
DEMA(src, length)
Dynamic DEMA
Parameters:
src (float)
length (int)
TEMA(src, length)
Dynamic TEMA
Parameters:
src (float)
length (int)
WMA(src, length)
Dynamic WMA
Parameters:
src (float)
length (int)
HMA(src, length)
Dynamic HMA
Parameters:
src (float)
length (int)
VWMA(src, volsrc, length)
Dynamic VWMA
Parameters:
src (float)
volsrc (float)
length (int)
SMMA(src, length)
Dynamic SMMA
Parameters:
src (float)
length (int)
LSMA(src, length, offset)
Dynamic LSMA
Parameters:
src (float)
length (int)
offset (int)
RMA(src, length)
Dynamic RMA
Parameters:
src (float)
length (int)
ALMA(src, length, offset_sigma, sigma)
Dynamic ALMA
Parameters:
src (float)
length (int)
offset_sigma (float)
sigma (float)
ZLSMA(src, length)
Dynamic ZLSMA
Parameters:
src (float)
length (int)
FRAMA(src, length)
Parameters:
src (float)
length (int)
KAMA(src, length)
Dynamic KAMA
Parameters:
src (float)
length (int)
JMA(src, length, phase)
Dynamic JMA
Parameters:
src (float)
length (int)
phase (float)
T3(src, length, volumeFactor)
Dynamic T3
Parameters:
src (float)
length (int)
volumeFactor (float)

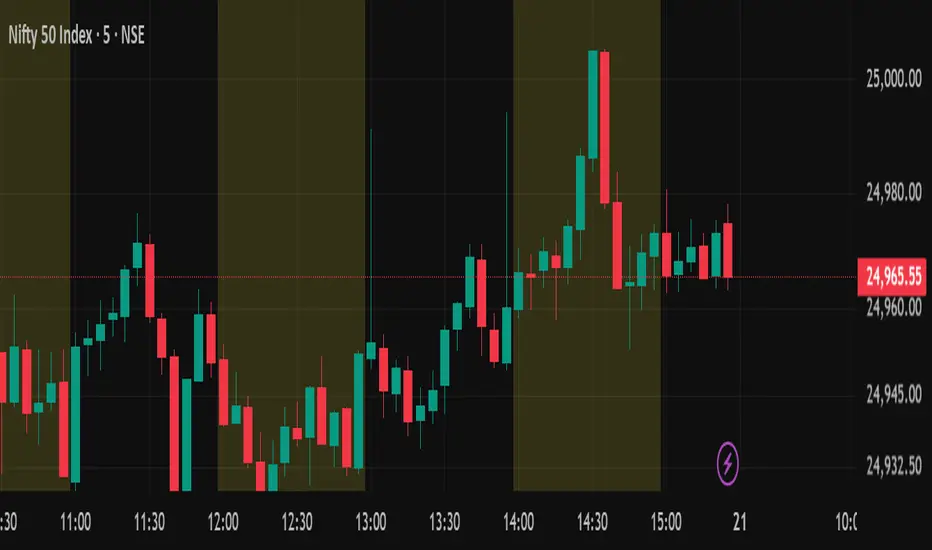
Alternate Hourly HighlightAlternate Hourly Highlight
This indicator automatically highlights every alternate one-hour window on your chart, making it easy to visually identify and separate each trading hour. The background alternates color every hour, helping traders spot hourly cycles, session changes, or develop time-based trading strategies.
Works on any timeframe.
No inputs required—just add to your chart and go!
Especially useful for intraday traders who analyze price action, volatility, or volume by the hour.
For custom colors or session windows, feel free to modify the script!
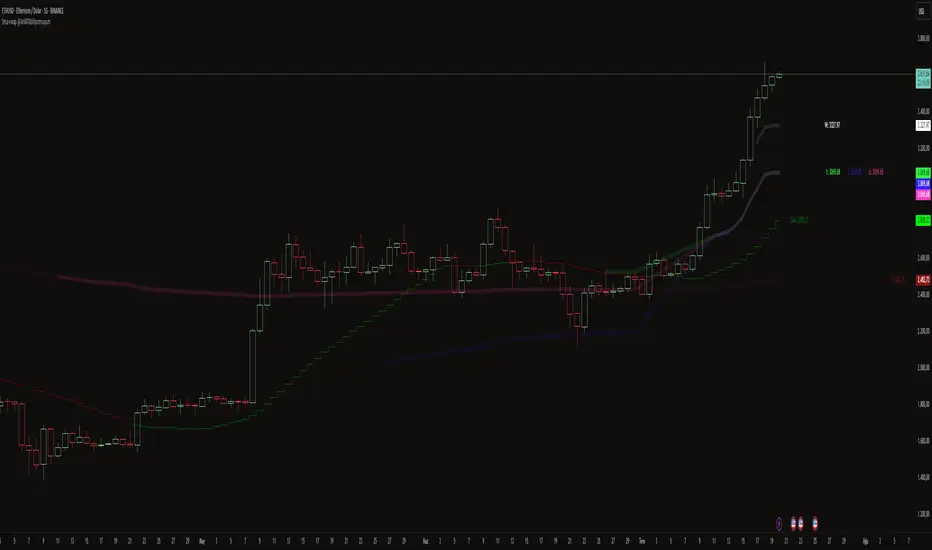
Sma-vwap @AnlATAbiliyormuyumThis indicator uses a simple moving average (SMA). When the price moves above the average, it can be considered as a buy signal, and when it falls below, as a sell signal. In addition, weekly, monthly, 3-month, 6-month, and yearly VWAPs have been added. The price's movements above and below these VWAPs can also be evaluated accordingly. Stay in peace and enjoy.
Sweep & Reclaim Indicator with Time, EMA & ATR FilterCandlestick structure scalping
With this model, you are looking for a sweep of a bearish candle, then that bullish candle closes back inside the range of the bearish candle and you buystop the reclaimed candles high. Vice versa for bearish. I like to use the candle low as stop targeting 1R or higher.
You also only want to take trades between 9:30-11:30AM EST, you want an ATR above 10, and a LTF EMA, I like the 10. Those are all attached as filters with this indicator.
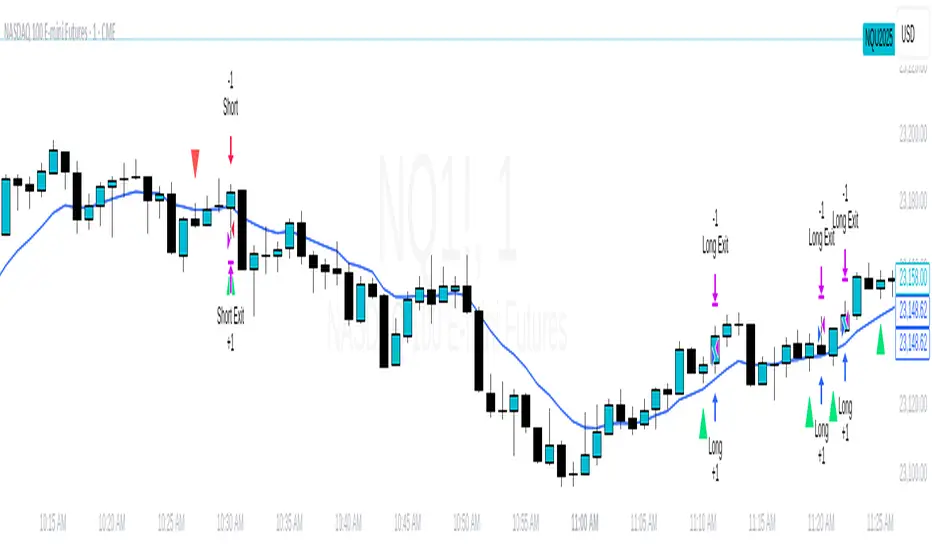
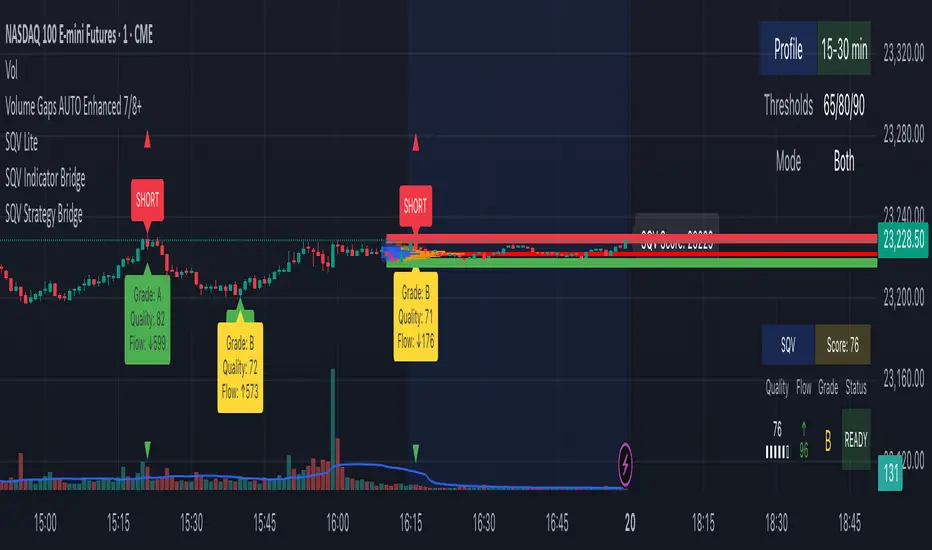
SQV Indicator Bridge# SQV Indicator Bridge - Quick Guide
## What is SQV Indicator Bridge?
A simple connector that validates your indicator's signals using SQV Lite before displaying them on the chart. Only high-quality signals pass through.
## How It Works
```
Your Indicator → Generates Signals → SQV Lite → Validates Quality → Bridge → Shows Only Valid Signals
```
## Quick Setup (3 Steps)
### Step 1: Prepare Your Indicator
Add these lines to export your signals:
```pinescript
// At the end of your indicator code
plot(longCondition ? 1 : 0, "Long Signal", display=display.none)
plot(shortCondition ? 1 : 0, "Short Signal", display=display.none)
```
### Step 2: Add to Chart (in order)
1. Your indicator
2. SQV Lite
3. SQV Indicator Bridge
### Step 3: Connect Sources
In Bridge settings:
- **Long Signal Source** → Select: YourIndicator: Long Signal
- **Short Signal Source** → Select: YourIndicator: Short Signal
- **SQV Long Valid** → Select: SQV Lite: SQV Long Valid
- **SQV Short Valid** → Select: SQV Lite: SQV Short Valid
- **SQV Score** → Select: SQV Lite: SQV Score
## Visual Settings
| Setting | Description | Default |
|---------|-------------|---------|
| Show Labels | Display BUY/SELL labels | On |
| Label Offset | Distance from candles (0-5 ATR) | 0 |
| Label Size | Tiny, Small, or Normal | Small |
| Long Color | Color for buy signals | Green |
| Short Color | Color for sell signals | Red |
## What You'll See
- **Green "LONG" labels** - When your buy signal passes SQV validation
- **Red "SHORT" labels** - When your sell signal passes SQV validation
- **No label** - When signal quality is too low
## Common Issues & Solutions
### No labels appearing?
1. Check "Use External Signals" is ON in SQV Lite
2. Verify source connections are correct
3. Lower minimum score in SQV Lite (try 60)
4. Test your indicator separately to ensure it generates signals
### Too many/few signals?
- Adjust "Minimum Quality Score" in SQV Lite
- Default is 65, lower for more signals, higher for fewer
### Wrong signals showing?
- Check Trading Mode in SQV Lite matches your strategy (Long Only/Short Only/Both)
## Example Integration
### Simple MA Cross Indicator
```pinescript
//@version=6
indicator("MA Cross with SQV", overlay=true)
// Your logic
fast = ta.sma(close, 20)
slow = ta.sma(close, 50)
longSignal = ta.crossover(fast, slow)
shortSignal = ta.crossunder(fast, slow)
// Plot MAs
plot(fast, color=color.blue)
plot(slow, color=color.red)
// Export for SQV Bridge (REQUIRED!)
plot(longSignal ? 1 : 0, "Long Signal", display=display.none)
plot(shortSignal ? 1 : 0, "Short Signal", display=display.none)
```
## Tips
✅ **DO**:
- Test in "Autonomous Mode" first (SQV Lite setting)
- Use clear signal names in your plots
- Keep signals binary (1 or 0)
❌ **DON'T**:
- Forget to add `display=display.none` to signal plots
- Use values other than 0 and 1 for signals
- Leave "Use External Signals" OFF in SQV Lite
## Alert Setup
1. Enable "Enable Alerts" in Bridge settings
2. Create alert on Bridge (not your indicator)
3. Alert message includes SQV score
Example alert: `"Long Signal Validated | Score: 85"`
## Complete Bridge Code
```pinescript
//@version=6
indicator("SQV Indicator Bridge", overlay=true)
// From your indicator
longSignal = input.source(close, "Long Signal Source", group="Signal Sources")
shortSignal = input.source(close, "Short Signal Source", group="Signal Sources")
// From SQV Lite
sqvLongValid = input.source(close, "SQV Long Valid", group="SQV Sources")
sqvShortValid = input.source(close, "SQV Short Valid", group="SQV Sources")
sqvScore = input.source(close, "SQV Score", group="SQV Sources")
// Settings
showLabels = input.bool(true, "Show Labels", group="Visual")
labelOffset = input.float(0.0, "Label Offset (ATR)", minval=0.0, maxval=5.0, step=0.5, group="Visual")
labelSize = input.string("small", "Label Size", options= , group="Visual")
longColor = input.color(color.green, "Long Color", group="Visual")
shortColor = input.color(color.red, "Short Color", group="Visual")
enableAlerts = input.bool(false, "Enable Alerts", group="Alerts")
// Logic
atr = ta.atr(14)
offset = labelOffset > 0 ? atr * labelOffset : 0
hasValidLong = longSignal > 0 and sqvLongValid > 0 and barstate.isconfirmed
hasValidShort = shortSignal > 0 and sqvShortValid > 0 and barstate.isconfirmed
// Show labels
if showLabels
if hasValidLong
label.new(bar_index, low - offset, "LONG",
style=label.style_label_up,
color=longColor,
textcolor=color.white,
size=labelSize == "tiny" ? size.tiny :
labelSize == "small" ? size.small : size.normal)
if hasValidShort
label.new(bar_index, high + offset, "SHORT",
style=label.style_label_down,
color=shortColor,
textcolor=color.white,
size=labelSize == "tiny" ? size.tiny :
labelSize == "small" ? size.small : size.normal)
// Alerts
if enableAlerts
if hasValidLong
alert("Long Signal Validated | Score: " + str.tostring(sqvScore, "#"), alert.freq_once_per_bar_close)
if hasValidShort
alert("Short Signal Validated | Score: " + str.tostring(sqvScore, "#"), alert.freq_once_per_bar_close)
```
---
**Need help?** Check the full SQV documentation or contact through TradingView messages.
DoublePatternsDetects Double Top and Double Bottom patterns from pivot points using structural symmetry, valley/peak depth, and extreme validation. Returns a detailed result object including similarity score, target price, and breakout quality.
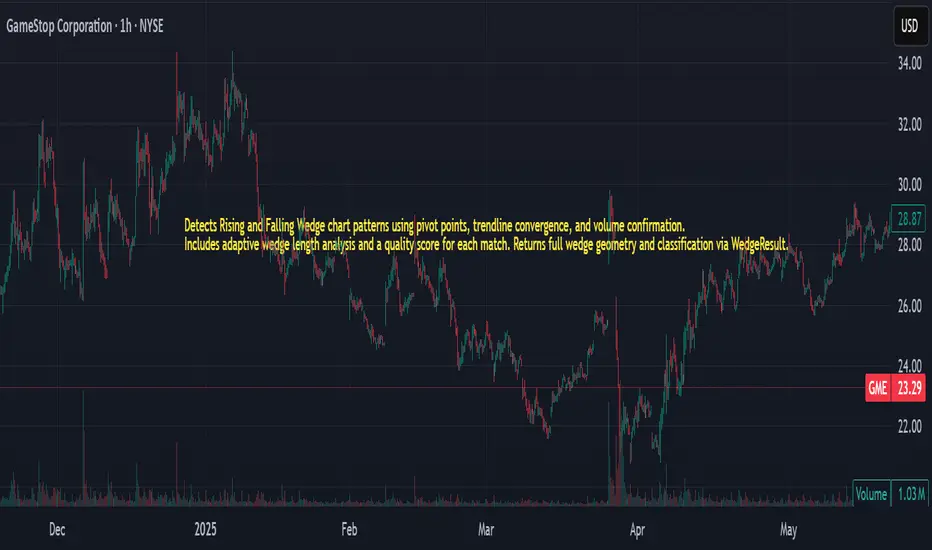
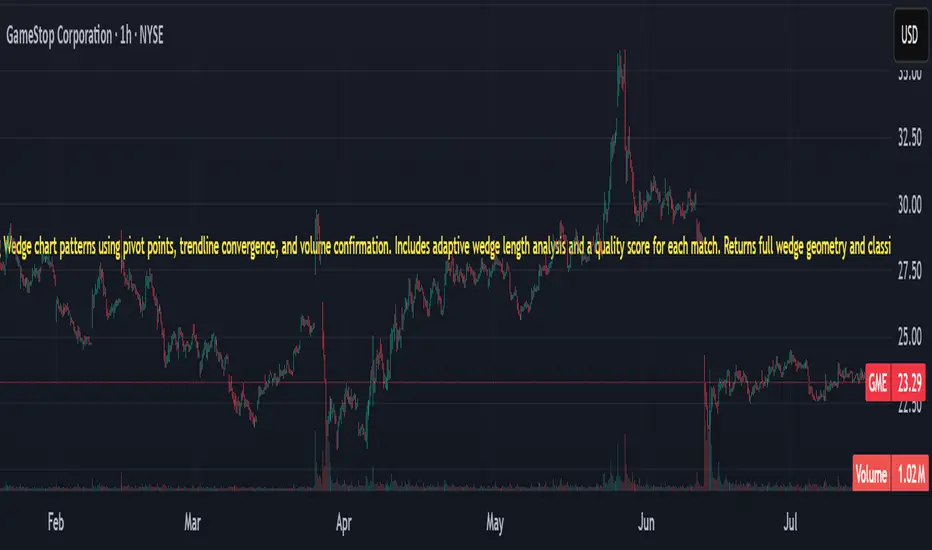
WedgePatternsDetects Rising and Falling Wedge chart patterns using pivot points, trendline convergence, and volume confirmation. Includes adaptive wedge length analysis and a quality score for each match. Returns full wedge geometry and classification via WedgeResult.
HeadShouldersPatternsDetects Head & Shoulders and Inverse Head & Shoulders chart patterns from pivot point arrays. Includes neckline validation, shoulder symmetry checks, and head extremeness filtering. Returns a detailed result object with structure points, bar indices, and projected price target.
XABCD_HarmonicsLibrary for detecting harmonic patterns using ZigZag pivots or custom swing points. Supports Butterfly, Gartley, Bat, and Crab patterns with automatic Fibonacci ratio validation and optional D-point projection using extremes. Returns detailed PatternResult including structure points and target projection. Ideal for technical analysis, algorithmic detection, or overlay visualizations.