Fibonacci Kanalları Zaman DilimliI understand that you want to fetch moving Fibonacci levels from a different timeframe (fibTimeframe) in Pine Script and plot them on the chart.
Here is a simple example code that:
Takes the timeframe input from settings (fibTimeframe),
Uses request.security() to get data from the selected timeframe,
Calculates Fibonacci levels,
Uses plot() to display the levels on the chart.
Indicators and strategies

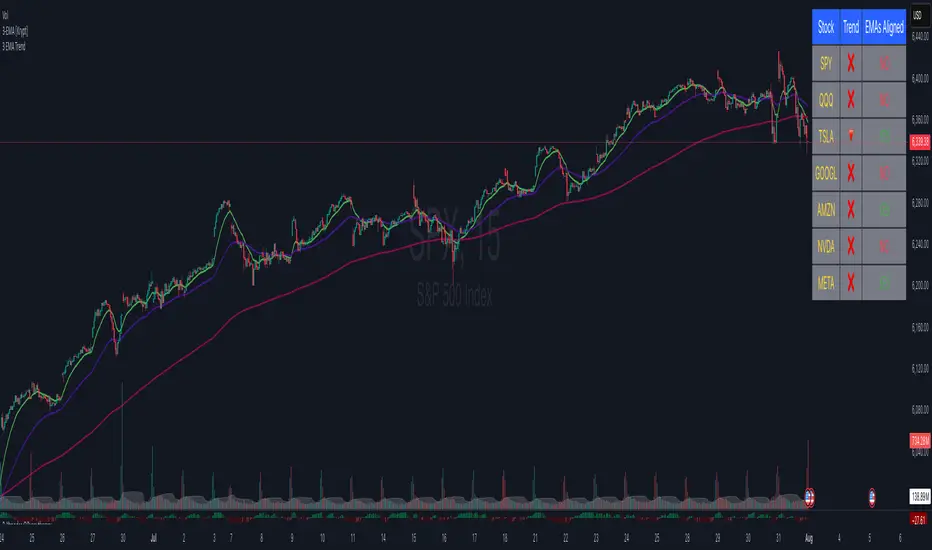
3 EMA cross overThis Pine Script displays the 3 EMA trend status for a list of popular stocks in a dynamic table. It calculates and monitors 13 EMA, 48 EMA, and 200 EMA for each ticker to detect bullish or bearish alignment.
Best Use:
Use this script to quickly scan market trends across multiple stocks and identify potential trade opportunities based on EMA alignment.
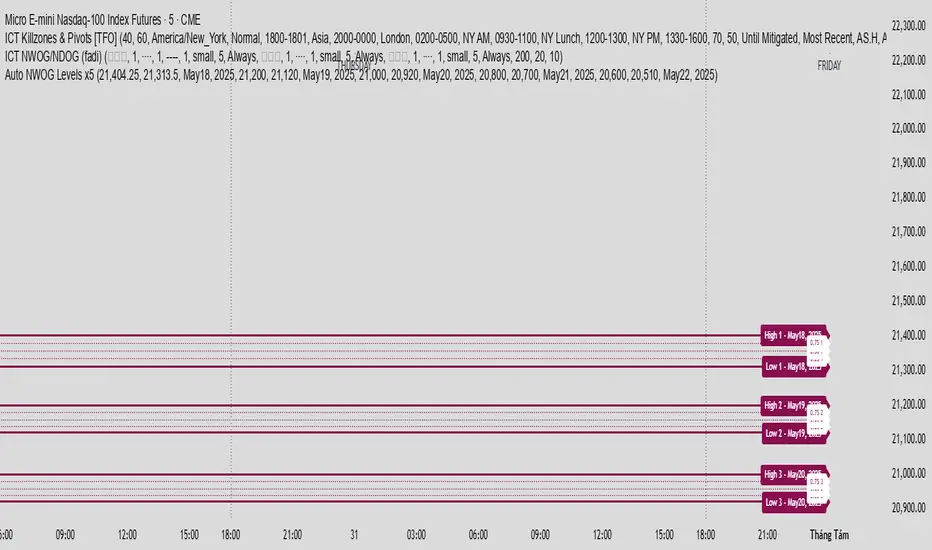
Auto NWOG Levels x5Indicator Name: Auto NWOG Levels with Labels
Description:
This indicator automatically plots the NWOG (Naked Weekly Open Gap) price levels on your chart. It includes:
NWOG High & Low: Solid maroon lines representing the high and low boundaries of the NWOG zone.
Intermediate Levels: Dotted maroon lines at 25%, 50%, and 75% levels within the NWOG range, providing visual guidance for possible support/resistance zones.
Labels: Each level is labeled on the right side of the chart, including a customizable date label for context.
Extendable Lines: All lines extend horizontally for a customizable number of bars (default: 500 bars) for better visibility over time.
Inputs:
NWOG High: Price level of the NWOG high.
NWOG Low: Price level of the NWOG low.
Date Label: Text to be displayed on the labels (e.g., the week of the NWOG).
This tool is useful for traders who monitor weekly price gaps and want clear, persistent levels drawn automatically on their charts.
BTC Fractal Momentum ExtremesDescription – BTC Fractal Momentum Extremes (BTCFME)
BTC Fractal Momentum Extremes (BTCFME) is a multi-factor, multi-method technical indicator designed to detect potential top and bottom reversal points in Bitcoin price action by integrating a confluence of unconventional signals. It combines fractals, adaptive momentum, volume dynamics, price velocity convergence, and market structure shifts — all filtered through real-time volatility and contextualized by temporal market conditions.
This tool is best used by traders looking to spot high-confidence turning points on intraday or swing timeframes, and works particularly well in volatile, momentum-driven environments.
Key Components & Methodology
BTCFME utilizes five independent signal-generation methods:
1. Fractal Volume Divergence
Detects reversal fractals in price (5-bar patterns) and validates them with volume anomalies:
Volume spikes (e.g., climax moves) or
Volume exhaustion (e.g., waning participation)
2. Adaptive Momentum Oscillator
Calculates momentum normalized by ATR-adjusted volatility, filtering out noise in choppy markets. It spots directional shifts when momentum inflects from extreme levels.
3. Market Structure Breaks
Identifies dynamic support and resistance using a configurable lookback, and flags potential breakouts or breakdowns from those levels.
4. Price Velocity Convergence
Analyzes the rate of change (velocity) and its acceleration. When both compress within a narrow volatility range, it signals a potential inflection zone.
5. Temporal Confluence Filter
Signals are only considered valid during active market hours (9 AM – 4 PM, excluding weekends) to reduce false positives during illiquid or inefficient trading periods.
Signal Logic & Sensitivity
Signals are generated when at least 3 out of 4 core methods agree, controlled by the Signal Sensitivity setting:
1 (High Sensitivity) = Trigger signals with fewer confirmations
5 (Low Sensitivity) = Require stronger multi-factor confluence
🔹 Buy (Bottom) Signals trigger when:
Bullish fractals appear
Momentum is deeply negative but improving
Price tests structure support
Velocity compresses below average
🔺 Sell (Top) Signals trigger when:
Bearish fractals with volume spikes appear
Momentum peaks and starts to decline
Price tests resistance
Velocity compresses near highs
Visual Features
Arrows: Buy signals = green arrow below candle. Sell signals = red arrow above candle.
Background Color: Indicates overall momentum regime (green = bullish bias, red = bearish, gray = neutral).
Dynamic Support & Resistance Lines: Based on recent swing highs/lows.
Signal Table (top-right): Shows real-time stats on:
Momentum value
Volatility factor
Volume strength (vs. 20-SMA)
Market structure status
Alerts
You can set alerts using the built-in conditions:
BTC Bottom Alert → Fires on potential market bottoms.
BTC Top Alert → Fires on potential market tops.
These alerts are filtered to avoid whipsaw conditions, by checking that opposite signals did not trigger in the last 2 candles.
How to Use
Timeframes: Best suited for 1H–4H and Daily BTC charts, but adaptable to others with parameter tuning.
Confirm with Price Action: Use BTCFME signals in conjunction with candlestick patterns or S/R zones for best results.
Adjust Sensitivity: Lower values catch more signals (good for scalping), higher values filter for stronger reversals (ideal for swing trades).
Use in Trending or Reversing Markets: BTCFME performs best during trending environments or volatile reversals — avoid during prolonged flat/ranging zones.
Notes & Recommendations
BTCFME is not a standalone buy/sell signal; combine it with risk management and trend confirmation tools.
Avoid using it during extremely low-volume sessions (e.g., late weekends).
Adjust parameters based on BTC's evolving volatility and your trading style.

ALMA X/Y🔍 ALMA X/Y Indicator Description
This indicator combines two different ALMA ( Arnaud Legoux Moving Average ) values into a single script, allowing you to visualize both short-term and long-term trends on the same chart.
📌 X: First ALMA length (typically for short-term trends)
📌 Y: Second ALMA length (typically for long-term trends)
🎯 Purpose:
– Track overall trend direction and potential reversals
– Generate buy/sell signals based on ALMA X and Y crossovers
– Analyze market momentum across timeframes

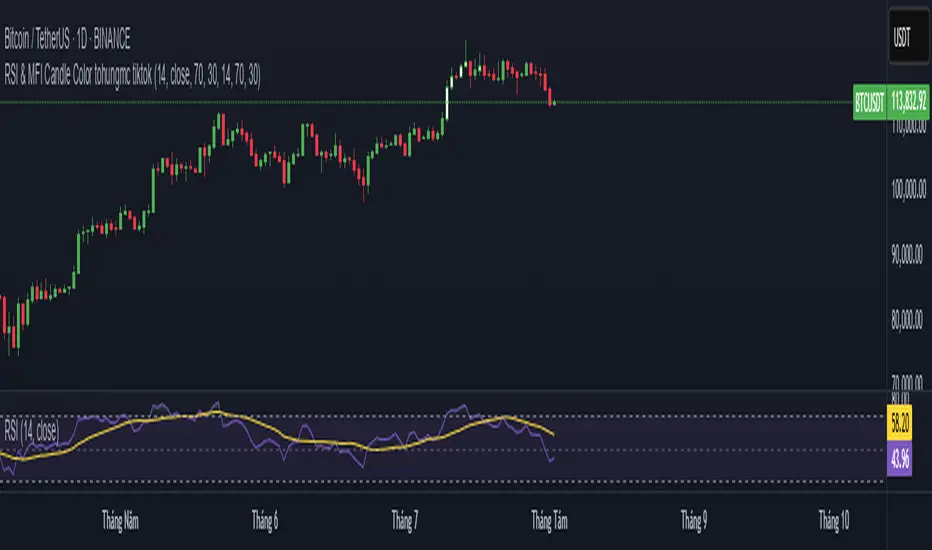
RSI & MFI Candle Color tohungmc tikRSI & MFI Candle Color with Alerts is a visual momentum indicator that highlights overbought and oversold conditions directly on your chart using candle colors.
This script combines the Relative Strength Index (RSI) and the Money Flow Index (MFI) with flexible settings, allowing you to:
✅ Display candle color based on RSI
✅ Display candle color based on MFI
✅ Show only candles where both RSI and MFI agree (for stronger signals)
✅ Customize overbought and oversold thresholds
✅ Receive real-time alerts when conditions are met at candle close
Color Logic:
White candles = Overbought (above threshold)
Blue candles = Oversold (below threshold)
Use case:
This tool is useful for traders who want quick, visual confirmation of momentum extremes, and who may combine RSI and MFI for higher accuracy.
Tip: Use with hidden candles (turn off price candles) or overlay it on price action for enhanced visibility.
Power candlePower candle --------------------------Power candle --------------------------Power candle --------------------------Power candle --------------------------Power candle --------------------------Power candle --------------------------Power candle --------------------------Power candle --------------------------Power candle --------------------------Power candle --------------------------Power candle --------------------------Power candle --------------------------Power candle --------------------------Power candle --------------------------Power candle --------------------------

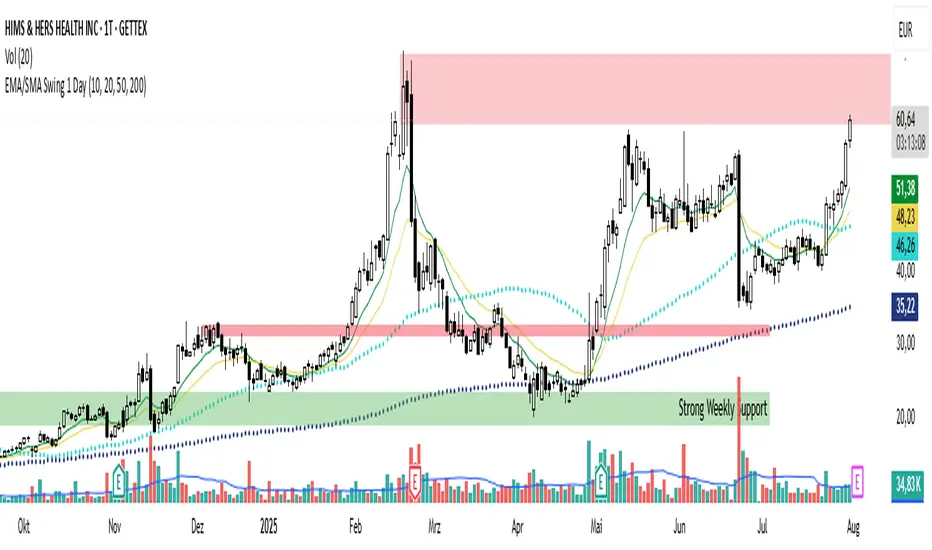
EMA 10,20 SMA 50, 200This indicator is very helpful for swing traders who plan their trades using EMAs and SMAs. It is used on the daily chart and displays the 10- and 20-EMA, as well as the 50- and 200-SMA.
Dual Supertrend tohungmc tikDual Supertrend is an advanced trend-following indicator that combines two Supertrend strategies — a Large Supertrend and a Small Supertrend — to provide you with more precise entry and exit signals.
This indicator plots two Supertrend lines:
Large Supertrend (Blue and Orange): A broader trend that reacts slower to price movements.
Small Supertrend (Green and Red): A faster trend that responds quicker to market changes.
Key Features:
Customizable ATR Periods and Multipliers for both Large and Small Supertrends.
Buy/Sell Signals: When the Small Supertrend trend changes, and it's aligned with the Large Supertrend, you get reliable buy and sell signals.
Highlighting: The background can be highlighted in green or red, depending on whether the Large Supertrend is in an uptrend or downtrend.
Alerts: Alerts can be set for buy/sell signals or when the trend direction changes.
Use Case:
This indicator is designed for traders looking to follow both long-term and short-term trends. By combining the slower Large Supertrend with the faster Small Supertrend, it gives a more comprehensive view of market trends and better entry/exit points.
Indicator Inputs:
ATR Periods and Multipliers: Control how sensitive the Supertrend reacts to market changes.
Highlighting: Enable/Disable background highlighting.
Buy/Sell Signals: Option to show buy/sell signals based on trend direction changes.

ATR Squeeze BackgroundThis simple but powerful indicator shades the background of your chart whenever volatility contracts, based on a custom comparison of fast and slow ATR (Average True Range) periods.
By visualizing low-volatility zones, you can:
* Identify moments of compression that may precede explosive price moves
* Stay out of choppy, low-momentum periods
* Adapt this as a component in a broader volatility or breakout strategy
🔧 How It Works
* A Fast ATR (default: 7 periods) and a Slow ATR (default: 40 periods) are calculated
* When the Fast ATR is lower than the Slow ATR, the background is shaded in blue
* This shading signals a contraction in volatility — a condition often seen before breakouts or strong directional moves
⚡️ Why This Matters
Many experienced traders pay close attention to volatility cycles. This background indicator helps visualize those cycles at a glance. It's minimal, non-intrusive, and easy to combine with your existing tools.
🙏 Credits
This script borrows core logic from the excellent “Relative Volume at Time” script by TradingView. Credit is given with appreciation.
⚠️ Disclaimer
This script is for educational purposes only.
It does not constitute financial advice, and past performance is not indicative of future results. Always do your own research and test strategies before making trading decisions.

Multi Averages - CustomizableThis script adds up to 5 moving averages to your plot!
Both type and length are customizable.
RSI Z‑Score + TableRSI Z-Score + Table
This script calculates the Z-Score of the RSI (Relative Strength Index), which standardizes RSI based on its own recent history.
What It Shows:
RSI Z-Score = (Current RSI - Mean RSI) / Standard Deviation
This tells you how extreme the current RSI is compared to its historical values.
A table displays:
Current RSI
Rolling Mean
RSI Z-Score
How to Use:
Z-Score > +2 = Statistically overbought
Z-Score < -2 = Statistically oversold
Use it to time reversals or overextension in RSI behavior.
🔒 Based on rolling lookback window — fully customizable.
Author:
Tags: #RSI #ZScore #Momentum #StatisticalEdge #MeanReversion #Crypto

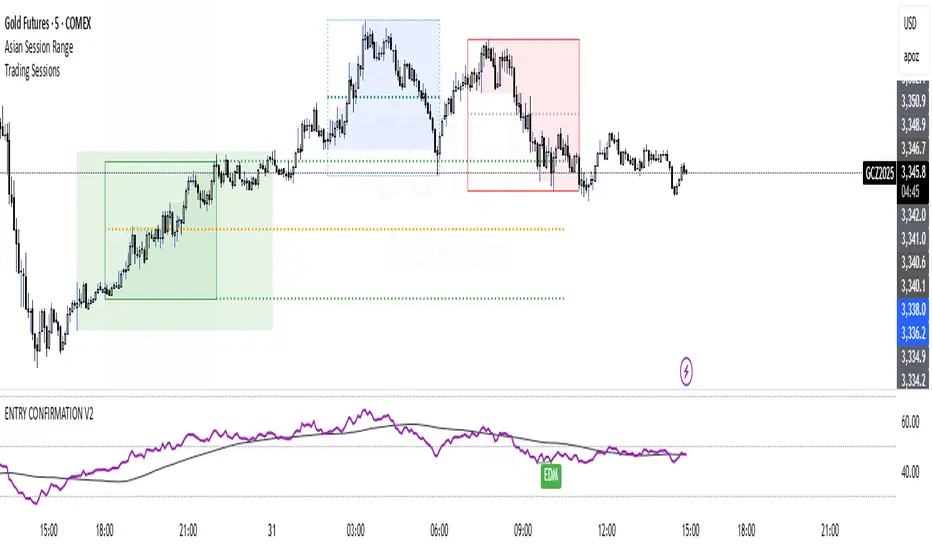
ENTRY CONFIRMATION V2An indicator from candle man. Helps determine whether supply and demand zone are truly supply or demand.
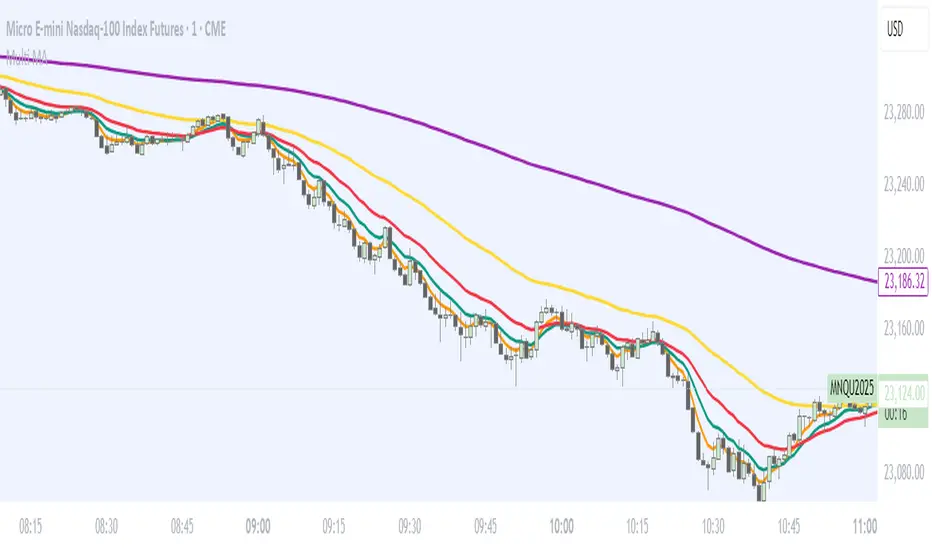
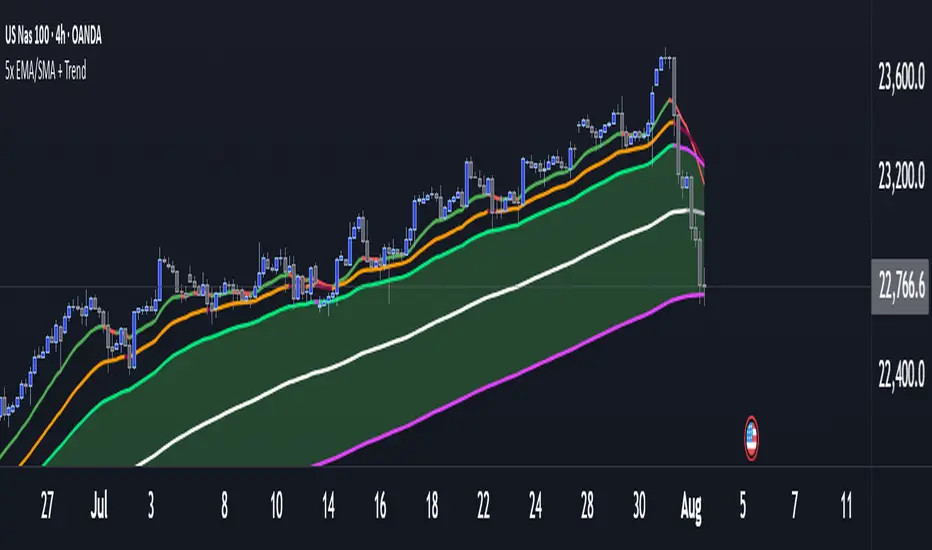
Multi 5x EMA/SMA Colored + EMA Trend Cloud- Ok so these are the settings to the ema's
15
30
50
115
200
Remember these ema's change color depending if the market is bullish or bearish, so choose what colors you want to see bullish and what colors you want to see Bearish
You can also toggle them on or off if you want.
- These are the setting to the trend cloud so you know if the market is bullish or Bearish
50
200
200
Toggle off all plots and only have plots background on
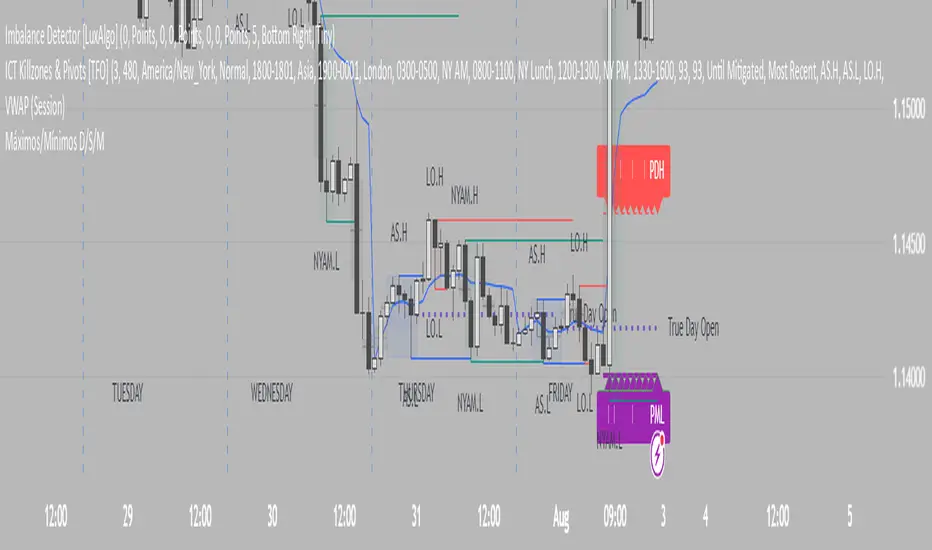
Lucas Scalia Maximums and minimums of the day, week, and month. Basically, it automatically marks and labels the highs and lows of the previous daily , weekly, and monthly candles. The labels can be added or removed at your discretion, leaving only the dotted lines.
Custom Candle Colors by Day (Full Week)Highlight specific daily candles a different color (Monday - Sunday)

Invencible MACD Strategy Scalping)Invencible MACD Strategy
The Invencible MACD Strategy is a refined scalping system designed to deliver consistent profitability by optimizing the classic MACD indicator with trend and volatility filters. This strategy is built for short-term traders looking for precision entries and favorable risk-to-reward conditions on any asset and lower timeframes such as 1m, 5m, or 15m.
Core Logic
This strategy uses a multi-timeframe (MTF) approach to calculate the MACD, Signal Line, and Histogram. Trades are executed when all of the following conditions are met:
Long Entry:
The MACD crosses above the Signal Line.
The Histogram is rising with a defined impulse threshold.
Price is above the 200 EMA, confirming an uptrend.
Volatility, measured by ATR, is above a configurable minimum.
Short Entry:
The MACD crosses below the Signal Line.
The Histogram is falling with a defined impulse threshold.
Price is below the 200 EMA, confirming a downtrend.
ATR confirms sufficient volatility.
Risk Management
Take Profit is set higher than Stop Loss to ensure that the average winning trade is greater than the average losing trade.
Trailing stop is optional and can be disabled to allow full profit capture on strong moves.
Trade size is fixed to 1 contract, suitable for scalping with low exposure.
Customizable Parameters
MACD Fast, Slow, and Signal EMAs
Histogram impulse threshold
Minimum ATR filter
Take Profit and Stop Loss percentage
Trailing Stop activation and size
Timeframe resolution (can be customized or synced with chart)
Visual Aids
MACD and Signal Line are plotted below price.
Histogram bars help visualize momentum strength.
200 EMA is plotted on the main chart to show trend direction.
This strategy was designed to prioritize quality over quantity, avoiding weak signals and improving both the win rate and profit factor. It is especially effective on assets like gold (XAUUSD), indices, cryptocurrencies, and high-liquidity stocks.
Feel free to test and optimize parameters based on your trading instrument and timeframe.
Los 7 Capitales

Global M2 Money Supply // Days Offset =This is the original version.. there is no update... just needed to re-install the script.

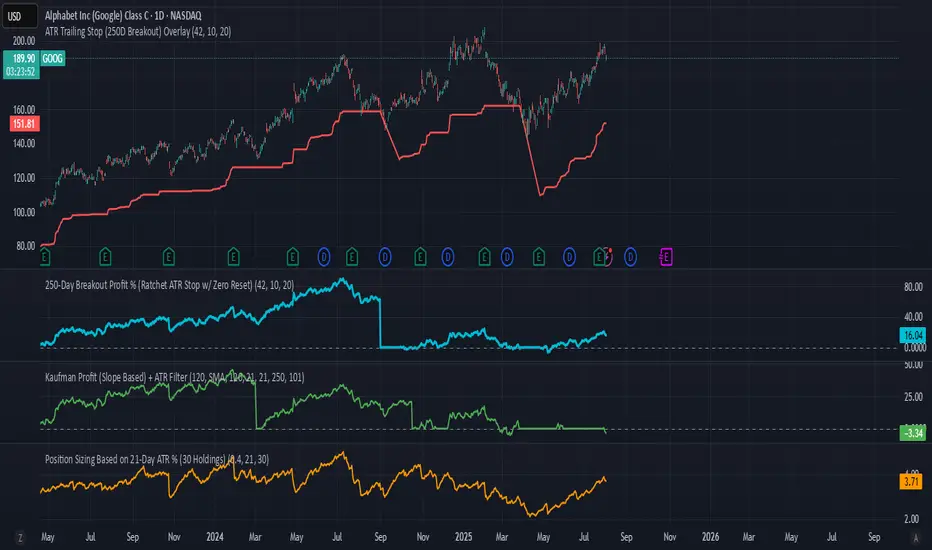
Position Sizing Based on 21-Day ATR % (30 Holdings) 40 volATR portion sizing based on 40 vol to get is close to STD DEV weightings.
EMA Trend Confirmation with Alerts此脚本是基于EMA 200周期 50周期 20周期加以合并并进行改进的一个脚本指标,主要作用是用于观察趋势走向,其中有上升下降和震荡趋势,经过多数测试,此指标适用于短线交易,推荐周期为20或15,大周期和长线交易详见RSI+EMA结合指标
This script is an improved script indicator based on the EMA 200 period, 50 period, and 20 period. Its main function is to observe the trend direction, including up, down, and oscillating trends. After many tests, this indicator is suitable for short-term trading, and the recommended period is 20 or 15. For large-cycle and long-term trading, please refer to the RSI+EMA combination indicator.

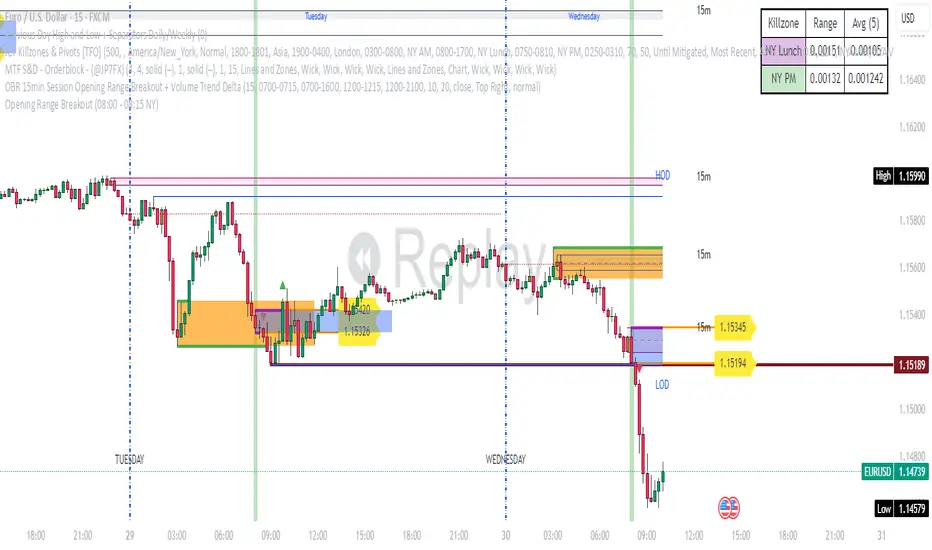
Opening Range Breakout (08:00 - 08:15 NY) - AAPNIndicador que marca la apertura de Forex en NY a 15 minitos, la primera vela