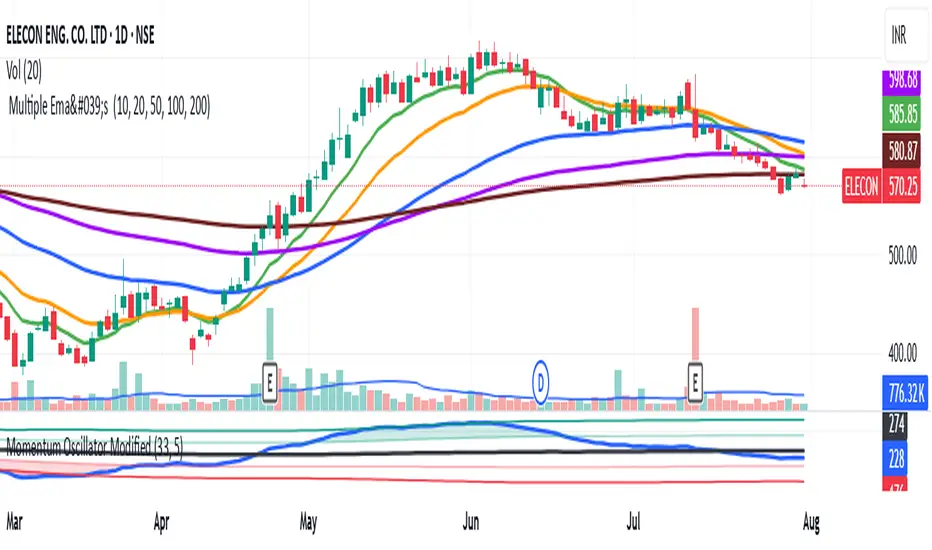
Momentum Oscillator ModifiedThis indicator is a custom momentum oscillator enhanced with True Range-adjusted price logic and dynamic Bollinger Bands, offering a refined way to track price strength, momentum shifts, and overbought/oversold extremes with reduced noise.
Key Features:
Dynamic Price Oscillator:
Measures momentum using both price change and a volatility-adjusted price for greater accuracy.
Smoothing factor lets you fine-tune the balance between responsiveness and noise filtering.
True Range-Based Volatility Adjustment:
Integrates true range calculations to adapt to current volatility, making signals more robust during different market conditions.
Adaptive Bollinger Bands:
Two sets of custom Bollinger Bands (standard and expanded) are drawn around the oscillator, adapting over time.
These bands help identify when momentum is exceptionally strong or weak relative to recent history.
Special fills dynamically highlight when the oscillator breaks above/below the bands, signaling potential trend extremes.
Customization:
Easily adjust lookback length and smoothing factor to fit your personal trading style (e.g., scalping or swing trading).
How to Use:
Watch for the oscillator crossing above the green Bollinger Bands or below the red bands for potential overbought/oversold or breakout scenarios.
Expanded bands provide a "super extreme" zone which may hint at exhaustion or trend climax.
The dynamic mean (black line) gives a visual reference for the normalized momentum level.
Indicators and strategies

MTF Clean Panelsit is bigger model of a earlier model then i have made earlier it helps you see multiple timeframes together and includes more daily timeframe and have also been introduced a new 4 hours candle structure

ALPHA 999This script is a custom-built indicator designed to enhance your trading strategy by providing . It is optimized for and suitable for both intraday and swing traders.

MA wiht Logistic [Jsk]This script is published for educational purposes only and does not constitute financial advice. Past performance does not guarantee future results. Trade at your own risk; the author accepts no liability for any financial loss incurred.
Concept
• Direction is defined by the relationship between price and two moving averages (Fast & Slow).
Long: Close > Fast MA > Slow MA
Short: Close < Fast MA < Slow MA
• Three independent exit modes are available:
1) None – positions are closed only when an opposite signal appears.
2) Percentage – fixed take-profit / stop-loss expressed in % of entry price (default +20 % / –5 %).
3) Logistic – a dynamic take-profit / stop-loss based on a logistic transformation of unrealised P&L.
Key Inputs
• MA Type: EMA, SMA or WMA
• Fast / Slow MA length
• Exit Mode: None | Percentage | Logistic
• Percentage TP / SL values (active when Exit Mode = Percentage)
• Logistic settings: slope k, midpoint, TP / SL probability thresholds (active when Exit Mode = Logistic)
Recommended Use
The script works on any market or timeframe, but MA-based trend filters usually perform better in assets with smooth, directional moves. Always verify results in the Strategy Tester and account for commissions and slippage.

Nikkei Session Key Levels Lines (with Labels) - Nikkei CFDThis is Nikkei Session Key Levels Lines (with Labels) - Nikkei CFD. shows you all the key level lines that you need to be aware. hope it helps :)

Nikkei Session Prep (RTH only, UTC-4)This is Nikkei Session Prep (RTH only, UTC-4). hope it helps :)


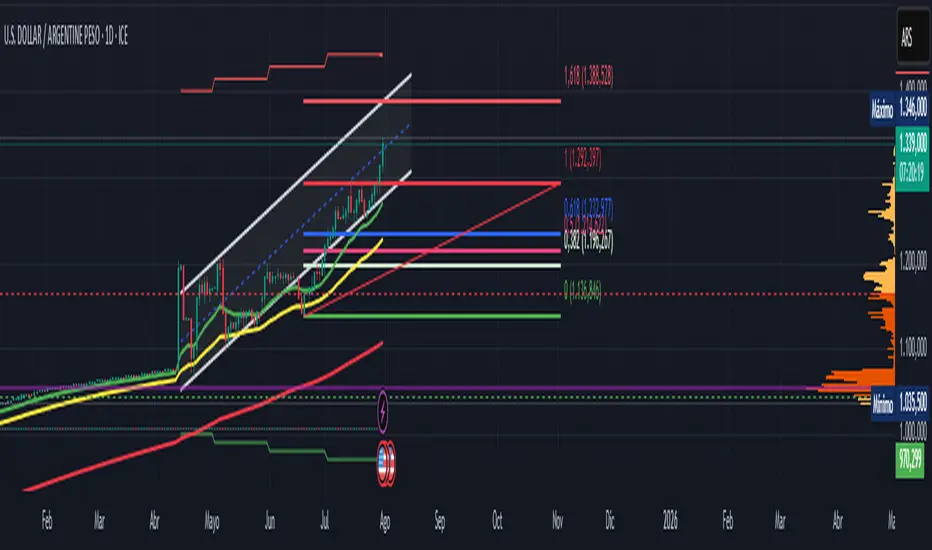
Official USD Staggered Bands - ArgentinaOfficial USD Staggered Bands - Argentina
The Central Bank, under the administration of Javier Milei (La Libertad Avanza), announced on Friday, April 11, 2025, a series of measures to eliminate the so-called "exchange rate restriction."
In this new phase, the dollar's exchange rate on the Free Exchange Market (MLC) will be able to fluctuate within a band between $1,000 and $1,400 , the limits of which will be expanded at a rate of 1% monthly.
The lines evolve daily, increasing as the public administration predicts. This way, you can know the likelihood of a Central Bank intervention to correct the variation and return the peso to a price within the band.
The script runs under the ticker USDARS
Coefficient of Variance BarsThe script calculates the Coefficient of Variance (CV), which is the standard deviation (a measure of volatility) divided by the average price over a set period. In simple terms, it tells you how volatile the market is in relation to its current price level.
• Highlighting Volatility Increase: By default, the script colors the bars when this relative volatility makes a new high. This suggests that the market is "waking up" and that a significant price move could be starting.
• Highlighting Low Volatility (Inverse Mode): When you uncheck the box in the settings, it highlights periods where volatility is not making a new high. This is useful for spotting quiet, consolidating markets.
________________________________________
How to Use It in Trading
This indicator is a complementary tool and should be used with other forms of analysis, like price action or trend indicators.
1. Spotting Potential Breakouts
The most common use is to anticipate breakouts. When the price is moving in a tight range (consolidation) and you suddenly see a highlighted bar, it signals a surge in volatility. This is often the catalyst that pushes the price out of the range.
• Strategy: Look for a period of price consolidation. When a bar is colored, indicating a volatility spike, look for a confirmation of a breakout (e.g., a candle closing above resistance or below support) and consider entering a trade in that direction.
2. Identifying Ranging Markets
By switching to the inverse mode, you can easily see when the market is quiet and range-bound.
• Strategy: When the bars are consistently highlighted in inverse mode, it confirms a ranging market. This is the ideal environment for strategies that capitalize on sideways movement, such as using oscillators (like RSI or Stochastics) to trade between support and resistance levels.
3. Gauging Trend Strength and Exhaustion
In a strong, ongoing trend, you'll likely see intermittent volatility spikes confirming the momentum. However, a sudden, massive spike in volatility after a very long trend might signal a "climax," potentially indicating the trend is exhausted and a reversal could be near.
Manual 1H Trend BackgroundThis TradingView Pine Script v6 indicator allows you to manually set the trend direction (based on your analysis of the 1-hour timeframe), and it will change the background color of your chart based on that input:
"Buy" → chart background turns green
"Sell" → chart background turns red
"Neutral" → no background color (transparent)


Range Filter Strategy [Arabic Real Backtest]استراتيجية مرشح النطاق - اختبار واقعي
نظرة عامة
استراتيجية مرشح النطاق المتقدمة مصممة للاختبار الواقعي مع توقيت تنفيذ دقيق وإدارة مخاطر شاملة. تم بناؤها خصيصًا لأسواق العملات الرقمية مع معلمات قابلة للتخصيص لأصول وفترات زمنية مختلفة.
الخوارزمية الأساسية
تقنية مرشح النطاق:
* حساب متوسط النطاق السلس باستخدام فلترة مزدوجة للـ EMA
* فلترة أسعار استنادًا إلى النطاق الديناميكي لتحديد اتجاه الاتجاه
* نظام فلترة ضد الضوضاء لتقليل الإشارات الخاطئة
* تتبع الزخم الاتجاهي مع عدادات للأعلى/للأسفل
الميزات الرئيسية
**التنفيذ الفوري (بدون تأخير)**
* معالجة الأوامر عند كل نقطة: تنفيذ فوري دون انتظار إغلاق الشمعة
* تكامل مكبر الشمعة للحصول على دقة داخل الشمعة
* الحساب في كل نقطة لضمان الاستجابة القصوى
* تجاوز OHLC القياسي لزيادة الدقة
**محاكاة الأسعار الواقعية**
* تسعير الدخول باستخدام HL2 (High+Low)/2 لملء واقعي
* محاكاة للبُعد العازل للسعر القابل للتخصيص
* إنشاء انزلاق عشوائي (من 0 إلى الحد الأقصى للانزلاق)
* التحقق من سيولة السوق قبل الدخول
**فلترة الإشارات المتقدمة**
* فلترة استنادًا إلى الحجم مع نسبة قابلة للتخصيص
* نظام تأكيد الإشارة اختياري (من 1 إلى 3 شموع)
* منطق مضاد للتكرار لمنع الإشارات المكررة
* التحكم في حد التداول اليومي
**إدارة المخاطر**
* نسب ثابتة للمخاطرة: العائد مع حساب دقيق للنقاط
* تنفيذ وقف الخسارة وجني الأرباح تلقائيًا
* إدارة حجم المركز
* تحديد الحد الأقصى للصفقات اليومية
**نظام التنبيهات**
* تنبيهات فورية متزامنة مع تنفيذ الاستراتيجية
* أنواع متعددة من التنبيهات: إعداد، دخول، خروج، حالة
* تخصيص تنسيق الرسائل مع تضمين السعر/الوقت
* تكامل مع لوحة تنبيهات TradingView
المعلمات الافتراضية
محسن لرسوم بيانية لفترة 5 دقائق لبيتكوين:
* فترة العينة: 100
* معامل النطاق: 3.0
* المخاطرة: 50 نقطة
* المكافأة: 100 نقطة (نسبة 1:2)
* بُعد الانتشار: 2.0 نقطة
* الحد الأقصى للانزلاق: 1.0 نقطة
منطق الإشارة
**شروط الدخول الطويل:**
* السعر فوق خط مرشح النطاق
* تأكيد الزخم الصاعد
* تلبية متطلبات الحجم (إذا تم تمكينها)
* اكتمال فترة التأكيد (إذا تم تمكينها)
* لم يتم تجاوز حد الصفقات اليومية
**شروط الدخول القصير:**
* السعر تحت خط مرشح النطاق
* تأكيد الزخم الهابط
* تلبية متطلبات الحجم (إذا تم تمكينها)
* اكتمال فترة التأكيد (إذا تم تمكينها)
* لم يتم تجاوز حد الصفقات اليومية
العناصر البصرية
* خط مرشح النطاق مع تلوين الاتجاه
* الأشرطة العليا والسفلى المستهدفة
* علامات إشارات الدخول
* صناديق نسبة المخاطرة/العائد
* لوحة إعدادات حية
خيارات التخصيص
**التكيف مع السوق:**
* تعديل فترة العينة لبيانات الزمن المختلفة
* تعديل معامل النطاق لمستويات التقلب المختلفة
* تكوين الانتشار/الانزلاق لوسطاء مختلفين
* تحديد النسب المناسبة للمخاطرة/العائد حسب أسلوب التداول
**ضوابط الفلترة:**
* تمكين/تعطيل فلترة الحجم
* تعديل متطلبات التأكيد
* تعيين حدود الصفقات اليومية
* تخصيص تفضيلات التنبيه
الميزات المتعلقة بالأداء
* نتائج اختبار واقعية متوافقة مع التداول المباشر
* القضاء على تحيز المستقبل
* محاكاة تنفيذ الأوامر بشكل صحيح
* إحصائيات تداول شاملة
تكوين التنبيه
**أنواع التنبيهات المتاحة:**
* إشارات الدخول مع معلومات التداول الكاملة
* تنبيهات الإعداد للتحضير المبكر
* إشعارات الخروج لإدارة المراكز
* فلترة التغيرات في الاتجاه لظروف السوق
**تنسيق الرسائل:**
رمز - الإجراء | السعر: XX.XX | الوقف: XX.XX | الهدف: XX.XX | الوقت: HH\:MM
التوصيات لاستخدام الاستراتيجية
**الإعدادات المثلى:**
* بيتكوين/العملات الرقمية الرئيسية: المعلمات الافتراضية
* الفوركس: تقليل فترة العينة إلى 50-70، المعامل إلى 2.0-2.5
* الأسهم: تقليل فترة العينة إلى 30-50، المعامل إلى 1.0-1.8
* الذهب: فترة العينة 60-80، المعامل 1.5-2.0
**تكوين TradingView:**
* إعادة الحساب: "على كل نقطة"
* الأوامر: "استخدام مكبر الشمعة"
* البيانات: يوصى باستخدام التغذية الحية
إخلاء المسؤولية
تم تصميم هذه الاستراتيجية لأغراض تعليمية وتحليلية. الأداء السابق لا يضمن النتائج المستقبلية. يجب دائمًا إجراء اختبارات شاملة على التداول الورقي قبل التنفيذ المباشر. يجب أخذ ظروف السوق، تنفيذ الوسيط، والتحمل الشخصي للمخاطر في الاعتبار عند استخدام أي نظام تداول آلي.
Range Filter Strategy - Real Backtesting
# Overview
Advanced Range Filter strategy designed for realistic backtesting with precise execution timing and comprehensive risk management. Built specifically for cryptocurrency markets with customizable parameters for different assets and timeframes.
Core Algorithm
Range Filter Technology:
- Smooth Average Range calculation using dual EMA filtering
- Dynamic range-based price filtering to identify trend direction
- Anti-noise filtering system to reduce false signals
- Directional momentum tracking with upward/downward counters
Key Features
Real-Time Execution (No Delay)
- Process orders on tick: Immediate execution without waiting for bar close
- Bar magnifier integration for intrabar precision
- Calculate on every tick for maximum responsiveness
- Standard OHLC bypass for enhanced accuracy
Realistic Price Simulation
- HL2 entry pricing (High+Low)/2 for realistic fills
- Configurable spread buffer simulation
- Random slippage generation (0 to max slippage)
- Market liquidity validation before entry
Advanced Signal Filtering
- Volume-based filtering with customizable ratio
- Optional signal confirmation system (1-3 bars)
- Anti-repetition logic to prevent duplicate signals
- Daily trade limit controls
Risk Management
- Fixed Risk:Reward ratios with precise point calculation
- Automatic stop loss and take profit execution
- Position size management
- Maximum daily trades limitation
Alert System
- Real-time alerts synchronized with strategy execution
- Multiple alert types: Setup, Entry, Exit, Status
- Customizable message formatting with price/time inclusion
- TradingView alert panel integration
Default Parameters
Optimized for BTC 5-minute charts:
- Sampling Period: 100
- Range Multiplier: 3.0
- Risk: 50 points
- Reward: 100 points (1:2 R:R)
- Spread Buffer: 2.0 points
- Max Slippage: 1.0 points
Signal Logic
Long Entry Conditions:
- Price above Range Filter line
- Upward momentum confirmed
- Volume requirements met (if enabled)
- Confirmation period completed (if enabled)
- Daily trade limit not exceeded
Short Entry Conditions:
- Price below Range Filter line
- Downward momentum confirmed
- Volume requirements met (if enabled)
- Confirmation period completed (if enabled)
- Daily trade limit not exceeded
Visual Elements
- Range Filter line with directional coloring
- Upper and lower target bands
- Entry signal markers
- Risk/Reward ratio boxes
- Real-time settings dashboard
Customization Options
Market Adaptation:
- Adjust Sampling Period for different timeframes
- Modify Range Multiplier for various volatility levels
- Configure spread/slippage for different brokers
- Set appropriate R:R ratios for trading style
Filtering Controls:
- Enable/disable volume filtering
- Adjust confirmation requirements
- Set daily trade limits
- Customize alert preferences
Performance Features
- Realistic backtesting results aligned with live trading
- Elimination of look-ahead bias
- Proper order execution simulation
- Comprehensive trade statistics
Alert Configuration
Alert Types Available:
- Entry signals with complete trade information
- Setup alerts for early preparation
- Exit notifications for position management
- Filter direction changes for market context
Message Format:
Symbol - Action | Price: XX.XX | Stop: XX.XX | Target: XX.XX | Time: HH:MM
Usage Recommendations
Optimal Settings:
- Bitcoin/Major Crypto: Default parameters
- Forex: Reduce sampling period to 50-70, multiplier to 2.0-2.5
- Stocks: Reduce sampling period to 30-50, multiplier to 1.0-1.8
- Gold: Sampling period 60-80, multiplier 1.5-2.0
TradingView Configuration:
- Recalculate: "On every tick"
- Orders: "Use bar magnifier"
- Data: Real-time feed recommended
Risk Disclaimer
This strategy is designed for educational and analytical purposes. Past performance does not guarantee future results. Always test thoroughly on paper trading before live implementation. Consider market conditions, broker execution, and personal risk tolerance when using any automated trading system.

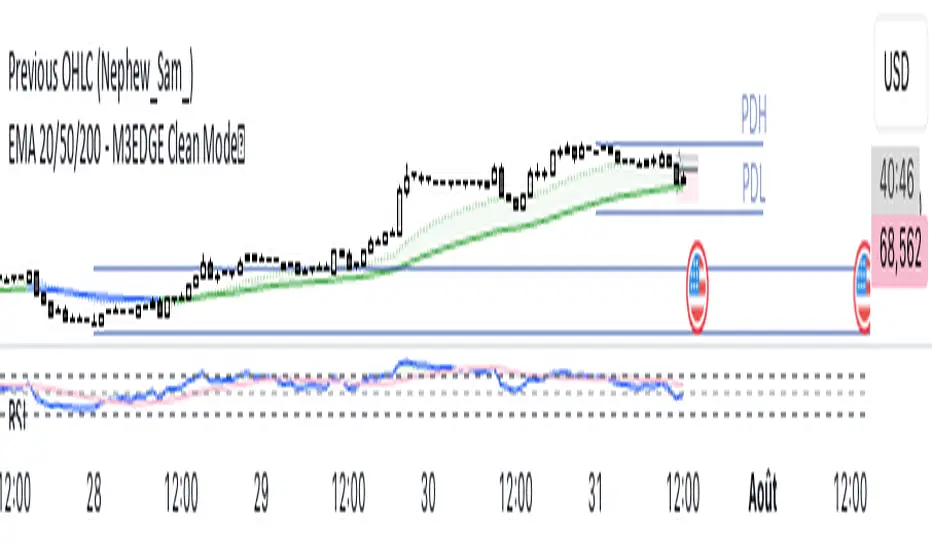
EMA 20/50/200 - M3EDGE Clean Mode™The M3EDGE Clean Mode™ indicator is designed to spot the cleanest, most aligned market phases.
It filters out market noise and highlights only the high-probability trending zones where the odds are in your favor.
How it works:
• Tracks 3 key EMAs (20, 50, 200)
• Confirms directional alignment across short, medium, and long-term trends
• Colors optimal market phases to identify high-probability setups
• Optional display of the dynamic EMA50/EMA200 zone to visualize the trend’s core
Purpose:
🎯 Avoid choppy, sideways market conditions
🎯 Focus only on smooth, directional price moves
🎯 Reduce false signals and improve chart clarity
Best use cases:
• Ideal for scalping, day trading, and swing trading
• Works on all markets: indices, commodities, forex, crypto
• Perfect when combined with macro analysis and other M3EDGE™ setups
💡 Pro tip: The M3EDGE Clean Mode™ isn’t just another indicator — it’s a quality filter that keeps you out of messy conditions. When it lights up, you know the road ahead is clear.
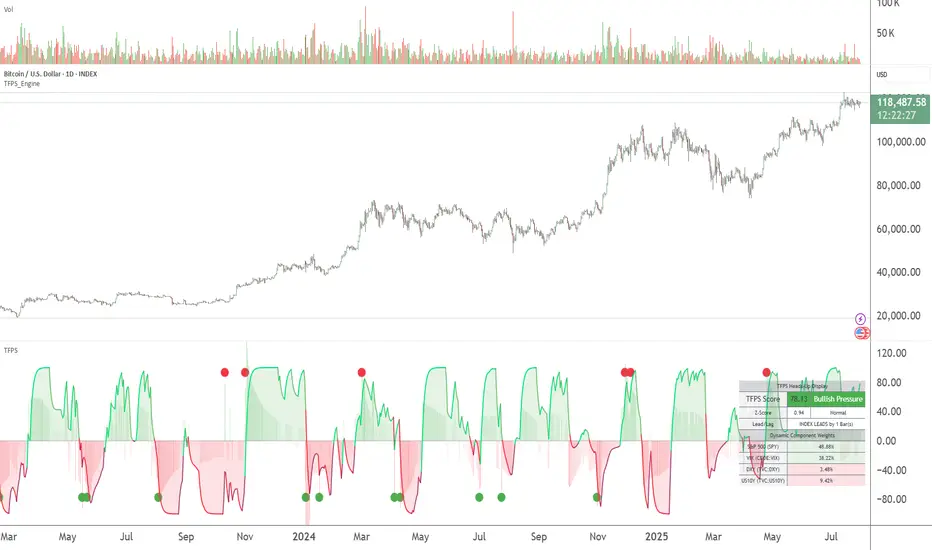
TFPS_EngineLibrary "TFPS_Engine"
f_calculate_lead_lag(series1, series2, length, max_lag)
Parameters:
series1 (float)
series2 (float)
length (int)
max_lag (int)
f_calculate_pressure_score(spx_ticker, vix_ticker, dxy_ticker, us10y_ticker, benchmark_source, trend_lookback, score_smoothing, use_dynamic_weights, corr_lookback, w_spx, w_vix, w_dxy, w_us10y, zscore_lookback, max_lag)
Parameters:
spx_ticker (string)
vix_ticker (string)
dxy_ticker (string)
us10y_ticker (string)
benchmark_source (float)
trend_lookback (int)
score_smoothing (simple int)
use_dynamic_weights (bool)
corr_lookback (int)
w_spx (float)
w_vix (float)
w_dxy (float)
w_us10y (float)
zscore_lookback (int)
max_lag (int)
LeadLagOutput
Fields:
best_lag (series int)
max_corr (series float)
TFPS_Output
Fields:
historical_score (series float)
smoothed_score (series float)
z_score (series float)
regime_signal (series int)
lead_lag_bars (series int)
lead_lag_corr (series float)
weight_spx (series float)
weight_vix (series float)
weight_dxy (series float)
weight_us10y (series float)
Ghost Month HighlighterGhost Month and Trading: Understanding the Phenomenon
Ghost Month (鬼月) is the seventh month of the lunar calendar in Chinese culture, typically falling between late July and September. During this period, it's believed that the gates of the afterlife open and spirits roam the earth. This deeply rooted cultural belief has significant implications for Asian markets, particularly in regions with large Chinese populations like Taiwan, Hong Kong, Singapore, and mainland China.
Why Markets Often Decline or Stay Flat During Ghost Month:
Reduced Business Activity : Many businesses avoid launching new products, signing major contracts, or making significant investments during this period, believing it brings bad luck.
Property Market Slowdown : Real estate transactions drop significantly as people avoid moving homes or making large purchases. In some markets, property sales can decline by 20-30%.
IPO and M&A Drought : Companies often delay IPOs and merger announcements until after Ghost Month, reducing market catalysts.
Retail Spending Drops : Consumer spending on big-ticket items decreases, though spending on offerings and religious items increases.
Self-Fulfilling Prophecy : Many traders and investors reduce positions or stay on the sidelines, creating lower volumes and increased volatility. This becomes a self-fulfilling prophecy where expectation of poor performance leads to actual underperformance.
Tourism and Entertainment Impact : Travel and entertainment sectors see reduced activity as people avoid unnecessary trips and celebrations.
Historical data shows that Asian equity markets often underperform during Ghost Month, with some studies indicating average returns can be 2-5% lower than other months. However, this also creates opportunities for contrarian investors who buy during the seasonal weakness.
Inspired by @honey_xbt

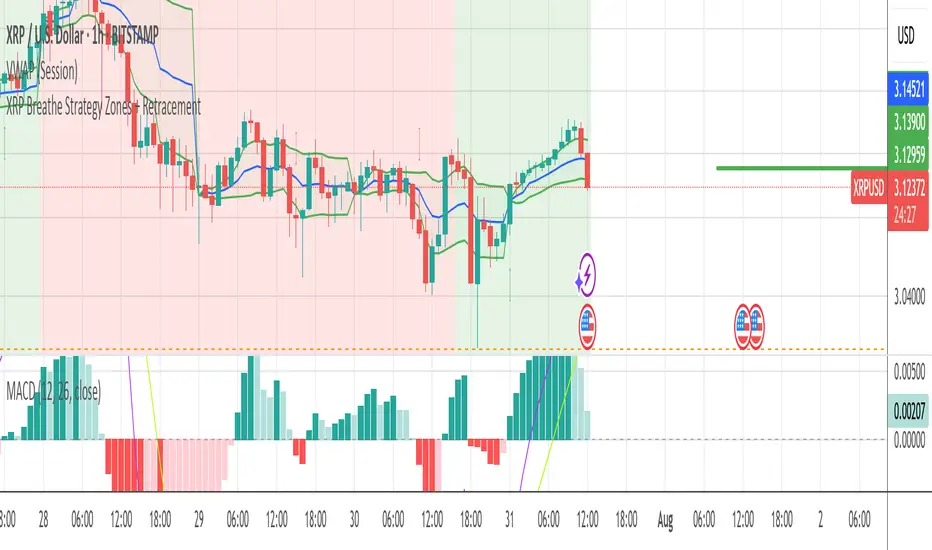
XRP Breathe Strategy Zones + RetracementGreen/red backgrounds = Inhale/Exhale phase timing
Horizontal lines at $3.65 / $3.00 / $2.60 for reference
MACD arrows = entry/exit hints within phase context
New yellow/purple retracement lines:
Inhale → yellow line = pullback buy zone
Exhale → purple line = potential rally target or short zone
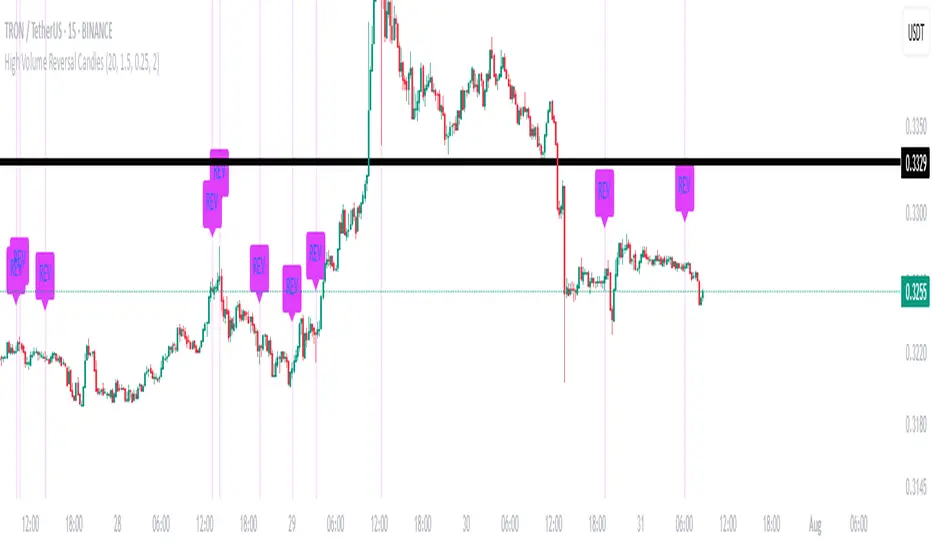
High Volume Reversal CandlesIdentifies candles which display reversal patterns (mainly hammers, inverted hammers, spinning top) on unusually high volume.
This makes the candlestick pattern more likely to fulfil.
Remember to always wait for confirmation; should only be used as an entry locator, not entry trigger.
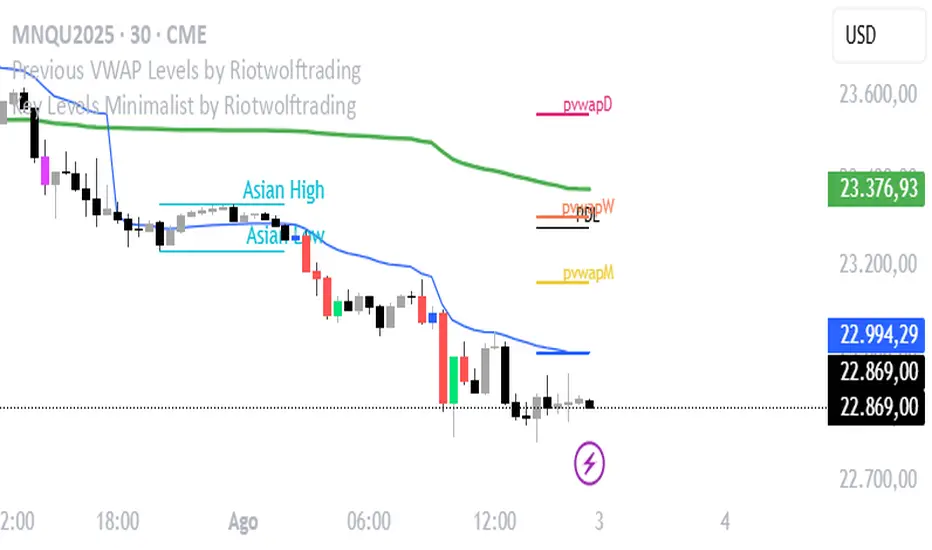
Previous VWAP Levels by Riotwolftrading The "Previous VWAP" indicator calculates and displays the previous session's Volume Weighted Average Price (VWAP) for five timeframes (Daily, Weekly, Monthly, Quarterly, Yearly).
Each VWAP is plotted as a horizontal line extending to the right edge of the chart, with customizable labels at the right to identify each level. The indicator is designed for traders who want to visualize key price levels from prior periods without cluttering the chart with current VWAPs or additional metrics like standard deviations.
**Functionality**:
- **Calculates Previous VWAPs**: Computes the VWAP for the previous session of each timeframe (Daily, Weekly, Monthly, Quarterly, Yearly) based on the input source (default: `hlc3`) and volume.
- **Visual Style** : Uses `line.new` to draw horizontal lines from five bars back to the current bar, ensuring the lines extend to the right edge of the chart. Labels are placed at the right edge using `label.new` for clear identification.
- **Customization** : Allows users to toggle visibility, adjust line styles, widths, colors, and label sizes, and choose between abbreviated or full label text.
- **Minimalist Design**: Focuses solely on previous VWAPs, omitting current VWAPs, rolling VWAPs, and standard deviation bands to keep the chart clean.
**Intended Use**: This indicator is useful for traders who rely on historical VWAP levels as support/resistance or reference points for trading decisions, particularly in strategies involving mean reversion or breakout trading.
---
### Rules and Features
*VWAP Calculation**:
- The VWAP is calculated as the cumulative sum of price (`src`) multiplied by volume (`sumSrcVol`) divided by the cumulative volume (`sumVol`) for each timeframe.
- The "previous VWAP" is the VWAP value from the prior session, captured when a new session begins (e.g., new day, week, month, etc.).
- The indicator uses the `hlc3` (average of high, low, close) as the default source, but users can modify this in the settings.
**Timeframes**:
- **Daily**: Previous day's VWAP.
- **Weekly**: Previous week's VWAP.
- **Monthly**: Previous month's VWAP.
- **Quarterly**: Previous quarter's VWAP (3 months).
- **Yearly**: Previous year's VWAP (12 months).
- New sessions are detected using `ta.change(time(period))` for each timeframe.
**Line Drawing**:
- Lines are drawn using `line.new` from `time ` (five bars back) to the current bar (`time`), ensuring they extend to the right edge of the chart.
- Lines are updated only on the last confirmed bar (`barstate.islast`) to optimize performance and avoid repainting.
- Previous lines are deleted (`line.delete`) to prevent overlapping or clutter.
**Labels**:
- Labels are drawn at the right edge (`x=time`, `xloc=xloc.bar_time`) with `label.new`.
- Users can choose between abbreviated labels (e.g., "pvD" for Previous Daily VWAP) or full labels (e.g., "Prev Daily VWAP").
- Label sizes are customizable (`tiny`, `small`, `normal`, `large`, `huge`).
- Labels are deleted (`label.delete`) on each update to maintain a clean chart.
5. **Customization Options**:
- **Visibility**: Toggle each VWAP (Daily, Weekly, Monthly, Quarterly, Yearly) on or off.
- **Colors**: Individual color settings for each VWAP line and label (default colors: Daily=#E12D7B, Weekly=#F67B52, Monthly=#EDCD3B, Quarterly=#3BBC54, Yearly=#2665BD).
- **Line Style**: Choose from `solid`, `dotted`, or `dashed` lines.
- **Line Width**: Adjustable from 1 to 4 pixels.
- **Label Settings**: Enable/disable labels, abbreviate text, and select label size.
- **Source**: Customize the price source (default: `hlc3`).
**Performance Optimization**:
- The indicator only updates lines and labels on the last confirmed bar to minimize computational overhead.
- Uses `var` to initialize variables and avoid unnecessary recalculations.
- Deletes previous lines and labels to prevent chart clutter.
---
### Usage Instructions
1. **Add to Chart**:
- In TradingView, go to the Pine Editor, paste the script, and click "Add to Chart."
- The indicator will overlay on the price chart, showing previous VWAP lines and labels.
2. **Configure Settings**:
- Open the indicator settings to customize:
- Toggle visibility of each VWAP timeframe.
- Adjust colors, line style, and width.
- Enable/disable labels, choose abbreviation, and set label size.
- Modify the source if needed (e.g., use `close` instead of `hlc3`).
3. **Interpretation**:
- **Previous VWAPs**: Act as dynamic support/resistance levels based on the prior session's volume-weighted price.
- **Timeframes**: Use shorter timeframes (Daily, Weekly) for intraday/swing trading, and longer timeframes (Monthly, Quarterly, Yearly) for positional trading.
- **Labels**: Identify each VWAP level at the right edge of the chart for quick reference.
4. **Best Practices**:
- Use on charts with sufficient volume data, as VWAP relies on volume (a warning is triggered if no volume data is available).
- Combine with other indicators (e.g., moving averages, RSI) for confirmation in trading strategies.
- Adjust line styles and colors to avoid visual overlap with other chart elements.
---
### Example Use Case
A trader using a 1-hour chart can add the "Previous VWAP" indicator to identify key levels from the prior day, week, or month. For example:
- The Previous Daily VWAP might act as a support level for a bullish trend.
- The Previous Weekly VWAP could serve as a target for a swing trade.
- Labels at the right edge make it easy to identify these levels without cluttering the chart.
This indicator provides a clean, customizable way to visualize previous VWAPs, making it ideal for traders who want historical price context with minimal chart noise. For the complete Pine Script code, refer to the artifact provided in the previous response.
TZtraderTZtrader
This is a TrendZones version with features to set stoploss and targets in short and long positions meant for use in intraday charts. It aims to provide signals for opening and closing long and short positions. In the comments under the TrendZones publication several people expressed a need for features for a short position similar to those for a long position as implemented in TrendZones, some want to use it for scalping, some asked for alerts. When I proposed to create a version for day trading with target lines based on ATR, several people liked the idea.
Full disclosure: I don’t do day trading, because, after I lost a lot of money, I had to promise my wife to stay away from it. I restrict myself to long term investing in stocks which are in uptrend. However I understand what a day trader needs. I gather from my experience that day trading or scalping is an attempt to earn something by opening a position in the morning and close, reopen and close it again during the day with a profit. It is usually done with leveraged instruments like CFD’s, futures, options, and what have you. Opening and closing positions is done within minutes, so the trader needs a quick and efficient way to set proper stoploss and target. TZtrader supports this by showing only three or four numbers on the price bar: The price of the instrument, The logical stop level (gray or green or maroon dots), and the target level (navy). All other numbers are suppressed to prevent mistakes. Also a clear feedback for current settings at the top-center of the pane and an alert feedback at bottom that flashes alerts during the development of the current bar and gives suppression status.
The script
First I made a bare bones version of TrendZones to which I added code for long and short trading setups and a bare setup for no position. The code for the logical stops in long setup had to be reviewed, after which this became the basis for stops in short setup.
Then I added code for 10 alert messages, which was a hassle, because this is the first time I coded alerts and the first time I used an array as a stack to avoid a complicated if-then construction. During testing the array caused a runtime error which I solved by adding ‘array.clear’ to the code, also I discovered that in TradingView separate alerts have to be created for all three setups - short, long and bare. Flipping setups is done in the inputs with a dropdown menu because Pine Script has no function for a clickable button.
One visual with three setups.
The visual has the TrendZones structure: Three near parallel very smooth curves, which border the moderate uptrend (green) and downtrend (orange) zone over and under the curve in the middle, the COG (Center Of Gravity). Where the price breaks out of these curves, strong trend zones show up over and under the curves, respectively strong uptrend (blue) and strong downtrend (red).
Three setups were made clearly different to avoid confusion and to provide oversight in case of multiple trades going on simultaneously which I imagine are monitored in one screen. You have to see which one is long, which short and which have no position. The long setup should not trigger short signals, nor should the short trigger long signals nor the bare setup exclusive long or short signals.
The Long setup is default, shown on the example chart. In this setup the Stoploss suggestions (green, gray and maroon dots) are under the price bars and the target line (navy) at a set distance above the High Border. A zone with a width of 1 ATR is drawn under the Low Border. In this setup 5 specific alerts are provided
The Short setup has the Stoploss suggestions over the price bars, the target line at a set distance under the Low Border. A zone with a width of 1 ATR is drawn above the High Border. This setup also has 5 specific alerts.
The Bare setup has no Stoploss suggestions, no target line and supports 4 alerts, 2 in common with the Long setup and 2 with Short.
The table below gives a summary of scripted alerts:
Setup = Where = When = Purpose
Long, Bare = Green Zone = Bars come from lower zones = Uptrend starts
Long, Bare = Green Zone = Sideways ends in uptrend = Uptrend resumes
Long = COG = First crossing = Uptrend might end warning
Long = Orange Zone = Bars come from higher zones = Uptrend ended take care
Long = Red Zone = Bars come from higher zones = Strong downtrend->close Long
Short, Bare = Orange Zone = Bars come from higher zones = Downtrend starts
Short, Bare = Orange Zone = Sideways ends in downtrend = Downtrend resumes
Short = COG = First crossing = Downtrend might end warning
Short = Green Zone = Bars come from lower zones = Downtrend ended take care
Short = Blue Zone = Bars come from lower zones = Strong uptrend -> close short
You can use script alerts in TradingView by clicking the clock in the sidebar, then ‘create alert’ or plus, as condition you choose ‘Tztrader’ in the dialog box, then the “Any alert() function call” option (the first item in the list). The script lets the valid alert trigger by TradingView after the bar is completed, this can differ from the flashed messages during its formation.
When you create alerts in Tradingview, I advice to do that for each setup, then to make only the alert active which matches the current setup, pause the other ones.
Suppressing false and annoying signals
The script has two ways to suppress such signals, which have to do with the numbers in the alert feedback. The numbers left and right of the message with a colored background, depict the zones in which the previous (left) and current (right) bar move. 1 is the strong downtrend zone (red), 2 the moderate downtrend zone (orange), 3 the sideways zones (gray), 4 the COG (gray), 5 the moderate uptrend zone (green), 6 the strong uptrend zone (blue), 7 something went wrong with assigning a zone (black). In extensive testing the number 7 never occurs, because I catch that error in the code. The idea is that an alert is only triggered if the previous bar was in a different zone. When the bars are in the same zone, no alert is possible. This way all annoying signals are suppressed and long, short and bare get the appropriate alerts.
The third number is a counter. It counts how often the COG is crossed without touching the outer curves. The counter will reset to zero when the upper or lower curve is touched. When the count is 1 you have zone situation 4 and appropriate alerts are flashed. When the count is 2 or higher, a sideways situation (3) is called and while the recrossings are going on, no alerts can be flashed. This suppresses false signals. The ATR zone and curves are brownish-gray where sideways happens(ed). When the channel is narrowed down to just the three curves, some false signals still might occur.
Inputs
“Setup”, default is long, drop down menu provides long, short and bare.
“Target ATR”, default is 2, sets the amount of ATR for the target line. In 1 minute charts 4 seems an appropriate setting, you have to learn by experience which setting works.
“show feedback …” default is on, This creates two feedback labels, a Setup feedback on top of the pane, which shows charted instrument, Setup type, Trend and timeframe of the chart. Background color of Trend feedback is green when it matches the setup, red when mismatches and gray when no match. The alert feedback at the bottom of the pane shows a number, a message and two numbers. The numbers will be explained in the chapter about false and annoying signals below. During formation of the bar, valid alerts are flashed with a blue background, otherwise the message ‘alerts for current bar suppressed’.
Logical Stops
The curves are the logical place to put stops, because, as these are averages of the high and low border of a Donchian channel, they signify the ‘natural’ current highest, lowest and main level in the lookback period that fit the monitored trend setup. A downtrend turns into an uptrend when a breakout of the upper curve occurs. If you are short, that is where you want to close position, so the logical place for the stoploss is the upper curve. Vice versa, when you are long, the logical stop is on the lower curve. The stops show up as green or gray dots on the curves, the green dots signify a nice entry level, the gray stops are there to suggest levels where unrealized profits might be secured, the maroon dots indicate that the trend mismatches the setup.
COG versus other lines
Any line used to identify a trend, be it some MA or some other line, is interpreted the same way: When the bars move above the line there is an uptrend and when below, a downtrend. COG is not different in that sense. If you put such a line in the same chart as TZtrader, you can see situations in which the other line shows uptrend or downtrend earlier than COG, also some other lines, e.g. Hull MA, are very good at showing tops and bottoms, while COG ignores these. On the other hand the other lines are usually a little nervous and let you shake out of position too soon. Just like the other lines, COG gives false signals when it is near horizontal. The advantage of the placement COG is the tolerance for pull backs. This way TZtrader keeps you longer in the trend. Such pull backs are often ‘flags’ which are interpreted in TA as confirming the trend. Tztrader aims to get you in position reasonably soon when a trend begins and out of position as soon as the trend turns against you. The placement of COG is done with a fundamentally different algorithm than other lines as it is not an average of prices, but the middle of two averages of borders of a Donchian channel. This gives the two zones between the curves the same quality as the two zones above and below the middle line of a standard Donchian Channel.
A multi timeframe application.
In this scenario you put a 5 minutes and 1 minute chart with Tztrader side by side. If the 5 minutes shows uptrend, set the 1 minute on long trading and open positions when the trend matches uptrend en close when it mismatches. Don’t open short positions. Once the 5 minute changes to downtrend, set Tztrader in the 1 minute to short trading and open positions when the trend matches downtrend and close when it mismatches.
The idea is that in a long ‘context’, provided by the 5 minutes, the uptrends in the 1 minute will last longer and go further, vice versa for the short ‘context’. This way you do swing trading in the 5 minute in a smart way, maximizing profits.
You can do this with any timeframe pairs with a proportion of around 5:1, 4:1, 6:1, like e.g. 60 minutes and 15 minutes or weeks and days (5 trading days in a week).
Dear day-traders, may this tool be helpful and may your days be blessed.
Take care

Simple Trend Indicator (Heikin-Ashi) | Lyro RSSimple Trend Indicator (Heikin-Ashi)
A momentum oscillator using Heikin-Ashi smoothed data to filter trend direction with zero-line crosses.
This indicator calculates the normalized deviation of Heikin-Ashi OHLC values from their Simple Moving Average (SMA), then averages these deviations into a single oscillator. It simplifies trend detection by:
Reducing noise via Heikin-Ashi smoothing.
Highlighting momentum shifts through a zero-line cross system (bullish/bearish).
Providing clear visual signals with color-coded plots and directional dots.
Originality:
Unlike standard momentum oscillators, this tool uniquely combines:
Heikin-Ashi normalization for cleaner trend analysis.
Multi-component averaging (high, open, low, close) to balance sensitivity.
Minimalist design for clutter-free charting.
How It Works:
Data Input: Fetches Heikin-Ashi OHLC values using request.security().
Momentum Calculation: For each Heikin-Ashi component:
Computes % deviation from its SMA: (value − SMA(value, length)) / SMA(value, length) * 100.
Oscillator: Averages deviations of all four components into one line (sum).
Signals:
Bullish: Oscillator > 0 (green).
Bearish: Oscillator < 0 (red).
Cross Confirmation: Dots (⦿) mark zero-line crosses.
Usage:
Trend Following: Enter long/short on sustained oscillator breaks above/below zero.
Reversal Watch: Zero-line crosses may hint at weakening momentum.
Filter: Combine with volume or support/resistance levels.
⚠️Disclaimer: This indicator is a tool for technical analysis and does not provide guaranteed results. It should be used in conjunction with other analysis methods and proper risk management practices. The creators of this indicator are not responsible for any financial decisions made based on its signals.

Smart EntrySmart Entry, has been made after going through multiple variations of codes to arrive at a simple structure where one can control the number of signals the indicator throws out via the indicator parameters. Recommended time frame is 5 minutes.
