SulLaLuna M2 Hull DetectorAbsolutely — here's a polished **TradingView script description/article** you can publish with your indicator. It blends clarity, inspiration, respect, and community wisdom — SulLaLuna style.
---
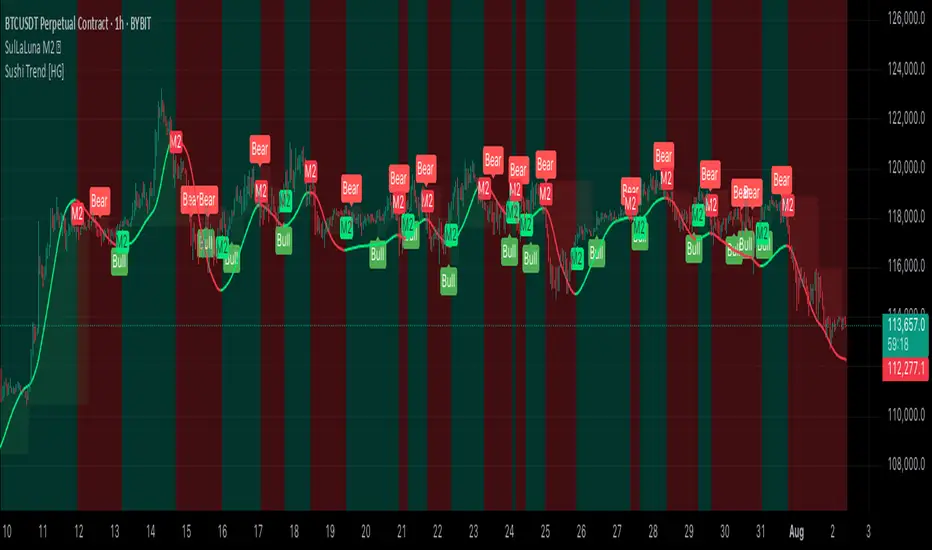
## 🌕 SulLaLuna M2 Hull Detector 💵
### 🧠 Track Global Liquidity. Time Your Trades with Confidence.
This indicator lets you visualize shifts in global liquidity by analyzing the **aggregate Global M2 Money Supply** (adjusted by FX rates) and applying the legendary **Hull Moving Average** to detect clean trend pivots.
When **money flows in**, markets often rise.
When **liquidity contracts**, caution is wise.
> **This tool helps you detect those pivots—visually, simply, and powerfully.**
---
### 📈 How It Works
* ✅ Pulls M2 money supply from over 20 economies (adjusted to USD using FX)
* ✅ Normalizes to your current chart so you can visually track macro liquidity
* ✅ Applies **Hull MA** to smooth the trend and reduce lag
* ✅ Flags **bullish and bearish flips** with M2 markers on chart
* ✅ Optional color-coded background for macro awareness
* ✅ Fully customizable: control colors, opacity, and visibility
---
### ⚡ How to Use It
1. **Watch for a flip.**
A green "M2" label indicates rising liquidity → bullish conditions.
A red "M2" label indicates declining liquidity → caution.
2. **Look for confluence.**
Use this alongside your preferred system.
For example, we love combining it with the **Sushi Trend Indicator**.
> If **Sushi flips bullish**, and **M2 flips bullish** — strong case for a long.
> If **Sushi is bearish**, and **M2 flips bearish** — potential short setup.
> Both directions can earn, if you time it right.
3. **Apply sound risk management.**
Use stop-loss (SL), take-profit (TP), and position sizing that fits your system.
> 🔑 **"Scared money don't make no money."**
> — *Krown Chakra*
---
### 🙏 Acknowledgements
Massive thanks to:
* The **TradingView team** for the platform that empowers this kind of sharing
* The creators of public M2 and FX feeds
* The developers of the **Hull MA**, whose innovation this tool builds on
* Our fellow SulLaLuna traders — F.I.R.E. Decibels — who live and trade with purpose
---
### ⚠️ Disclaimer
This indicator is **not financial advice** and **no indicator is perfect**.
Always trade with logic, discipline, and confluence across systems.
---
If you find this helpful, please:
* ⭐ Add it to your favorites
* 💬 Drop a comment
* 🔁 Share it with a trader who needs a compass in macro chaos
Stay sharp. Stay sovereign.
— **Team SulLaLuna** 🌕
Indicators and strategies
Footprint-Style Order Flow by Kalibea📊 Indicator: "Footprint-Style Order Flow by Kalibea"
Simplified Order Flow Analysis for TradingView
This indicator was created by Kalibea to bring you the power of Order Flow analysis in a clear, practical way—without technical complexity and fully compatible with TradingView.
While TradingView doesn’t support traditional footprint charts, this tool simulates institutional market reading using a smart calculation of estimated volume delta, helping you make more informed trading decisions.
🔍 What does this indicator do?
Estimated Delta: Calculates the difference between buying and selling pressure per candle, based on price movement and volume.
Smart Visual Signals:
🔼 Green Triangle: Potential buy entry (buyer dominance).
🔽 Red Triangle: Potential sell entry (seller dominance).
Delta Histogram: Displays whether each candle was driven more by buyers or sellers.
Live Labels: Shows real-time delta values above each candle for quick interpretation.
🧠 How does it help your trading?
Detects real-time market imbalances (who's in control: buyers or sellers).
Improves entry and exit timing, especially on lower timeframes.
Helps you confirm other strategies such as supply/demand zones, support/resistance, or candlestick patterns.
Provides an institutional-style reading simplified for use within TradingView.
⚙️ Fully Customizable to Your Style
Adjust the delta sensitivity to suit any market: Forex, Crypto, Indices, and more.
Turn on/off visual signals and histogram as needed.
🔑 Recommended by Kalibea for:
✅ Intraday traders and scalpers
✅ Traders looking to take the next step into institutional-style analysis
✅ Those seeking precise entries without overcomplicating their charts
💬 “Order Flow is the market’s internal voice. This indicator helps you hear it—no expensive footprint software required.”
— Kalibea

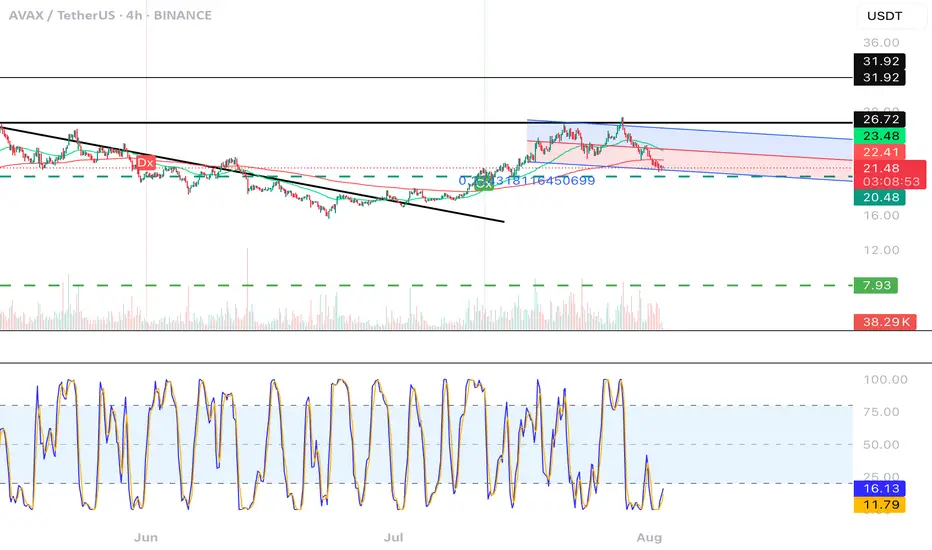
CGPT Golden Cross / Death Cross AlertThis custom indicator identifies Golden Cross (Gx) and Death Cross (Dx) events using either EMA or SMA moving averages. A Golden Cross occurs when a short-term MA (e.g., 50) crosses above a long-term MA (e.g., 200), signaling potential bullish momentum. A Death Cross signals potential bearish momentum, with the short-term MA crossing below the long-term MA.
It includes:
📈 Customizable MA types (EMA or SMA)
⚙️ Adjustable fast & slow MA lengths
🟢🔴 Chart labels for Gx (green) and Dx (red)
🎯 Background highlights for visual trend shifts
🔔 Built-in alert conditions for real-time notifications
Ideal for crypto, stocks, or forex swing and trend trading
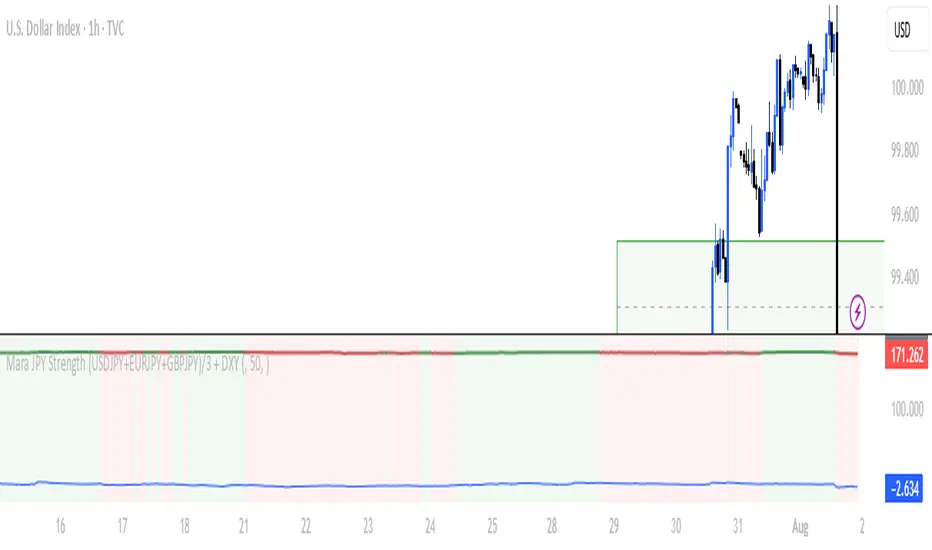
Mara JPY Strength (USDJPY+EURJPY+GBPJPY)/3 + DXYJPY, USDJPY, EURJPY, GBPJPY, smart money, bias, index, forex indicator, DXY, strength meter, professional, trading tool, price action

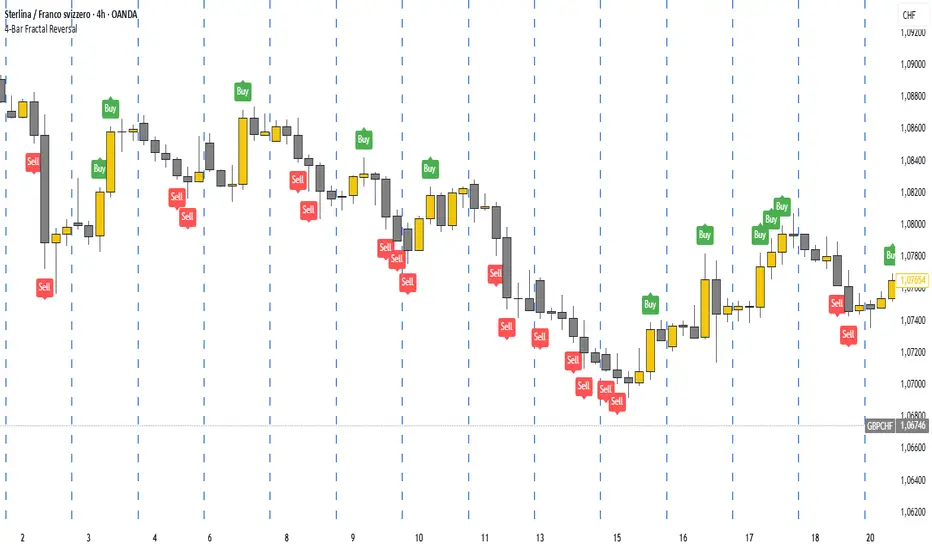
4-Bar Fractal ReversalTitle: 4-Bar Fractal Reversal
Description:
The "4-Bar Fractal Reversal" is a clean and effective tool for identifying potential market reversals based on pure price action logic.
📈 How It Works:
This indicator scans for a 4-bar fractal pattern where the current candle (bar 0) acts as the confirmation bar. A reversal signal is generated when:
Bullish Reversal (Buy): The current close is higher than both the high of 1 bar back and the high of 3 bars back.
Bearish Reversal (Sell): The current close is lower than both the low of 1 bar back and the low of 3 bars back.
⚙️ Features:
Works on any timeframe.
Customizable display: choose to show or hide symbols and/or labels.
Includes alerts for both bullish and bearish setups.
This tool allows traders to react only after confirmation, reducing false signals and providing a more disciplined approach to reversal trading.
Indicator born following the viewing of the following video.
www.youtube.com
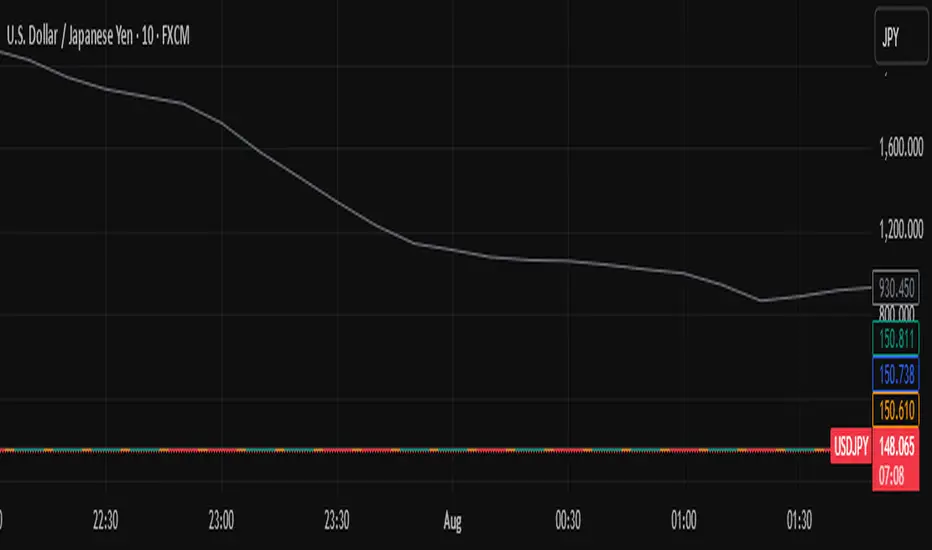
Mara JPY Bias ProMara JPY Bias Pro™ is a precision tool built for serious traders who focus on JPY and USD pairs.
This synthetic index combines USDJPY + EURJPY + GBPJPY, generating a smooth and dynamic representation of JPY strength or weakness. When the line turns green, JPY is weakening — time to look for LONG setups on XXX/JPY pairs. When red, JPY is strengthening — ideal moment for SHORT trades.
Built-in bias logic with adjustable MA-based trend detection or slope/momentum view lets you customize signals based on your strategy.
Plus, we’ve included a normalized DXY overlay, so you can track USD strength in parallel — perfect for traders working with EUR/USD, GBP/USD, USD/JPY and JPY crosses.
💡 Designed for day traders, scalpers, and smart money traders looking for clean confluence.
✅ Features:
Visual color-coded JPY bias (Green = Long / Red = Short)
Optional USD (DXY) strength overlay
Customizable MA length and bias logic
Built-in alerts for bias shifts & momentum flips
🔔 Alert-ready – never miss a reversal.
Trade smarter. Cut the noise. Stay on the right side of the move.
seed_data_library_5Library "seed_data_library_5"
setCombinedMap2A(m)
Parameters:
m (map)
setCombinedMap2B(m)
Parameters:
m (map)
getMarketCap(ticker)
Parameters:
ticker (string)
getRSRating(ticker)
Parameters:
ticker (string)
getIndustry(ticker)
Parameters:
ticker (string)
getSector(ticker)
Parameters:
ticker (string)

seed_data_library_4Library "seed_data_library_4"
setCombinedMap1A(m)
Parameters:
m (map)
setCombinedMap1B(m)
Parameters:
m (map)
getMarketCap(ticker)
Parameters:
ticker (string)
getRSRating(ticker)
Parameters:
ticker (string)
getIndustry(ticker)
Parameters:
ticker (string)
getSector(ticker)
Parameters:
ticker (string)
seed_data_library_3Library "seed_data_library_3"
setCombinedMap3A(m)
Parameters:
m (map)
setCombinedMap3B(m)
Parameters:
m (map)
getMarketCap(ticker)
Parameters:
ticker (string)
getRSRating(ticker)
Parameters:
ticker (string)
getIndustry(ticker)
Parameters:
ticker (string)
getSector(ticker)
Parameters:
ticker (string)

EMA 10/20/60/120// This script plots four Exponential Moving Averages (10, 20, 60, 120)
// for trend-following analysis. Crossovers and the order of the EMAs can
// help identify the strength and direction of the trend.
seed_data_library_2Library "seed_data_library_2"
setCombinedMap2A(m)
Parameters:
m (map)
setCombinedMap2B(m)
Parameters:
m (map)
getMarketCap(ticker)
Parameters:
ticker (string)
getRSRating(ticker)
Parameters:
ticker (string)
getIndustry(ticker)
Parameters:
ticker (string)
getSector(ticker)
Parameters:
ticker (string)

seed_data_library_1Library "seed_data_library_1"
setCombinedMap1A(m)
Parameters:
m (map)
setCombinedMap1B(m)
Parameters:
m (map)
getMarketCap(ticker)
Parameters:
ticker (string)
getRSRating(ticker)
Parameters:
ticker (string)
getIndustry(ticker)
Parameters:
ticker (string)
getSector(ticker)
Parameters:
ticker (string)

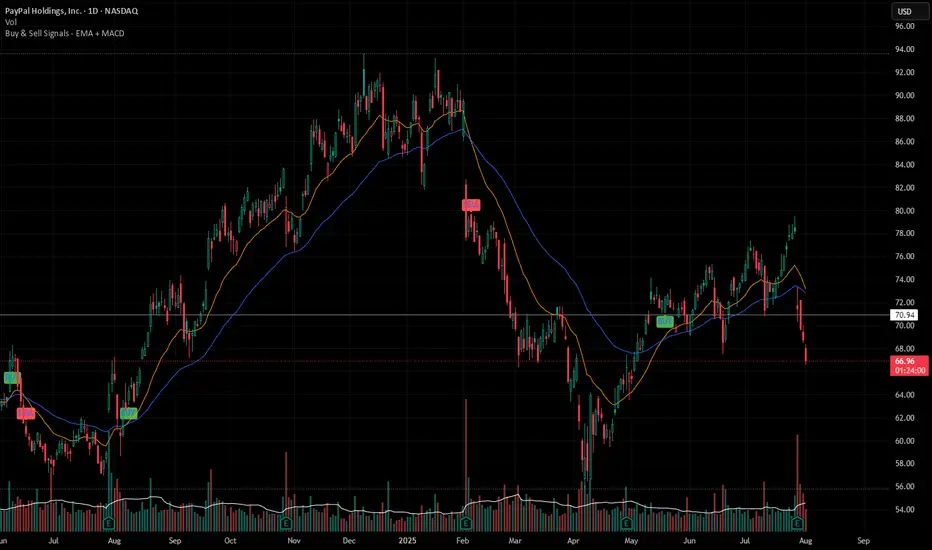
Buy & Sell Signals - EMA + MACDBuy & Sell Signals - EMA + MACD is clean and practical Pine Script for buy and sell signals using a popular combination of EMA crossover and MACD confirmation, designed for stocks, crypto, or forex swing/intraday trading.
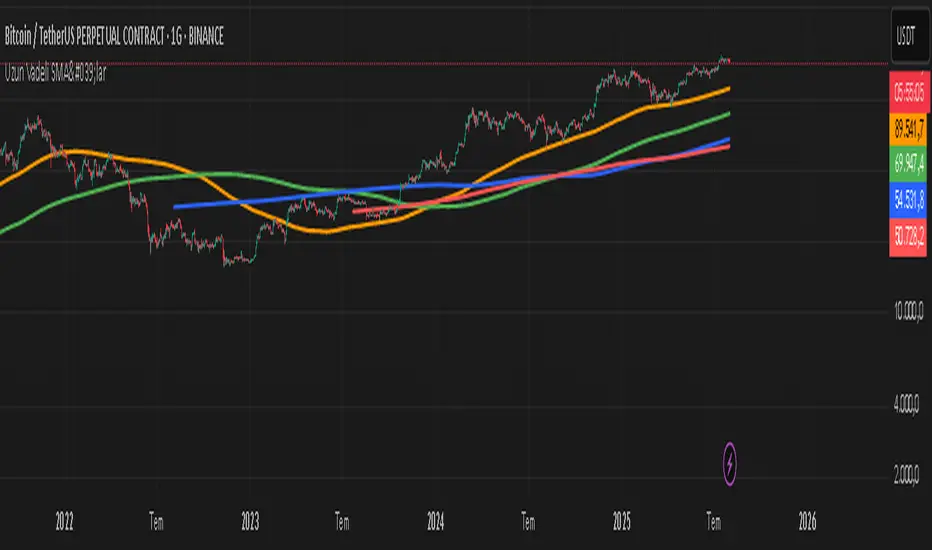
ercometiUzun Vadeli SMA'lar354 708 1062 1414 diaries for friends who want to make money in the long term
Position Sizing Based on 21-Day ATR % (30 Holdings)Vol targeting based on ATR instead of STD DEV for 30 holdings.

ASK Indicator by AshpreetThe ASK Indicator is a custom-built breakout and trend continuation system designed for swing traders seeking high-probability entries with strong risk-reward ratios. Built using a combination of moving averages, momentum filters, volume confirmation, and price structure, this indicator helps identify stocks poised for explosive moves.
It uses three key moving averages: the 44-period SMA (medium trend), 20-period DEMA (short-term strength, custom-coded), and 50-period WEMA (institutional trendline). Trades are only triggered when the price is above 50 WEMA, and the 20 DEMA is above the 44 SMA.
Momentum is confirmed using RSI(14) within a healthy zone of 40–60, ensuring the stock is not overbought or oversold. To focus on breakout candidates, the stock must be trading within 10% of its 52-week high, and the weekly candle range must be under 10%, signaling compression before expansion.
A valid ASK Signal occurs when these conditions are met along with a breakout above the previous day’s high and volume exceeding 1.5× the 20-day average. Once triggered, the indicator auto-plots the stop-loss (1× ATR) and two profit targets: 1:2 (TP1) and 1:4 (TP2).
Additionally, the system detects a narrow range setup, where the last 3 daily candles are inside the previous 3-day range — a powerful consolidation signal. Alerts for both ASK entries and narrow ranges are included.
This system is ideal for positional and short-term swing traders who want to combine structure, momentum, and volume in one powerful tool.

EMA Crossover with Volume + Stacked TP & Trailing SLI am relatively new here. Here is my humble contribution to the community. Simple does it! Ema 21,55 with volume. Surprisingly high win rates and good profit factors on USDJPY, EURJPY, BTCUSD, XAGUSD,XAUUSD, USOIL, USDCAD, EURGBP and AUDNZD. I cannot write a single line of code. I used Copilot for this.

ombs- PONY Breakout Alert
🧠 תקציר הסקריפט: **PONY Breakout Alert 📈
🔍 **מטרה**:
לזהות **פריצה מעלה של רמת 14.15** תוך כדי **מחזור מסחר גבוה מהממוצע**, כדי לאתר **הזדמנות מסחר שורית**.
---
⚙️ רכיבי הסקריפט:
* 📌 **רמת כניסה**:
`entryLevel = 14.15`
* 📊 **תנאי כניסה**:
* סגירת מחיר **מעל 14.15**
* נפח מסחר **גבוה ב־20% מהממוצע ל־20 הימים האחרונים**
* 🔔 **התראה ויזואלית**:
* סמל ירוק "Entry" מופיע מתחת לנר על הגרף
* קווים קבועים לרמות יעד וסטופלוס
* 🎯 **יעדי רווח**:
* Target 1 – 15.15
* Target 2 – 16.00
* Target 3 – 17.00
* 🛑 **סטופלוס**:
* שמרני: 13.20
* אגרסיבי: 12.80
* 🔔 **התראה אוטומטית** (`alertcondition`):
תשלח הודעה:
*"PONY פרצה מעל 14.15 עם מחזור גבוה – שקול כניסה לעסקה."*
---
📝 מתאים עבור:
* סוחרי ניתוח טכני 🧮
* מי שמחפש כניסה מבוססת על פריצה + נפח 📊
* שימוש על גרף יומי בלבד 📅
---
🧠 Script Summary: PONY Breakout Alert 📈
🔍 Objective:
Detect a breakout above the 14.15 level accompanied by high trading volume, in order to identify a bullish trading opportunity.
⚙️ Script Components:
📌 Entry Level:
entryLevel = 14.15
📊 Entry Conditions:
Price closes above 14.15
Volume is 20% higher than the 20-day average
🔔 Visual Alert:
A green "Entry" label appears below the bar on the chart
Static horizontal lines mark targets and stop-loss levels
🎯 Profit Targets:
Target 1 – 15.15
Target 2 – 16.00
Target 3 – 17.00
🛑 Stop Loss:
Conservative: 13.20
Aggressive: 12.80
🔔 Automated Alert (alertcondition):
Sends a message:
"PONY has broken above 14.15 with high volume – consider a long position."
📝 Ideal For:
Technical traders 🧮
Those seeking breakouts confirmed by volume 📊
Daily chart setups only 📅

ICT OTE Market MakerICT OTE Market Maker
Implementing ICT and automatically identifies OTE zones to minimize drawdowns.
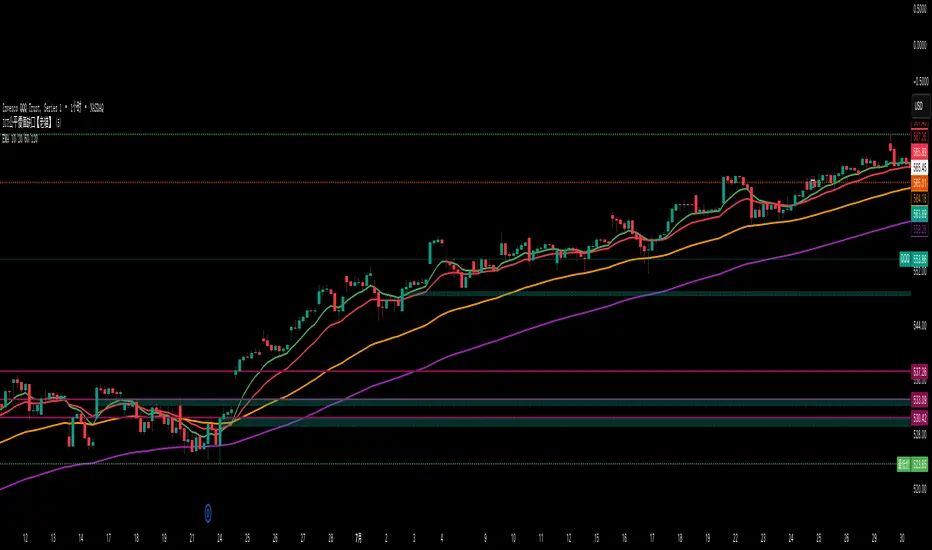
Multi EMA & SMA IndicatorDraws EMA 5/20/50/100 and SMA 200 in different colors and thickness in a single indicator

X1 newbie code trying to create
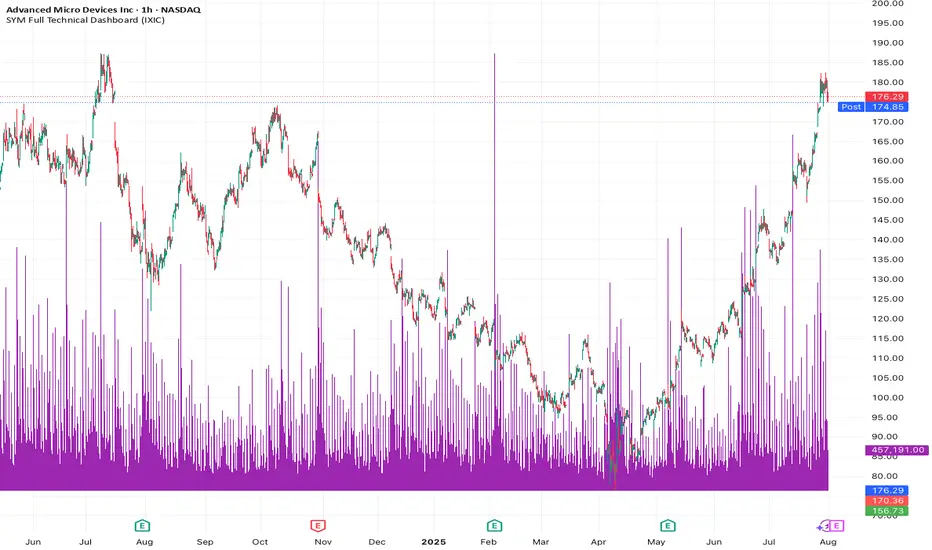
✅ Script Behavior on Other Stocks
• If you’re on a chart for SYM, it calculates indicators using SYM’s data.
• If you switch to NVDA, AVGO, CRDO, etc., it will automatically update to reflect that ticker’s:
• Price
• 50-day moving average
• Volume
• MACD
• RSI
• Index comparison
with 1. 📊 Volume shows in its own pane
2. ✅ MACD and RSI are included in separate panes (as promised)
3. 🎯 Script works cleanly with any ticker