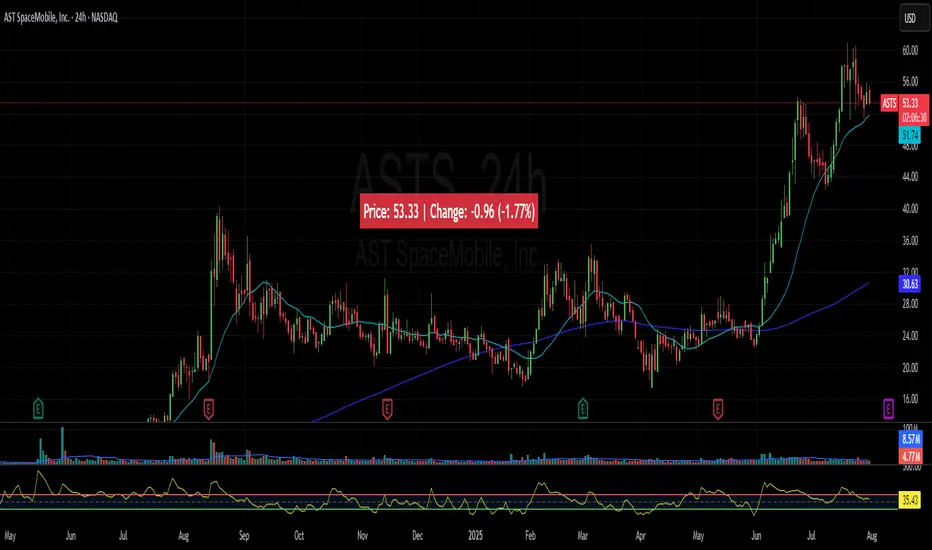
Price Widget on ScreenSimple yet useful script, to see the PRICE/CHANGE of the chart you are on. I use it in my 6/8 charts screen, so you can see the graph and the price.
Indicators and strategies
Wx2 Treasure Box Buy- Above the Box and Protect Below the Box
Sell- Below the Box Protect Above the Box
Go for Trigger Order
RRR: 1:2
Best Location is near 200SMA
Time Frame 2Min, 3Min, 5Min, & 15Min
Watch My Video
youtu.be
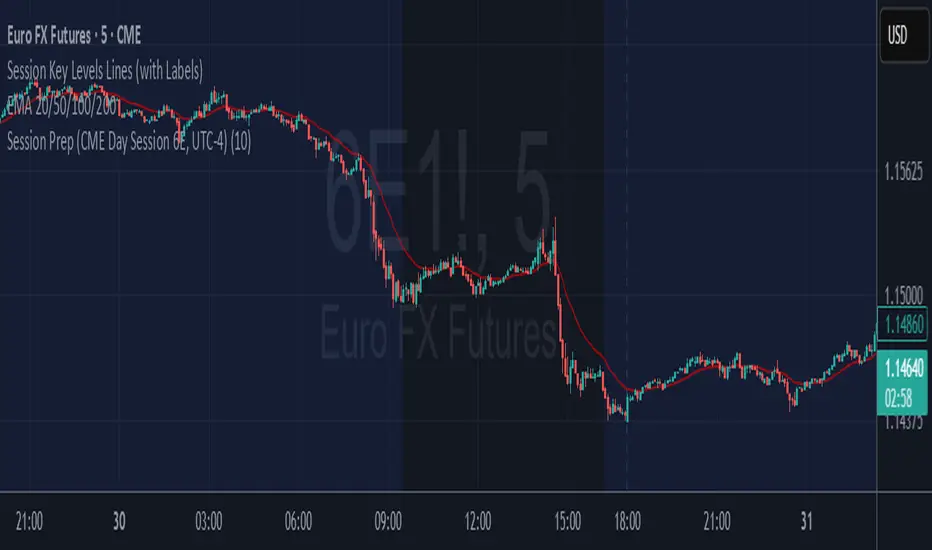
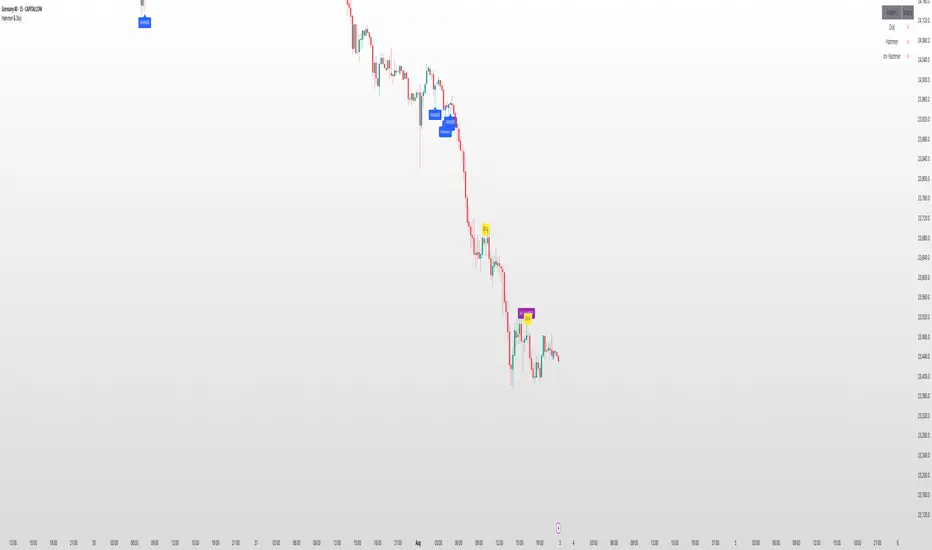
6E update Session Key Levels Lines (6E CME Day Session)6E update Session Key Levels Lines (6E CME Day Session) hope it helps :)

6E update Premarket High/Low Label (CME 6E style)6E update Premarket High/Low Label (CME 6E style). hope it helps :)
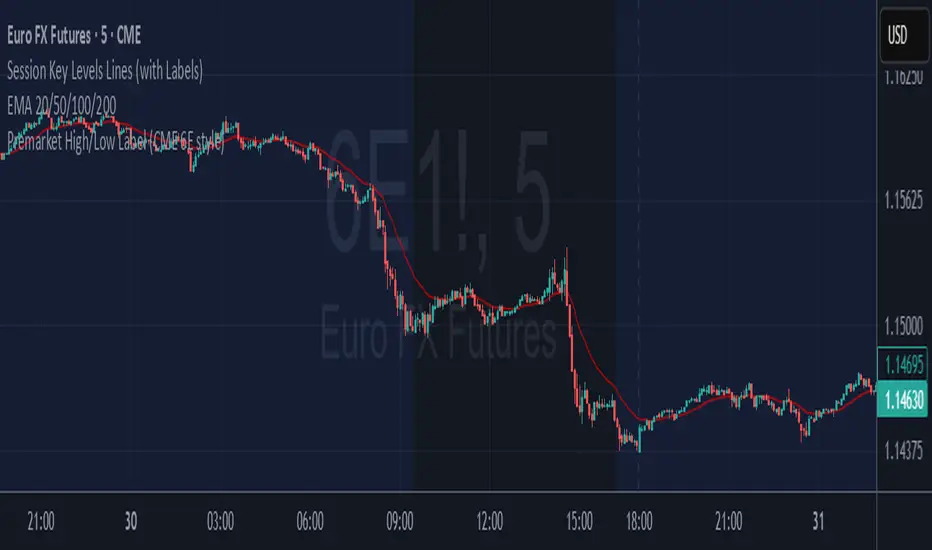
6E update Session Prep (CME Day Session 6E, UTC-4)6E update Session Prep (CME Day Session 6E, UTC-4) updated. hope it helps :)

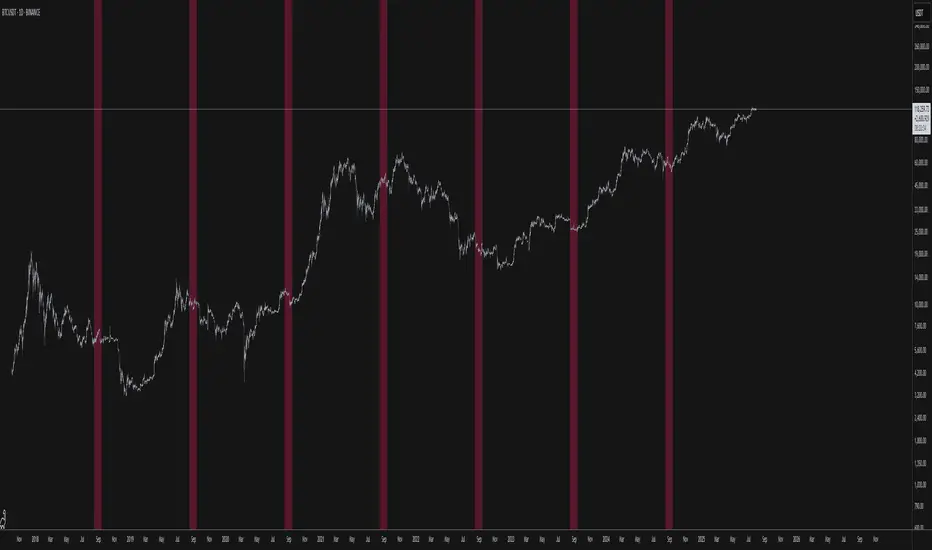
Ghost Month HighlighterThe term "Ghost Month" refers to the seventh lunar month in the Chinese calendar, a period considered inauspicious for major activities like trading or investing in some cultures, due to superstitions about spirits influencing events
ATR Plots + OverlayATR Plots + Overlay
This tool calculates and displays Average True Range (ATR)-based levels on your chart for any selected timeframe, giving traders a quick visual reference for expected price movement relative to the most recent bar’s open price. It plots guide levels above and below that open and shows how much of the typical ATR-based range has already been covered—all in one interactive table and on-chart overlay.
What It Does
ATR Calculation:
Uses true range data over a user-defined period (default 14), smoothed via RMA, SMA, EMA, or WMA, on the selected timeframe (e.g., 1h, 4h, daily) to calculate the ATR value.
Projected Levels:
Plots four reference levels relative to the open price of the most recent bar on the chosen timeframe:
+100% ATR: Open + ATR
+50% ATR: Open + 50% of ATR
−50% ATR: Open − 50% of ATR
−100% ATR: Open − ATR
Coverage %:
Tracks high and low prices for the current session on the selected timeframe and calculates what percentage of the ATR has already been covered:
Coverage % = (High − Low) ÷ ATR × 100
Interactive Table:
Shows the ATR value and current coverage percentage in a customizable table overlay. Position, color scheme, borders, transparency, and an optional empty top row are all adjustable via settings.
Customization Options
Table Settings:
Position the table (top/bottom × left/right).
Customize background color, text color, border color, and thickness.
Optionally add an empty top row for spacing.
Line Settings:
Choose color, line style (solid/dotted/dashed), and width.
Lines automatically update with each new bar on the selected timeframe, anchored to that bar’s open price.
General Inputs:
ATR length (number of bars).
Smoothing method (RMA, SMA, EMA, WMA).
Timeframe selection for ATR calculations (e.g., 15m, 1h, Daily).
How to Use It for Trading
Measure Volatility: Quickly gauge the expected price movement based on ATR for any timeframe.
Identify Overextension: Use the coverage % to see how much of the expected ATR range is already consumed.
Plan Entries & Exits: Align trade targets and stops with ATR levels for more objective planning.
Visual Reference: Horizontal guide lines and table update automatically as new bars form, keeping information clear and actionable.
Ideal For
Intraday traders using ATR levels to frame trades.
Swing traders wanting ATR-based reference points for larger timeframes.
Anyone seeking a volatility-based framework for planning stops, targets, or identifying overextended conditions.

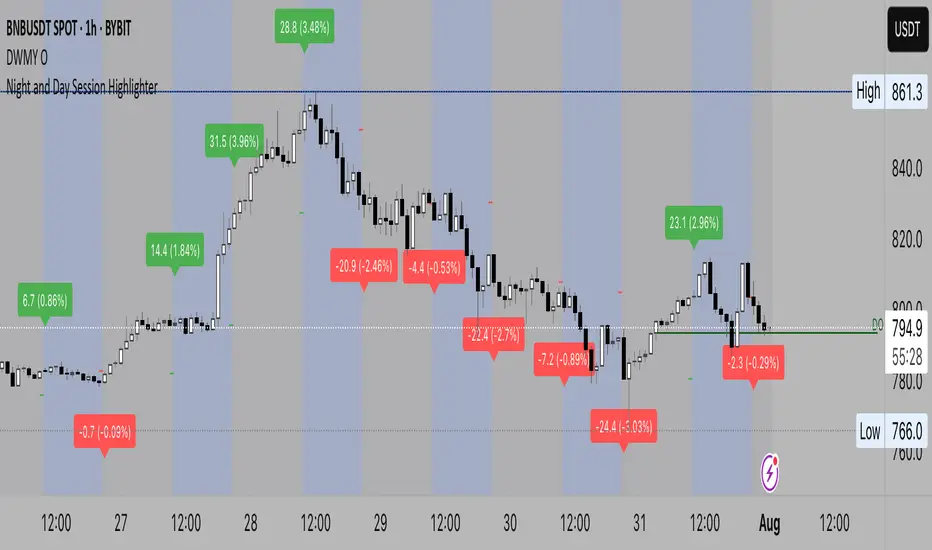
Night Session Highlight (Valehson)Highlights time range from 21:00 to 09:00 with a gray background with 90% transparency.
Dynamic Gap Probability Tool with N-Bar Decay📌 How It Works
1. Moving Average (MA) Reference
o The indicator plots a moving average (SMA, EMA, WMA, etc.) on the chart.
o Price can be above or below this moving average.
2. Probability Tracking
o Every time a bar closes, the script records:
Whether the next candle closed up (green) or down (red).
Whether within the next N bars (e.g., 3 bars ahead) the price moved higher or lower than the current close.
3. N Bar Lookahead
o Instead of only caring about the very next candle, it looks forward several bars to see if the market eventually moves in your favor.
o Example: If N = 3, it answers:
"Within the next 3 bars, what’s the chance price will go higher/lower from here?"
4. Results Table
o At the edge of your chart, the table shows:
✅ Next Green % – Probability next candle is bullish.
❌ Next Red % – Probability next candle is bearish.
📈 N Bar Bull % – Probability that within N bars, price goes higher.
📉 N Bar Bear % – Probability that within N bars, price goes lower.
💡 Why It’s Useful for Traders
• Removes Guesswork – Instead of relying on “gut feeling,” you see historical probabilities for how price reacts when above/below the MA.
• Better Trade Timing – If N Bar Bullish Probability is high, it suggests waiting for confirmation and holding longer than just 1 candle.
• Adapts to Style –
o Scalpers: Use N = 1 to see immediate probabilities.
o Swing Traders: Use N = 3, 5, or 10 to see longer-term reaction probabilities.
• Trend Awareness – Works differently above and below the moving average, giving you a bias toward long or short trades.
• Confidence in Decisions – Probabilities are based on real past data from the chart’s history.

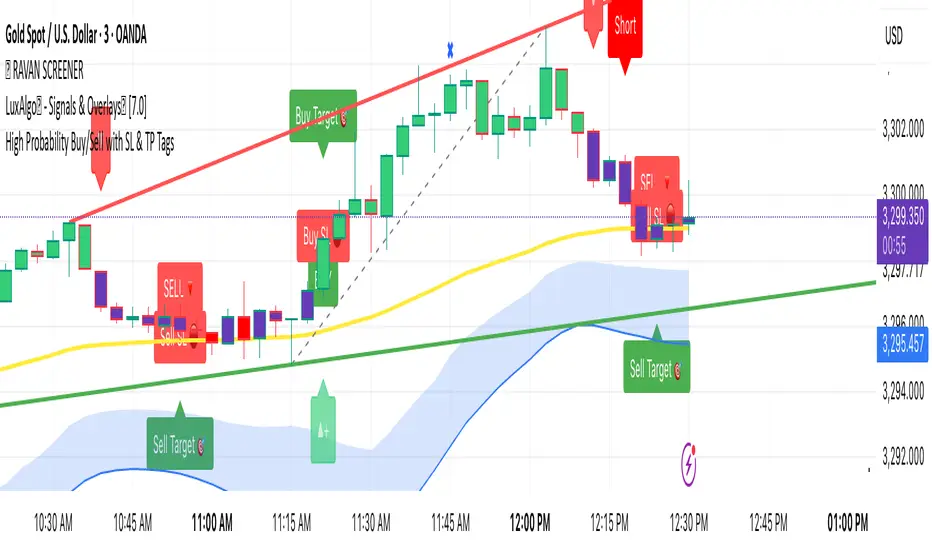
High Probability Buy/Sell with SL & TP High-accuracy Buy/Sell signals with dynamic SL & Target—perfect for scalpers and swing traders,Smart trading signals with built-in risk management. Never miss a move.Auto Buy/Sell entries with real-time SL & TP levels—trade with confidence.Turn signals into strategy. Precision entries, clear exits.Your all-in-one trading assistant: entry, stop loss, and take profit—automated.Built for serious traders: Clean signals, sharp exits, and solid risk-reward.
Fractals [Dova Lazarus]🔹 Fractals — a lightweight and efficient indicator that plots classic Bill Williams-style fractals.
Perfect for identifying local reversal points on the chart.
Simple visualization with triangle markers above and below candles.

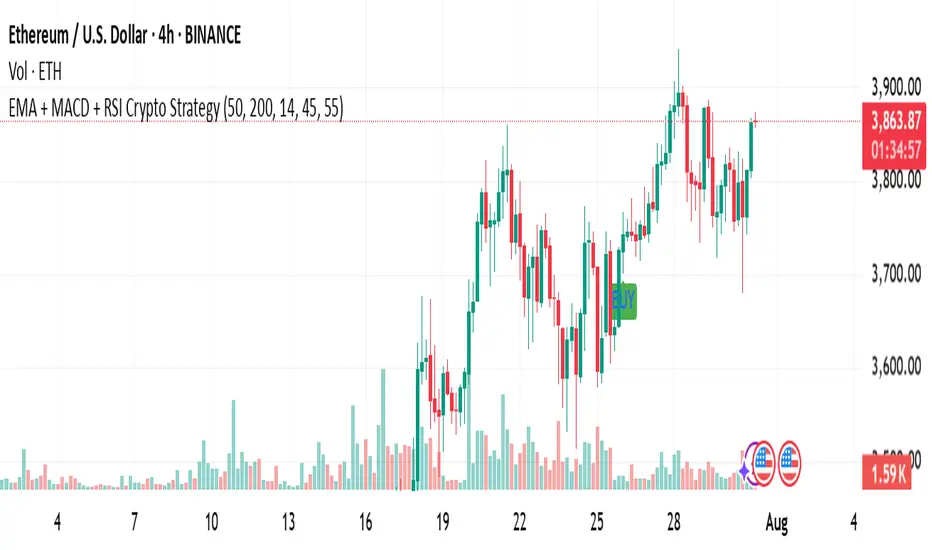
1EMA + 1MACD + 1RSI Crypto Strategy AB 092Title: EMA + MACD + RSI Crypto Strategy
Overview:
This is a trend-following and momentum-based crypto trading strategy built for 1H, 4H, and 1D timeframes, combining three proven indicators:
EMA 50 & EMA 200 Crossover – identifies long-term trend direction.
MACD Crossover (12, 26, 9) – confirms momentum shift.
RSI Filter (14) – avoids overbought/oversold traps and refines entries.
Buy Entry Conditions:
EMA 50 > EMA 200 (Golden Cross)
MACD line crosses above signal line
RSI is between 45 and 70
Sell Entry Conditions:
EMA 50 < EMA 200 (Death Cross)
MACD line crosses below signal line
RSI is between 30 and 55
Risk Management:
Configurable Take Profit and Stop Loss percentages via inputs.
Default: 3% TP, 1.5% SL (adjustable based on timeframe and asset volatility).
Best For:
Intraday trades on 1H (BTC, ETH, SOL)
Swing trades on 4H
Position entries on 1D (top 50 altcoins)
This script includes visual Buy/Sell signals, alert conditions, and customizable SL/TP logic — making it a clean, actionable, and reliable strategy for crypto traders.
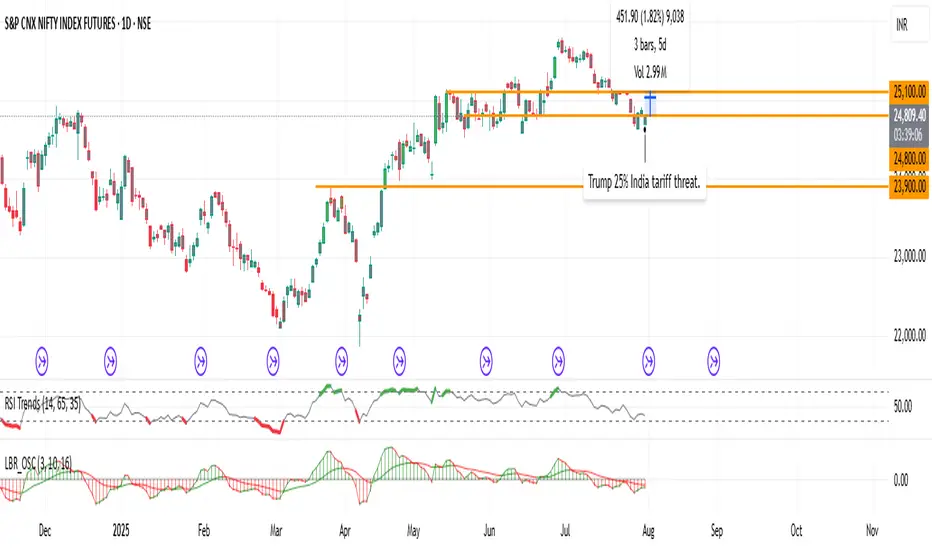
RSI TrendsColor chart with RSI colors
Simple RSI which colors green candle when RSI above 65, red when below 35 and grey when in between.
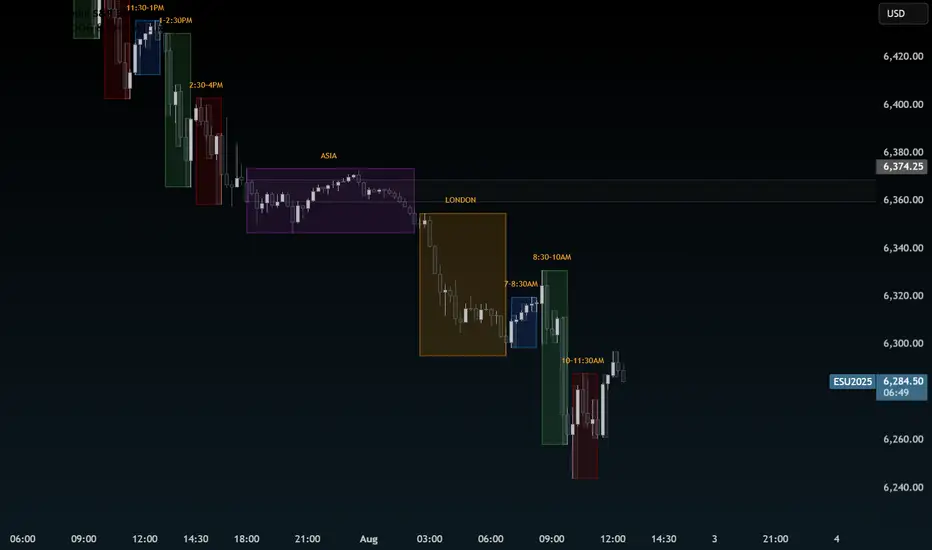
Time CyclesUses Zeussy's time and price cycles. This shows the Asia and London sessions, and has the PM session broken into 90 minute cycles with the option of toggling 30m cycles within them.
20 EMA / 55 EMA Cross with 50 SMMA FilterBulish Bearish indicator for the 55 ema flipping abover or below 20 ema and abover or below 50 smma
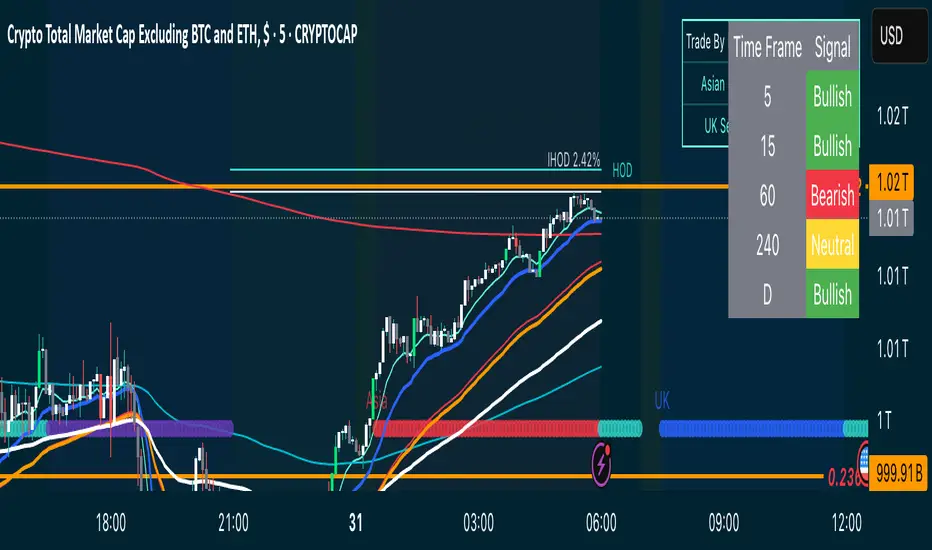
TSD Quantum | mrmoeinudinThis indicator, **TSD Quantum**, has been developed by **Moeinudin Montazerfaraj**, exclusively for the students of the **TSD Intraday Trading Course**.
TSD Quantum is an intelligent and proprietary tool designed to accurately identify **valid supply and demand zones** and distinguish them from weak or linear bases. The algorithm is fully customized to align with the advanced concepts taught in the TSD methodology, empowering traders to make more confident and data-driven decisions.
### Key Features:
- Smart zone detection tailored to TSD methodology
- Floating risk management panel
- Integrated checklist for trade validation
- Real-time display of ATR, spread, and other essential metrics
- Optimized for intraday traders who follow price action and zone-based decision making strategies.
To join our exclusive educational programs, visit our official website:
🌐 (mrmoeinudin.com)
Stay connected and follow us for insights, updates, and free educational content:
📌 Telegram: (t.me)
📌 YouTube:
📌 Instagram:
Wishing all Persian-speaking traders around the world continued success and growth in their trading journey. 🚀📈
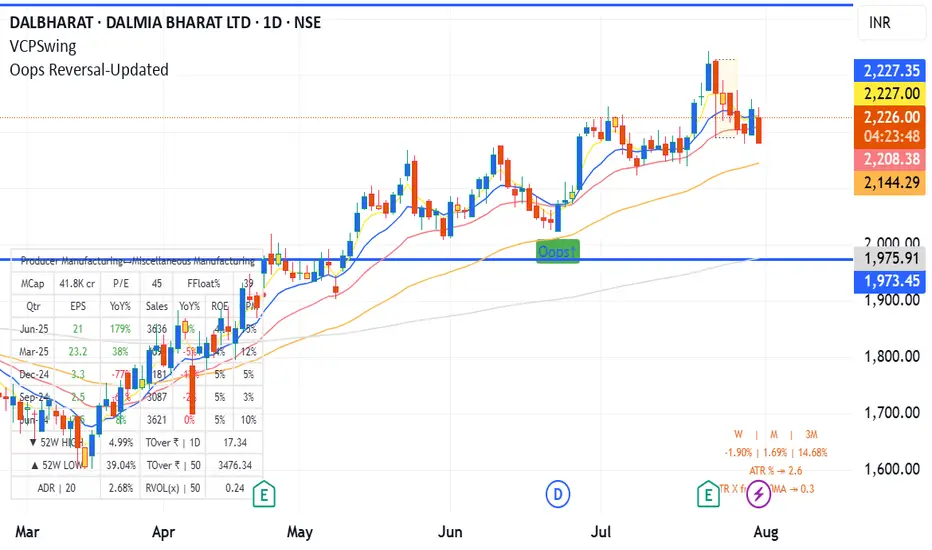
Oops Reversal-Updatedoops reversal - manas arora updated to cover only if it closes above previous day high
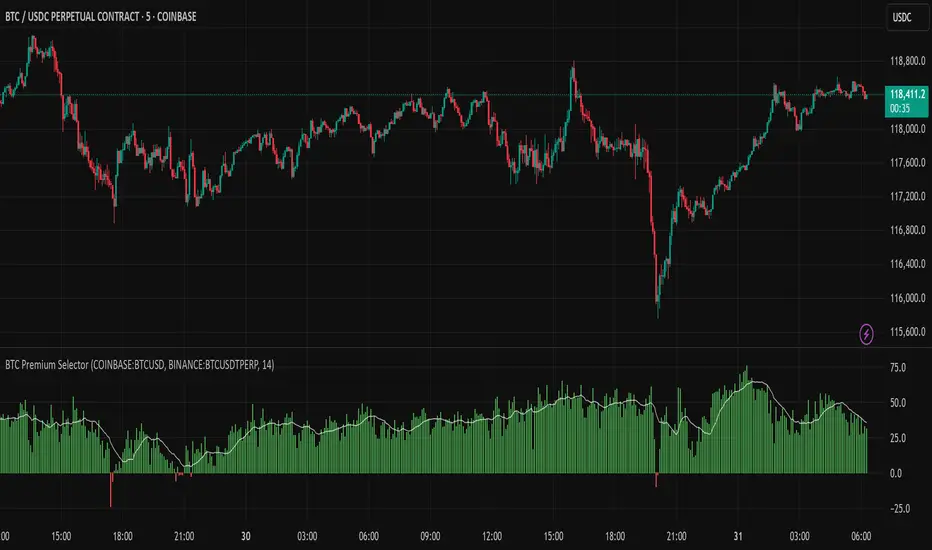
Multi CEX BTC Spot vs Perpetual PremiumThis Indicator shows the BTC Spot vs Perpetual premium across different CEX.
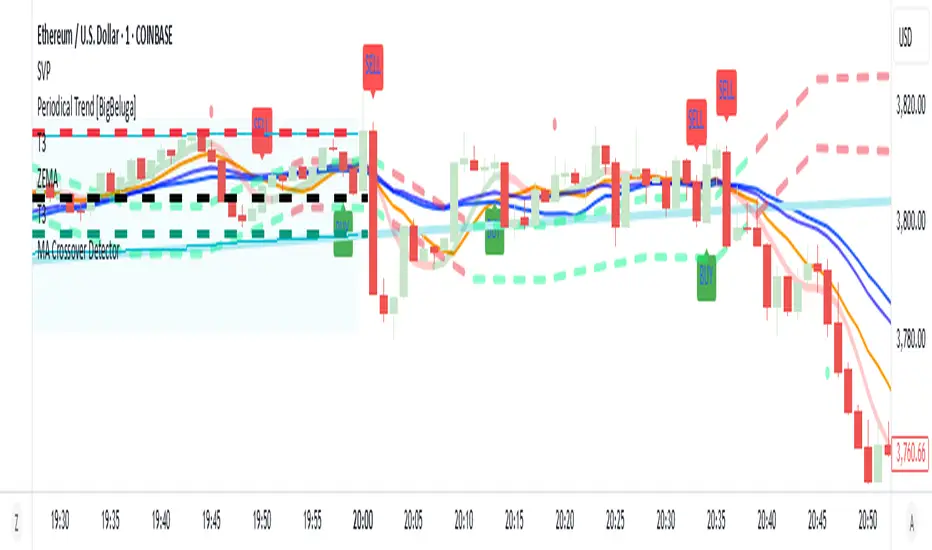
MA Crossover Detector
The Moving Average Crossover Detector is a custom indicator that visually shows buy and sell signals clearly on the chart. based on the crossing of two moving averages — a popular and beginner-friendly tool in technical analysis.
It plots two moving averages — One fast (short period) and one slow (long period) — and highlights crossover points:
✅ Buy Signal (Golden Cross) – When the fast MA crosses above the slow MA.
❌ Sell Signal (Death Cross) – When the fast MA crosses below the slow MA.
✅ Features
Visual: Clearly shows crossovers on the chart.
Customizable: Choose periods, types, styles, etc.
Alert-ready: You can set alerts for crossovers.
The Moving Average (MA) Crossover Strategy is one of the simplest and most widely used strategies in technical analysis for trading stocks, forex, crypto, and other markets. It relies on the interaction between two moving averages to generate buy and sell signals.
Core Components
Short-Term Moving Average (Fast MA) : Reacts quickly to price changes (e.g., 9-period or 20-period).
Long-Term Moving Average (Slow MA) : Reacts more slowly to price changes (e.g., 21-period or 200-period).
How the Strategy Works
Bullish Crossover (Golden Cross):
Occurs when the fast MA crosses above the slow MA. Interpreted as a buy signal, indicating a potential uptrend.
Bearish Crossover (Death Cross):
Occurs when the fast MA crosses below the slow MA. Interpreted as a sell signal, indicating a potential downtrend.
Common Variants
Short-term trading
9 EMA
21 EMA
Swing trading
20 SMA
50 SMA
Long-term investing
50 SMA
200 SMA
Pros
Easy to understand and implement
Works well in trending markets
Can be automated for backtesting and execution
Cons
Lagging indicator: MAs are based on past prices, so signals come after the move has started.
Choppy markets = whipsaws: Generates false signals in sideways/range-bound conditions.
May underperform in volatile or mean-reverting environments
Tips for Improvement
Use confirmation tools : e.g., RSI, MACD, volume analysis, price action
Add filters : Trend filter (ADX), volatility filter (ATR), or time filter (session-based)
Combine with price structure : Support/resistance, breakouts, pullbacks
MACD + EMA Zone Filter (with EMAs)How it works:
It plots 4 EMAs (Exponential Moving Averages):
EMA 20 (orange)
EMA 50 (yellow)
EMA 100 (blue)
EMA 200 (red)
A Buy signal is triggered when:
All three EMAs (20, 50, 100) are above EMA 200 (indicating an uptrend)
The MACD line crosses above the Signal line (bullish momentum)
A Sell signal is triggered when:
All three EMAs (20, 50, 100) are below EMA 200 (indicating a downtrend)
The MACD line crosses below the Signal line (bearish momentum)
📊 Visual Features:
Buy/Sell arrows directly on the chart
Background turns green in strong uptrends and red in strong downtrends
Built-in alerts for automation or notifications
🕒 Works on any timeframe, using the current chart's data.
use with fractals indicator for SL, aim for 1:2 RR

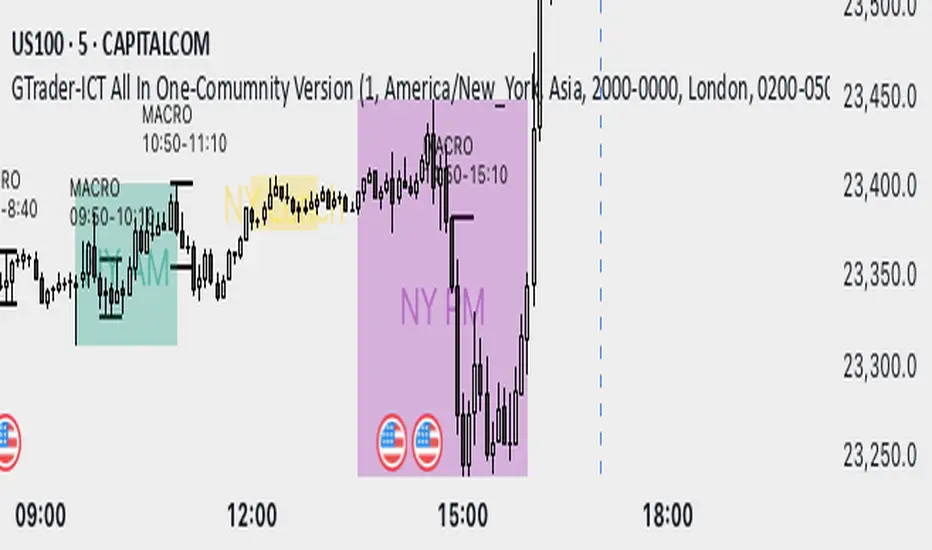
GTrader-ICT All In One-Comumnity VersionMeet the **GTrader-ICT All In One **, a comprehensive toolkit designed to integrate key Inner Circle Trader (ICT) concepts directly onto your chart. This powerful overlay indicator consolidates multiple essential tools, streamlining your technical analysis and helping you identify key temporal and price-based events.
📚 References & Inspiration
This indicator stands on the shoulders of giants. With the help of **tradeforopp** and **LuxAlgo**. The concepts and some implementation details were referenced from the following excellent, publicly available scripts:
ICT Killzones: The session drawing and pivot logic is adapted from tradeforopp
ICT Macros: The macro detection and plotting functionality is inspired by the work of Lux Algo , particularly their widely-used indicators covering ICT concepts.
🎯 Core Features
* **ICT Killzones:** Visualize critical trading sessions with customizable boxes. You can easily toggle and style the **Asia**, **London**, and **New York (AM, Lunch, PM)** sessions to focus on the liquidity and volatility that matter most to your strategy.
* Fully customizable session times and colors.
* Timezone support to align sessions with your local or preferred trading time (defaults to `America/New_York`).
* **ICT Macros:** Automatically identify and plot specific, short-duration time windows where institutional algorithms are known to be active (e.g., `09:50-10:10`, `14:50-15:10`, etc.).
* Plots the high/low range of the macro, providing clear levels of interest.
* Utilizes 1-minute data for precision, even when viewing on 3-minute or 5-minute charts.
📚 Optimization over the other original indicators
We add the custom input for macros session, users just need to input the from/to hour: minute format, and they will be converted into session objects in pinescript
The macro draws function is optimized, removing redundant draws, leading to better performance
Add "Distance from Macro Line to Chart" option
Add "Session Drawings Limit" for better performance
⚠️ Notes on TradingView Warnings
You may encounter some warnings from TradingView when using this script. These are generally expected due to the script's advanced, event-driven nature:
1. **Function Call Consistency:** The function 'box.new' should be called on each calculation for consistency, which may appear. This happens because drawing elements (like session boxes) are intentionally created only on the *first bar* of a new session, not on every single bar. This is a necessary design choice for performance and to prevent duplicate drawings.
2. **Potential for Repainting/Slow Load:** The **Macro** feature uses the `request.security_lower_tf()` function to get accurate 1-minute data. This can trigger warnings about performance or slow loading times. This is a known trade-off for achieving the precision required for the feature.