Strategy: Range BreakoutWhat?
In the price action, levels have a significant role to play. Based on the price moving above/below the levels - the underlying instrument shows some price-action in the direction of breakout/breakdown.
There are plenty of ways level can be determined. Levels are the decision point to take a trade or not. But if we make the level derivation complex, then the execution may get hamper.
This strategy script, developed in PineScript v5, is our attempt at solving this problem at the core by providing this simple, yet elegant solution to this problem.
It's essentially an attempt to Trade Simple by drawing logical (horizontal) lines in the chart and take actions, after multiple associated parameters confirmation, on the breakout / breakdown of the levels.
How?
Let us explain how we are drawing the levels.
We are depending on some of the parameters as described below:
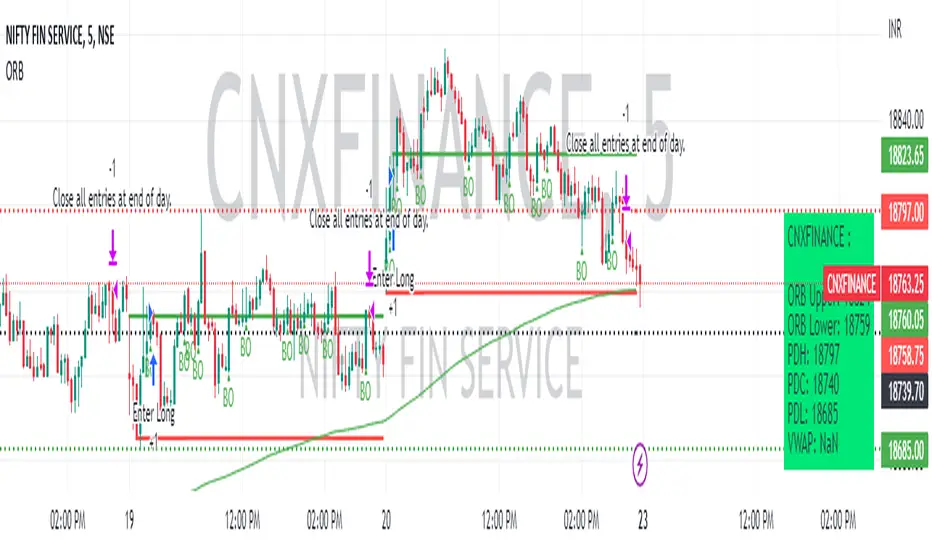
Open Range : During intraday movement, often if prices move beyond a particular level, it exibits more movement in the same swing in same direction. We found out, through our back testing for Indian Indices like NSE:NIFTY , NSE:BANKNIFTY or NSE:CNXFINANCE the first 15m (i.e 09:15 AM to 09:30 AM, IST) is one of such range. For Indian stocks, it is 9:15 to 9:45. And for MCX MCX:CRUDEOIL1! it's 5:00 pm to 6:00 pm. There are our first levels.
PDHCL : Previous Day High, Close, Low. This is our next level
VWAP : The rolling VWAP (volume weighted average price)
In the breakout/breakdown of the Open Range and Previous Day High/Low, we are taking the trade decisions as follows using CEST principle:
C onditions :
If current bar's (say you are in 5m timeframe) closing is broken out the Open Range High or Previous Day High, taken a Buy/Long decision (let's say buying a Call Option CE or selling a Put Option PE or buying the future or cash).
If current bar's (say you are in 5m timeframe) closing is broken down the Open Range Low or Previous Day Low, taken a Sell/Short decision (let's say buying a Put Option CE or selling a Call Option PE or selling the future or cash).
Additionally, and optionally (default ON, one can turn off): we are checking various other associated multiple confirmations as follows:
1. Momentum : Checking 14-period RSI value is more than 50 or less than 50 (all parameters like period, OB, OS ranges are configurable through settings)
2. Current bar's volume is more than the last 20 bars volume average. How much more - that multiplier is also configurable. (default is 1)
3. The breakout candle is bullish (green) or bearish (red).
E ntry :
All of these happens only on the closing of the candle . Means: Non Repainting! .
Clearly in the chart we are showing as green up arrow BO (breakout for buy) and red down arrow BD (breakdown for sell) to take your decision process smooth.
So, on the closing of the decision BO/BD candle we are entering the trade (with a thumping heart and nail biting ...)
S top Loss :
We are relying on the time tasted (last 40 years) mechanism of Average True Range (ATR) of default 14 period. This default period is also configurable.
So for Long trades: the 14 period ATR low band is the SL.
For Short trades: the 14 period ATR high band is the SL.
T arget :
We are depending on the thump rule of 1:2 Risk Reward. It's simple and effective. No fancy thing. We are closing the trade on double the favorable price movement compared to the SL placed. Of course, this RR ratio is confiurable from the settings, as usual.
What's Unqiue in it?
The utter simplicity of this trading mechanism. No fancy things like complex chart pattern, OI data, multiple candlestick patterns, Order flow analysis etc.
Simple level determination,
Marking clearly in the chart.
Making each parameter configurable in Settings and showing tooltip adjacent to the parameter to make you understand it better for your customization,
Wait for the candle close, thus eliminating the chances of repainting menace (as much as possible)
Additional momentum and volume check to trade entry confirmation.
Works with normal candlestick (nothing special ones like HA ...)
Showing everything as a Summary Table (which, again can be turned off optionally) overlaying at the bottom-right corner of the chart,
Optionally the Summary Table can be configured to alert you back (say you get it notified in your email or SMS).
That way, a single, simple, effective trade setup will ease your journey as smooth sail as possible.
Mentions
There are plenty of friends from whom time to time we borrowed some of the ideas while working closely together over last one year.
From tradingview community, we took the spirit of @zzzcrypto123 awesome work done long back (in 2020) as the indicator "ORB - Opening Range Breakout". (We tried to reach him for his explicit consent, unable to catch hold of him).
Some other publicly available materials we have consulted to get the additional checks (like RSI, volume).
Lat word
Use it please and thank you for your constant patronage in following us in this awesome platform. Let's keep growing together.
Disclaimer :
This piece of software does not come up with any warrantee or any rights of not changing it over the future course of time.
We are not responsible for any trading/investment decision you are taking out of the outcome of this indicator.
Rangebreakout
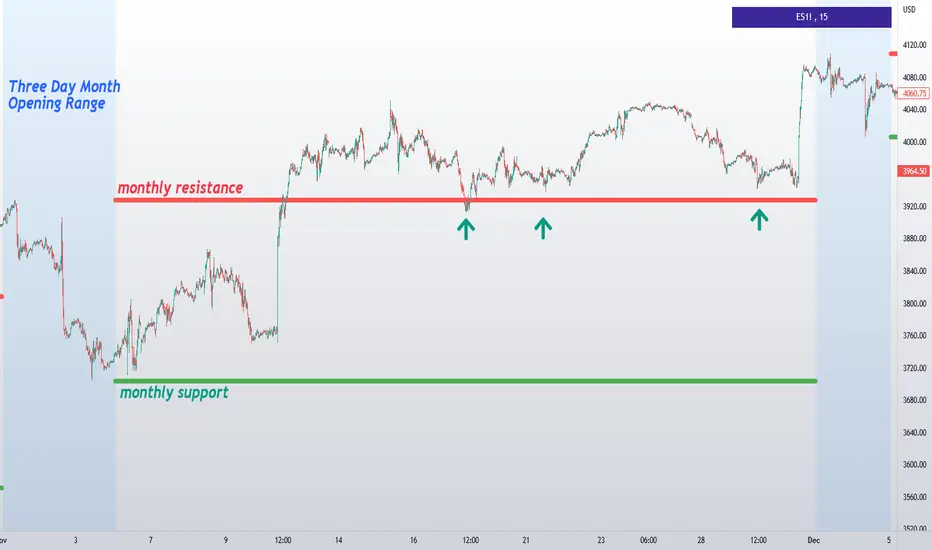
CAT Month Opening RangeA trading range which is formed during the first three trading day of any month sets an important "Month Opening Range".
The lowest price made during the first three trading days can be considered the Monthly Support level (see the green line drawn by the indicator).
The highest price made during the first three trading days can be considered the Monthly Resistance level (see the red line drawn by the indicator).
In an Up trending market price tends to break over the upper edge of the Month Opening Range and keep moving higher at the very least until the middle of that month.
In an Up trending market once price broke out of the Month Opening Range, the Monthly Resistance level tends to work as a support.
In a Down trending market price tends to break under the lower edge of the Month Opening Range and keep moving higher at the very least until the middle of that month.
In a Down trending market once price broke under the Month Opening Range, the Monthly Support level tends to work as a resistance
There are may ways to use that instrument:
(1) Trend Confirmation.
The first three days of a month tends to bring volatile trading. The market sets boundaries for the following four trading weeks.
Once the range has been set, swing traders may wait for the market to break out of the range and consider that direction of the prevailing trend direction.
(2) Short "Failed Breakout" setup
Quite often price breaks out of the Month Opening Range on the fourth or fifth trading day of a month but then drops back into the range.
That failed breakout quite often is followed by decline back down to the Month Support level (the lower edge of the Month Opening Range).
(3) Long "Failed Breakdown" setup
Quite often price breaks down under the Month Support on the fourth or fifth trading day of a month but then pops back up over the Monthly Support.
That failed breakdown quite often is followed by a rally targeting to retest the Monthly Resistance (the red line).
The indicator generates signals, trade set-ups and alerts that are for educational and hypothetical purposes only and shall not be considered trade recommendations.
Any signals or trading setups drawn by the indicator is not to be construed as an offer to sell or the solicitation of an offer to buy, nor is it to be construed as a recommendation to buy, hold or sell (short or otherwise) any security. All users of the indicator must determine for themselves what specific investments to make or not make and are urged to consult with their own independent financial advisors with respect to any investment decision.
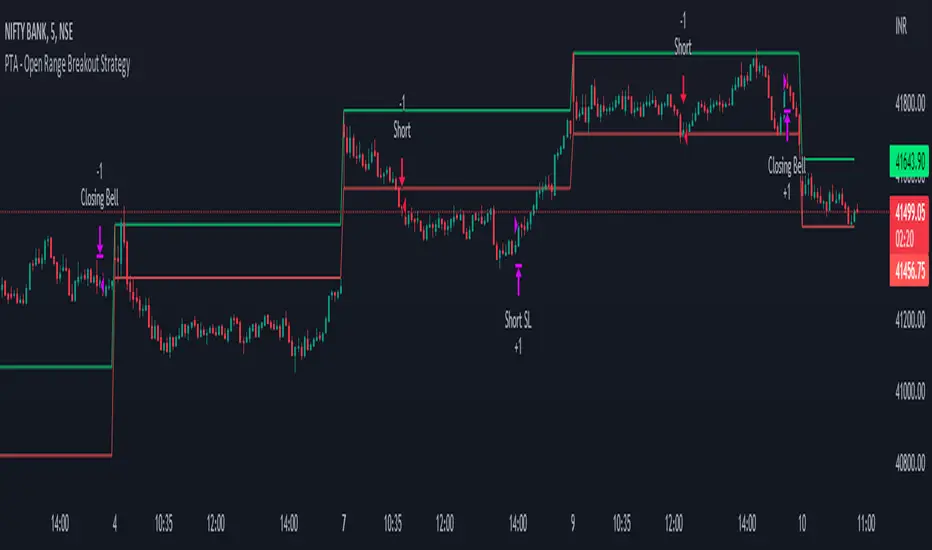
Pro Trading Art Open Range Breakout StrategyThis strategy is based on Selected Candle High Low Breakout with buffer point.
You can select specific candle from input tab by giving time of that candle.
Default Settings:
Start Hour : Hour of starting candle means from this input you can specify opening candle. Default is 9.
Start Minute: Minute of starting candle. Default is 15. Means Default opening candle is 9:15
Stop Hour : Means After this time no new trade will execute.
End Hour & End Minute & Close All Trade : Means when you specify End Hour and Minute and Close all trade is true then strategy will close all trade on specified time.
Buffer : With the help of this option you can add some point in High and low of Opening Candle
Trade Mode : You can specify Target and Stop Loss in point or Percent
Stop Loss Point or Percent : This will work according to Trade Mode
Target Point Or Percent : This will work according to Trade Mode
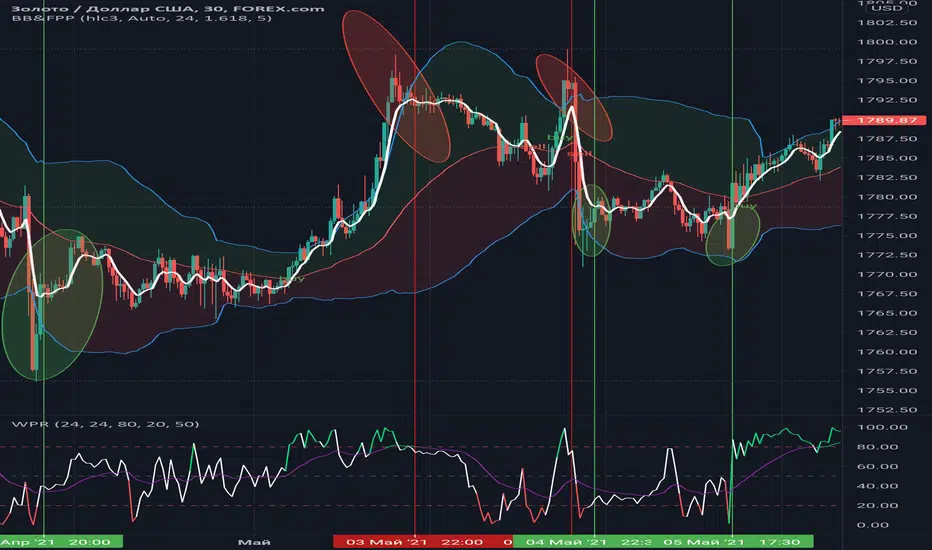
Williams %RHi! WPR is the Williams percentage range indicator in my design. The main idea is that the intersection of the indicator and the moving average in the overbought and oversold zones + color highlighting gives more clear visual signals for making trading decisions based on this indicator.
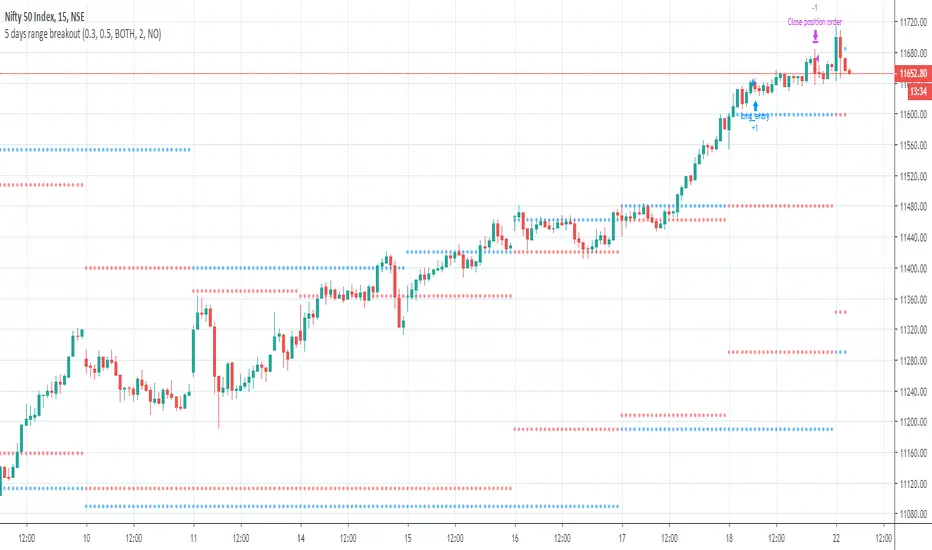
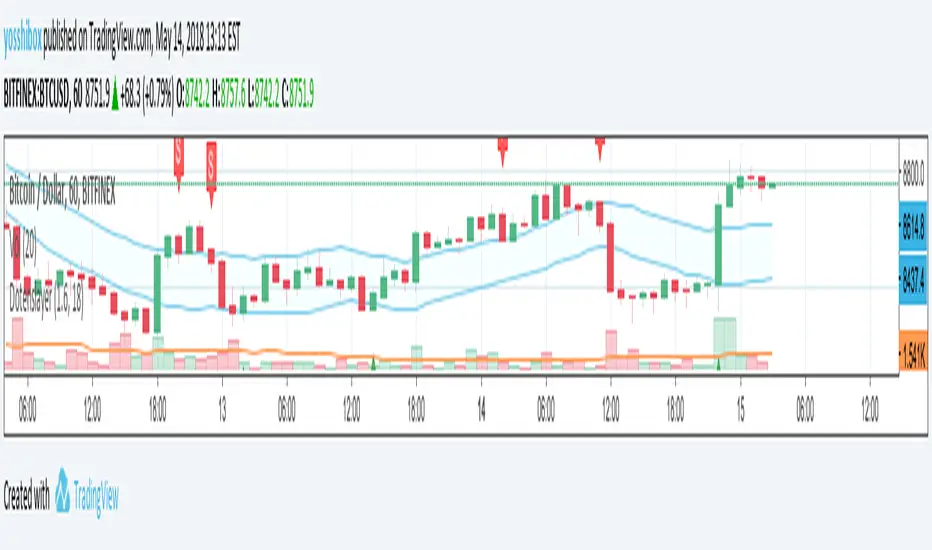
Dotenslayer : An open range breakouts method indicator for botThis script shows the long and short points of certain Japanese bots like 'DotenKun' which use open range breakouts method.
Searching recent 18 bars as default and shows the range calculated with a factor (default k = 1.6). You can edit this condition by yourself.
When filled the long or short conditions, also shows the indicator on the price chart to help your trading on BTC.
Also, this script can make alarm events related to those conditions.
This script only works for BTCUSD, XBTUSD, BTCJPY, FXBTCJPY with 1H time span.
Disclaimer :
I don't own the source code of the certain bots and I didn't directly reference the source code of it.
So which means, I don't guarantee this script works as same as the bots works.
Also, I didn't mean to disturb their trading bot businesses.
Your donations are welcome! :
BTC : 327MqYGfHJFC7LRijGwQZXdTAyFwvYCzyv
ETH : 0x5E270c3667E65ba6158D292a98c5b54F81AfCAf1