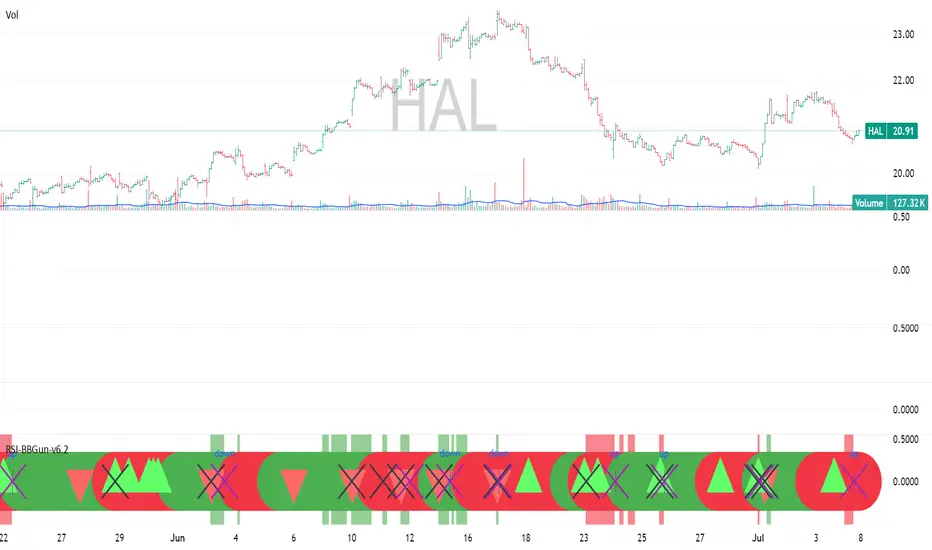
[Top] Unified Divergence DetectorThe Unified Divergence Detector (UDD) is a powerful tool designed to identify both regular and hidden divergences across multiple oscillators—RSI, CCI, and Stochastic—in a single unified indicator.
Unlike other divergence tools that focus on one source at a time, this script cross-checks multiple indicators simultaneously and consolidates the results into a single signal. Labels appear only when at least one divergence is detected, with optional color-coding to distinguish the number and type of divergences:
🐂 Bullish Divergence: Signals a potential reversal or continuation to the upside.
🐻 Bearish Divergence: Signals a potential reversal or continuation to the downside.
The script lets users configure:
Whether to detect regular, hidden, or both types of divergence.
Pivot lookback parameters and divergence detection range.
Separate label colors for 1, 2, or 3+ confirmations from different indicators.
Tooltips are dynamically generated and offer guidance on interpreting each signal based on the oscillator sources involved and the divergence type. Labels are intelligently placed to avoid clutter and display only the strongest, most relevant signals.
⸻
Potential Uses
Trend Reversals: Spot early signs of exhaustion and prepare for a trend change.
Trend Continuations: Confirm existing trends via hidden divergence signals.
Multi-Timeframe Confirmation: Combine this indicator with higher timeframe trend tools to validate entries or exits.
Custom Strategy Building: Integrate into more complex strategies involving price action or volume filters.
⸻
This indicator is ideal for traders who value confirmation from multiple sources and prefer clear, high-confidence signals over constant alerts. It works well across all timeframes and asset classes.
Relative Strength Index (RSI)
Iambuoyant High Win Rate TraderIambuoyant High Win Rate Trader (Debug Signals) - Indicator Description
Introduction
The "Iambuoyant High Win Rate Trader" is a comprehensive Pine Script indicator designed to identify high-probability trading opportunities across various market conditions. Built with a multi-faceted approach, it integrates several key technical analysis concepts to provide robust buy and sell signals, aiming to maximize potential returns while managing risk. This indicator is particularly useful for traders looking for confirmed entries based on a confluence of factors rather than relying on a single signal.
Strategies Used
This indicator employs a sophisticated combination of strategies, each contributing to a stronger signal when aligned:
Trend Analysis:
Multiple EMAs: It utilizes three Exponential Moving Averages (EMAs) – a fast, slow, and a longer-term trend EMA – to establish the prevailing market direction. Signals are filtered to align with this identified trend, enhancing their probability of success.
Trend Alignment: Confirms that price action is consistent with the established EMA trend, ensuring trades are taken in the direction of momentum.
Oscillator Confirmation:
Relative Strength Index (RSI): Employs RSI to identify overbought and oversold conditions, with a specific focus on the RSI turning away from extreme levels, suggesting a potential reversal or continuation point.
Stochastic Oscillator: Similar to RSI, the Stochastic Oscillator is used to pinpoint overbought and oversold zones, with additional confirmation from the %K and %D lines crossing or turning.
Momentum and Divergence (MACD):
Moving Average Convergence Divergence (MACD): The indicator analyzes MACD line and signal line crossovers, alongside histogram movement, to gauge momentum shifts and potential trade entries.
Volume Analysis:
Volume Confirmation: Integrates volume analysis by comparing current volume to a Volume Moving Average. Higher-than-average volume during a signal can confirm conviction behind the price move.
Market Structure and Volatility:
Support and Resistance (S/R) Levels: Dynamic support and resistance levels are identified using pivot points. These levels are used to inform potential stop-loss placements and to ensure trades aren't initiated directly into strong opposing S/R zones.
Average True Range (ATR): ATR is used to measure market volatility, which helps in adjusting trade sizing and stop-loss distances. A volatility filter is included to prevent trades in excessively choppy or illiquid conditions.
Risk Management:
Dynamic Stop Loss: The indicator attempts to identify logical stop-loss levels based on recent price action or nearby support/resistance.
Risk:Reward Ratio Filtering: A configurable minimum Risk:Reward ratio ensures that only trades with a favorable potential return relative to the risk are considered, promoting disciplined trading.
Signal Confirmation:
Confirmation Bars: An optional confirmBars input allows for signals to be confirmed over a specified number of bars, reducing false positives by waiting for price action to sustain the initial signal. (Note: For debugging, this is often set to 0 for immediate signals.)
How to Use the Indicator
Add to Chart: Apply the "Iambuoyant High Win Rate Trader (Debug Signals)" indicator to your desired chart in TradingView. It's an overlay indicator, meaning it will plot directly on your price chart.
Understand the Signals:
Buy Signals (Green Triangles/Labels): Appear below the price bars, indicating a potential long entry.
Sell Signals (Red Triangles/Labels): Appear above the price bars, indicating a potential short entry.
"Flash" Signals: Smaller, colored triangles indicate the immediate bar where the signal conditions are first met.
"Confirmed" Signals: Larger, shaded triangles with labels indicate that the signal has passed the confirmBars criteria (if confirmBars is set to greater than 0).
Utilize Debugging Features (Crucial for Optimization):
Access Inputs: Open the indicator's settings by clicking the gear icon next to its name on the chart.
"Signal Components (Debugging)" Section: This is the most powerful feature for tailoring the indicator to your needs.
Initial Setup: When first applying the indicator or if signals are too rare, start by setting most "Enable X Condition" toggles to false, potentially leaving only one or two simple conditions (e.g., "Enable RSI Condition" or "Enable Trend Alignment") as true. This will force signals to appear, allowing you to confirm the plotting mechanism works.
Gradual Re-enabling: Once you see signals, gradually re-enable one "Enable X Condition" at a time.
Observe Debug Plots (Lower Pane): Below your main chart, the indicator plots colored columns (e.g., "Debug: RSI Bull", "Debug: MACD Bear"). These show when each individual component of the long/short signal is true (1 or 2) or false (0 or na). The "Debug: Final Long Signal" and "Debug: Final Short Signal" plots show when the combined signal conditions are met.
Identify Bottlenecks: If signals disappear after enabling a new condition, observe its corresponding debug plot. If it's frequently 0 when other conditions are 1, you've found a bottleneck.
Adjust Parameters: For bottlenecks, go back to the relevant input section (e.g., "Oscillators," "Market Structure," "Signal Quality") and adjust parameters (e.g., rsiOB/rsiOS, stochOB/stochOS, volatilityFilter, minRRRatio) to be less strict until signals appear at your desired frequency. Alternatively, you may decide to leave that specific condition disabled if it's too restrictive for your strategy.
Configure Display Options: Use the "Display" group in the inputs to toggle the visibility of labels, support/resistance lines, and EMA trend lines on your chart.
Set Up Alerts: The indicator includes built-in alert conditions for "Confirmed Buy Signal" and "Confirmed Sell Signal." You can set up alerts in TradingView to be notified instantly when these signals occur, allowing you to monitor the market without constant chart watching.
Momentum-Reversal System Signals Pro
Momentum-Reversal System Signals Pro
Overview
A sophisticated signaling system designed to identify high-probability trend-following entries after a price pullback. This indicator is optimized for index futures like the S&P 500 (ES/SPX) on a 5-minute timeframe .
It performs best during periods of established trends and lower volatility. To aid in this, the indicator includes a customizable "No-Trade Zone" highlighter, which is pre-set to the often volatile 8:30 AM - 11:30 AM EST market open. While the default settings are robust and effective in most conditions, the indicator is fully customizable to suit your specific trading style.
How It Works
The core logic is based on a three-step process to filter for high-quality setups:
Trend Confirmation: The script first establishes the overall market direction using an EMA on a higher timeframe (15-minute by default). This ensures you are only looking for trades that align with the dominant trend.
Pullback Detection: Once the trend is confirmed, the script waits for the price to pull back to a dynamic area of value on the main chart (5-minute by default). This "pullback zone" is defined by the 5m EMA and an ATR-based channel around it, which adapts to current market volatility.
Momentum Entry: After a valid pullback occurs, the script waits for a clear sign that momentum is returning in the direction of the primary trend. This is confirmed by a combination of a MACD crossover and a strong RSI reading, signaling that the pullback has likely ended and the trend is ready to resume.
Advanced Quality Filters
What makes this indicator powerful is its multi-layered filtering system designed to weed out low-probability signals and avoid choppy market conditions.
Trend Strength: It doesn't just check the trend direction; it measures the slope of the 15m EMA to ensure the trend has sufficient strength. This is a key filter for avoiding flat, sideways markets.
Momentum Confirmation: An RSI "Dead Zone" around the 50-level ensures that the RSI shows decisive momentum before a signal is generated.
Signal Cooldown: A built-in timer ( Min Bars Between Signals ) prevents the same signal from firing repeatedly in a short period, reducing noise and over-trading.
RSI Volatility: The script checks that the RSI itself is not flat, which is often a sign of market indecision and a precursor to chop.
Pullback Quality: An optional filter ensures that by the time the signal fires, the price has already moved back to the "correct" side of the 5m EMA, confirming the reversal's strength.
Volatility Filter: A crucial risk management filter that blocks signals on abnormally large, high-risk "gasoline" bars that could lead to immediate stops.
How To Use
For Long Signals (Green 'Long' Tag):
Look for the 15m EMA to be green and trending upwards.
Wait for price to pull back towards the orange 5m EMA.
A "Long" signal appears when momentum indicators confirm a reversal back in the direction of the trend.
For Short Signals (Red 'Short' Tag):
Look for the 15m EMA to be red and trending downwards.
Wait for price to pull back towards the orange 5m EMA.
A "Short" signal appears when momentum indicators confirm a reversal back in the direction of the trend.
This tool provides high-probability signals, not guarantees. It is designed to be a core component of a complete trading plan. Always use proper risk management and confluence from your own analysis.
Fine-Tuning & Customization
All settings are fully adjustable in the script's "Inputs" tab to match your risk tolerance and market conditions.
Timeframe & EMA Settings: Adjust the core moving averages that define the trend and pullback zones.
Pullback Settings: Define what constitutes a valid pullback by adjusting the lookback period and the size of the ATR-based "near" zone.
Quality Filters: This is the most important section for tailoring the script's strictness. Increase the EMA Slope, RSI Dead Zone, or Signal Cooldown to receive fewer but potentially higher-quality signals.
Advanced Filters: Enable or disable the Pullback Quality and Volatility filters for an extra layer of confirmation or risk management.
No-Trade Zone Highlighter: Adjust the session and timezone to highlight periods you wish to avoid, such as news events or low-liquidity hours.
Happy trading, and please use this tool responsibly.
LBB + RSI Multi-Level + Compact TableBB and RSI scalping script for daily or scalp zone with signals
EMA Curl Strength+EMA Curl Strength+
Description:
This indicator provides a statistically normalized view of EMA slope momentum using Z-score transformation. By evaluating the rate of change of an EMA and comparing it against its historical behavior, the script highlights momentum shifts in a dynamic, adaptive way.
⸻
How It Works:
• Calculates the slope (percentage change) of a chosen EMA.
• Normalizes the slope using Z-score over a custom lookback period.
• Smooths the resulting signal and computes two signal lines for comparison.
• Assigns dynamic colors based on user-defined Z-score thresholds for mild, moderate, and strong momentum in both directions.
⸻
Visual Features:
• Gradient fill between the Z Curl Line and Signal 1 to highlight slope acceleration.
• Histogram showing the difference between the Z Curl Line and its signal.
• Optional signal crossover shapes between configurable pairs (e.g., Z Curl vs. Signal).
• Background highlights when the Z Curl Line exceeds ±2, indicating strong trending behavior.
⸻
Customization:
• Adjustable EMA length, smoothing lengths, signal lengths, histogram smoothing, and Z-score lookback.
• Separate color controls for:
• Z-score strength bands (mild/moderate/strong up/down)
• Histogram bars
• Signal lines
• Background highlight zones
• Crossover shapes
⸻
Use Cases:
• Momentum Confirmation: Confirm strength when Z Curl exceeds ±2 with matching background highlights.
• Trend Entry Timing: Look for trades when Z Curl crosses above or below the 0-line.
• Scalping: Capture quick directional moves when momentum accelerates.
• Trend Following: Use strong Z Curl values to confirm trade direction and filter sideways action.
• Divergence Detection: Spot divergences between price and Z Curl movement to anticipate reversals.

RSI with 2-Pole FilterA momentum indicator that tells you if a stock is overbought or oversold.
RSI goes between 0 and 100.
70 = overbought (might fall)
<30 = oversold (might rise)
It often looks jagged or choppy on volatile days.
Think of this filter like a momentum smoother:
It still follows RSI closely,
But it doesn’t react to every little jiggle in price,
Which helps avoid false signals.
it keeps track of:
The current RSI,
The last 2 RSI values (inputs), and
The last 2 outputs (filtered RSIs).
It uses feedback to shape the output based on previous values, making it smoother than a simple moving average.

TeeLek-BestPositionThis indicator is used to indicate the best buying and selling points.
This indicator will calculate the best buying points (blue) and selling points (orange). The working principle is that the blue point is the point where the RSI is Over Sold, the orange point is the point where the RSI is Over Bought. After that, we will use the Highest Line 100 and Lowest Line 100 to filter the points another layer. And because when Over Bought/Over Sold occurs, there will be continuous signals that are repeated, causing confusion. Therefore, there is a feature to leave a time frame. Set the default value to 24 hours. If a signal occurs, it will be left out.
The appropriate point for buying is:
The point where Over Sold occurs and Closes lower than the Lowest Line 100.
Leave a time frame for 24 hours before a new signal occurs.
The appropriate point for selling is:
The point where Over Bought occurs and Closes higher than the Highest Line 100.
Leave a time frame for 24 hours before a new signal occurs.
It helps us to gradually buy and collect/sell for profit easily without confusion.
อินดิเคเตอร์นี้ใช้ สำหรับบอกจุดซื้อจุดขายที่ดีที่สุด
อินดิเคเตอร์นี้ จะคำนวณจุดซื้อ (สีฟ้า) และจุดขาย (สีส้ม) ที่ดีที่สุดมาให้ โดยหลักการทำงาน คือ จุดสีฟ้า คือจุดที่ RSI Over Sold จุดสีส้ม คือจุดที่ RSI Over Bought หลังจากนั้นเราจะใช้เส้น Highest Line 100 และ Lowest Line 100 เพื่อกรองจุดอีกชั้นหนึ่ง และเนื่องจากเมื่อเกิด Over Bought/Over Sold แล้ว มันจะเกิดสัญญาณต่อเนื่องซ้ำๆ ทำให้สับสน จึงได้มีฟีเจอร์ในการเว้นระยะเวลา ตั้งค่าไว้เริ่มต้นที่ 24 ชั่วโมง ถ้าเกิดสัญญาณแล้วก็จะเว้นระยะออกไป
จุดที่เหมาะสมกับการซื้อ คือ
จุดที่เกิด Over Sold และ Close ต่ำกว่าเส้น Lowest Line 100
เว้นระยะไป 24 ชั่วโมงจึงจะเกิดสัญญาณใหม่อีกครั้ง
จุดที่เหมาะสมกับการขาย คือ
จุดที่เกิด Over Bought และ Close สูงกว่าเส้น Highest Line 100
เว้นระยะไป 24 ชั่วโมงจึงจะเกิดสัญญาณใหม่อีกครั้ง
ช่วยให้เราสามารถ ทยอยซื้อเก็บสะสม/ทยอยขายทำกำไร ได้ง่ายไม่สับสน

MACD + RSI + SMA Strategy with TP/SLThis strategy combines three technical indicators: MACD, RSI, and Simple Moving Average (SMA) to identify high-probability entry points. It enters trades in the direction of the trend (filtered by SMA), confirms momentum shifts (via MACD crossover), and validates signals with RSI to avoid overbought/oversold conditions.
Key Features:
Directional filter using SMA to align trades with the broader trend.
Momentum validation with MACD crossovers.
Risk control through RSI thresholds and fixed percentage-based Take Profit and Stop Loss levels.
Works for both long and short positions.
Disclaimer: This is a sample strategy for educational purposes only.
Trading involves risk. Use at your own discretion.
You bear full responsibility for any profit or loss.

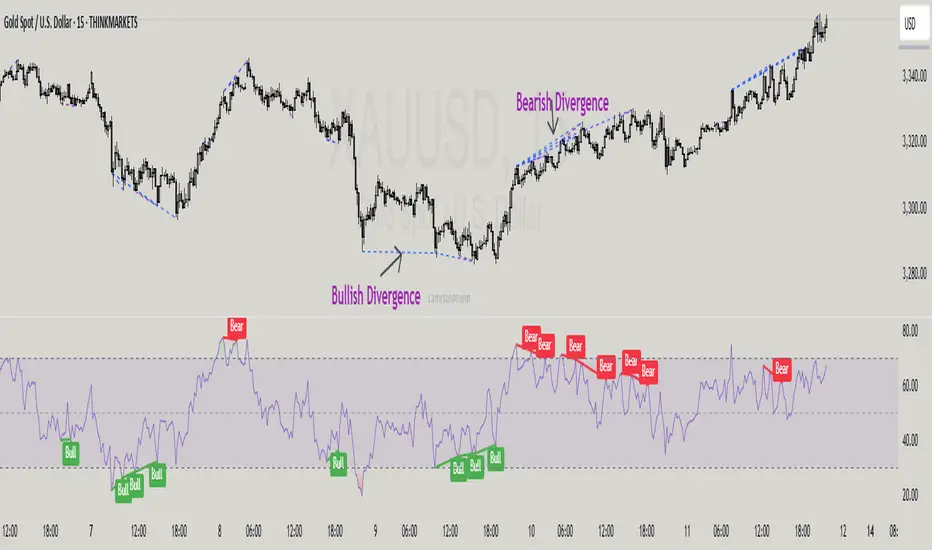
RSI Mansfield +RSI Mansfield+ – Adaptive Relative Strength Indicator with Divergences
Overview
RSI Mansfield+ is an advanced relative strength indicator that compares your instrument’s performance against a configurable benchmark index or asset (e.g., Bitcoin Dominance, S&P 500). It combines Mansfield normalization, adaptive smoothing techniques, and automatic detection of bullish and bearish divergences (regular and hidden), delivering a comprehensive tool for assessing relative strength across any market and timeframe.
Originality and Motivation
Unlike traditional relative strength scripts, this indicator introduces several distinctive improvements:
Mansfield Normalization: Scales the ratio between the asset and the benchmark relative to its moving average, transforming it into a normalized oscillator that fluctuates around zero, making it easier to spot outperformance or underperformance.
Adaptive Smoothing: Automatically selects whether to use EMA or SMA based on the market type (crypto or stocks) and timeframe (intraday, daily, weekly, monthly), avoiding manual configuration and providing more robust results under varying volatility conditions.
Divergence Detection: Identifies four types of divergences in the Mansfield oscillator to help anticipate potential reversal points or trend confirmations.
Multi-Market Support: Offers benchmark selection among major crypto and global stock indices from a single input.
These enhancements make RSI Mansfield+ more practical and powerful than conventional relative strength scripts with static benchmarks or without divergence capabilities.
Core Concepts
Relative Strength (RS): Compares price evolution between your asset and the selected benchmark.
Mansfield Normalization: Measures how much the RS deviates from its historical moving average, expressed as a scaled oscillator.
Divergences: Detects regular and hidden bullish or bearish divergences within the Mansfield oscillator.
Timeframe Adaptation: Dynamically adjusts moving average lengths based on timeframe and market type.
How It Works
Benchmark Selection
Choose among over 10 indices or market domains (BTC Dominance, ETH Dominance, S&P 500, European indices, etc.).
Ratio Calculation
Computes the price-to-benchmark ratio and smooths it with the adaptive moving average.
Normalization and Scaling
Transforms deviations into a Mansfield oscillator centered around zero.
Dynamic Coloring
Green indicates relative outperformance, red signals underperformance.
Divergence Detection
Automatically identifies bullish and bearish (regular and hidden) divergences by comparing oscillator pivots against price pivots.
Baseline Reference
A clear zero line helps interpret relative strength trends.
Usage Guidelines
Benchmark Comparison
Ideal for traders analyzing whether an asset is outperforming or lagging its sector or market.
Divergence Analysis
Helps detect potential reversal or continuation signals in relative strength.
Multi-Timeframe Compatibility
Can be applied to intraday, daily, weekly, or monthly charts.
Interpretation
Oscillator >0 and green: outperforming the benchmark.
Oscillator <0 and red: underperforming.
Bullish divergences: potential relative strength reversal to the upside.
Bearish divergences: possible loss of momentum or reversal to the downside.
Credits
The concept of Mansfield Relative Strength is based on Stan Weinstein’s original work on relative performance analysis. This script was built entirely from scratch in TradingView Pine Script v6, incorporating original logic for adaptive smoothing, normalized scaling, and divergence detection, without reusing any external open-source code.

Divergence Strategy [Trendoscope®]🎲 Overview
The Divergence Strategy is a sophisticated TradingView strategy that enhances the Divergence Screener by adding automated trade signal generation, risk management, and trade visualization. It leverages the screener’s robust divergence detection to identify bullish, bearish, regular, and hidden divergences, then executes trades with precise entry, stop-loss, and take-profit levels. Designed for traders seeking automated trading solutions, this strategy offers customizable trade parameters and visual feedback to optimize performance across various markets and timeframes.
For core divergence detection features, including oscillator options, trend detection methods, zigzag pivot analysis, and visualization, refer to the Divergence Screener documentation. This description focuses on the strategy-specific enhancements for automated trading and risk management.
🎲 Strategy Features
🎯Automated Trade Signal Generation
Trade Direction Control : Restrict trades to long-only or short-only to align with market bias or strategy goals, preventing conflicting orders.
Divergence Type Selection : Choose to trade regular divergences (bullish/bearish), hidden divergences, or both, targeting reversals or trend continuations.
Entry Type Options :
Cautious : Enters conservatively at pivot points and exits quickly to minimize risk exposure.
Confident : Enters aggressively at the latest price and holds longer to capture larger moves.
Mixed : Combines conservative entries with delayed exits for a balanced approach.
Market vs. Stop Orders: Opt for market orders for instant execution or stop orders for precise price entry.
🎯 Enhanced Risk Management
Risk/Reward Ratio : Define a risk-reward ratio (default: 2.0) to set profit targets relative to stop-loss levels, ensuring consistent trade sizing.
Bracket Orders : Trades include entry, stop-loss, and take-profit levels calculated from divergence pivot points, tailored to the entry type and risk-reward settings.
Stop-Loss Placement : Stops are strategically set (e.g., at recent pivot or last price point) based on entry type, balancing risk and trade validity.
Order Cancellation : Optionally cancel pending orders when a divergence is broken (e.g., price moves past the pivot in the wrong direction), reducing invalid trades. This feature is toggleable for flexibility.
🎯 Trade Visualization
Target and Stop Boxes : Displays take-profit (lime) and stop-loss (orange) levels as boxes on the price chart, extending 10 bars forward for clear visibility.
Dynamic Trade Updates : Trade visualizations are added, updated, or removed as trades are executed, canceled, or invalidated, ensuring accurate feedback.
Overlay Integration : Trade levels overlay the price chart, complementing the screener’s oscillator-based divergence lines and labels.
🎯 Strategy Default Configuration
Capital and Sizing : Set initial capital (default: $1,000,000) and position size (default: 20% of equity) for realistic backtesting.
Pyramiding : Allows up to 4 concurrent trades, enabling multiple divergence-based entries in trending markets.
Commission and Margin : Accounts for commission (default: 0.01%) and margin (100% for long/short) to reflect trading costs.
Performance Optimization : Processes up to 5,000 bars dynamically, balancing historical analysis and real-time execution.
🎲 Inputs and Configuration
🎯Trade Settings
Direction : Select Long or Short (default: Long).
Divergence : Trade Regular, Hidden, or Both divergence types (default: Both).
Entry/Exit Type : Choose Cautious, Confident, or Mixed (default: Cautious).
Risk/Reward : Set the risk-reward ratio for profit targets (default: 2.0).
Use Market Order : Enable market orders for immediate entry (default: false, uses limit orders).
Cancel On Break : Cancel pending orders when divergence is broken (default: true).
🎯Inherited Settings
The strategy inherits all inputs from the Divergence Screener, including:
Oscillator Settings : Oscillator type (e.g., RSI, CCI), length, and external oscillator option.
Trend Settings : Trend detection method (Zigzag, MA Difference, External), MA type, and length.
Zigzag Settings : Zigzag length (fixed repaint = true).
🎲 Entry/Exit Types for Divergence Scenarios
The Divergence Strategy offers three Entry/Exit Type options—Cautious, Confident, and Mixed—which determine how trades are entered and exited based on divergence pivot points. This section explains how these settings apply to different divergence scenarios, with placeholders for screenshots to illustrate each case.
The divergence pattern forms after 3 pivots. The stop and entry levels are formed on one of these levels based on Entry/Exit types.
🎯Bullish Divergence (Reversal)
A bullish divergence occurs when price forms a lower low, but the oscillator forms a higher low, signaling a potential upward reversal.
💎 Cautious:
Entry : At the pivot high point for a conservative entry.
Exit : Stop-loss at the last pivot point (previous low that is higher than the current pivot low); take-profit at risk-reward ratio. Canceled if price breaks below the pivot (if Cancel On Break is enabled).
Behavior : Enters after confirmation and exits quickly to limit downside risk.
💎Confident:
Entry : At the last pivot low, (previous low which is higher than the current pivot low) for an aggressive entry.
Exit : Stop-loss at recent pivot low, which is the lowest point; take-profit at risk-reward ratio. Canceled if price breaks below the pivot. (lazy exit)
Behavior : Enters early to capture trend continuation, holding longer for gains.
💎Mixed:
Entry : At the pivot high point (conservative).
Exit : Stop-loss at the recent pivot point that has resulted in lower low (lazy exit). Canceled if price breaks below the pivot.
Behavior : Balances entry caution with extended holding for trend continuation.
🎯Bearish Divergence (Reversal)
A bearish divergence occurs when price forms a higher high, but the oscillator forms a lower high, indicating a potential downward reversal.
💎Cautious:
Entry : At the pivot low point (lower high) for a conservative short entry.
Exit : Stop-loss at the previous pivot high point (previous high); take-profit at risk-reward ratio. Canceled if price breaks above the pivot (if Cancel On Break is enabled).
Behavior : Enters conservatively and exits quickly to minimize risk.
💎Confident:
Entry : At the last price point (previous high) for an aggressive short entry.
Exit : Stop-loss at the pivot point; take-profit at risk-reward ratio. Canceled if price breaks above the pivot.
Behavior : Enters early to maximize trend continuation, holding longer.
💎Mixed:
Entry : At the previous piot high point (conservative).
Exit : Stop-loss at the last price point (delayed exit). Canceled if price breaks above the pivot.
Behavior : Combines conservative entry with extended holding for downtrend gains.
🎯Bullish Hidden Divergence (Continuation)
A bullish hidden divergence occurs when price forms a higher low, but the oscillator forms a lower low, suggesting uptrend continuation. In case of Hidden bullish divergence, b]Entry is always on the previous pivot high (unless it is a market order)
💎Cautious:
Exit : Stop-loss at the recent pivot low point (higher than previous pivot low); take-profit at risk-reward ratio. Canceled if price breaks below the pivot (if Cancel On Break is enabled).
Behavior : Enters after confirmation and exits quickly to limit downside risk.
💎Confident:
Exit : Stop-loss at previous pivot low, which is the lowest point; take-profit at risk-reward ratio. Canceled if price breaks below the pivot. (lazy exit)
Behavior : Enters early to capture trend continuation, holding longer for gains.
🎯Bearish Hidden Divergence (Continuation)
A bearish hidden divergence occurs when price forms a lower high, but the oscillator forms a higher high, suggesting downtrend continuation. In case of Hidden Bearish divergence, b]Entry is always on the previous pivot low (unless it is a market order)
💎Cautious:
Exit : Stop-loss at the latest pivot high point (which is a lower high); take-profit at risk-reward ratio. Canceled if price breaks above the pivot (if Cancel On Break is enabled).
Behavior : Enters conservatively and exits quickly to minimize risk.
💎Confident/Mixed:
Exit : Stop-loss at the previous pivot high point; take-profit at risk-reward ratio. Canceled if price breaks above the pivot.
Behavior : Uses the late exit point to hold longer.
🎲 Usage Instructions
🎯Add to Chart:
Add the Divergence Strategy to your TradingView chart.
The oscillator and divergence signals appear in a separate pane, with trade levels (target/stop boxes) overlaid on the price chart.
🎯Configure Settings:
Adjust trade settings (direction, divergence type, entry type, risk-reward, market orders, cancel on break).
Modify inherited Divergence Screener settings (oscillator, trend method, zigzag length) as needed.
Enable/disable alerts for divergence notifications.
🎯Interpret Signals:
Long Trades: Triggered on bullish or bullish hidden divergences (if allowed), shown with green/lime lines and labels.
Short Trades: Triggered on bearish or bearish hidden divergences (if allowed), shown with red/orange lines and labels.
Monitor lime (target) and orange (stop) boxes for trade levels.
Review strategy performance metrics (e.g., profit/loss, win rate) in the strategy tester.
🎯Backtest and Optimize:
Use TradingView’s strategy tester to evaluate performance on historical data.
Fine-tune risk-reward, entry type, position sizing, and cancellation settings to suit your market and timeframe.
For questions, suggestions, or support, contact Trendoscope via TradingView or official support channels. Stay tuned for updates and enhancements to the Divergence Strategy!

Crowding model ║ BullVision🔬 Overview
The Crypto Crowding Model Pro is a sophisticated analytical tool designed to visualize and quantify market conditions across multiple cryptocurrencies. By leveraging Relative Strength Index (RSI) and Z-score calculations, this indicator provides traders with an intuitive and detailed snapshot of current crypto market dynamics, highlighting areas of extreme momentum, crowded trades, and potential reversal points.
⚙️ Key Concepts
📊 RSI and Z-Score Analysis
RSI (Relative Strength Index) evaluates the momentum and strength of each cryptocurrency, identifying overbought or oversold conditions.
Z-Score Normalization measures each asset's current price deviation relative to its historical average, identifying statistically significant extremes.
🎯 Crowding Analytics
An integrated analytics panel provides real-time crowding metrics, quantifying market sentiment into four distinct categories:
🔥 FOMO (Fear of Missing Out): High momentum, potential exhaustion.
❄️ Fear: Low momentum, potential reversal or consolidation.
📈 Recovery: Moderate upward momentum after a downward trend.
💪 Strength: Stable bullish conditions with sustained momentum.
🖥️ Visual Scatter Plot
Assets are plotted on a dynamic scatter plot, positioning each cryptocurrency according to its RSI and Z-score.
Color coding, symbol shapes, and sizes help quickly identify main market segments (BTC, ETH, TOTAL, OTHERS) and individual asset conditions.
🧩 Quadrant Classification
Assets are categorized into four quadrants based on their momentum and deviation:
Overbought Extended: High RSI and positive Z-score.
Recovery Phase: Low RSI but positive Z-score.
Oversold Compressed: Low RSI and negative Z-score.
Strong Consolidation: High RSI but negative Z-score.
🔧 User Customization
🎨 Visual Settings
Bar Scale: Adjust the scatter plot visual scale.
Asset Visibility: Optionally display key market benchmarks (TOTAL, BTC, ETH, OTHERS).
Gradient Background: Enhances visual interpretation of asset clusters.
Crowding Analytics Panel: Toggle the analytics panel on/off.
📊 Indicator Parameters
RSI Length: Defines the calculation period for RSI.
Z-score Lookback: Historical lookback period for normalization.
Crowding Alert Threshold: Sets alert sensitivity for crowded market conditions.
🎯 Zone Settings
Quadrant Labels: Displays descriptive labels for each quadrant.
Danger Zones: Highlights extreme RSI levels indicative of heightened market risk.
📈 Visual Output
Dynamic Scatter Plot: Visualizes asset positioning clearly and intuitively.
Gradient and Grid: Professional gridlines and subtle gradient backgrounds assist visual assessment.
Danger Zone Highlights: Visually indicates RSI extremes to warn of potential market turning points.
Crowding Analytics Panel: Real-time summary of market sentiment and asset distribution.
🔍 Use Cases
This indicator is particularly beneficial for traders and analysts looking to:
Identify crowded trades and potential reversal points.
Quickly assess overall market sentiment and individual asset strength.
Integrate a robust momentum analysis into broader technical or fundamental strategies.
Enhance market timing and improve risk management decisions.
⚠️ Important Notes
This indicator does not provide explicit buy or sell signals.
It is intended solely for informational, analytical, and educational purposes.
Past performance and signals are not indicative of future market results.
Always combine with additional tools and analysis as part of comprehensive decision-making.

Zero-Lag RSI DivergenceZero-Lag RSI Divergence
Overview
This indicator identifies RSI divergences in real-time without delay, providing immediate signals as price-momentum discrepancies develop. The indicator analyzes price action against RSI momentum across dual configurable periods, enabling traders to detect potential reversal opportunities with zero lag.
Key Features
Instant Divergence Detection : Identifies bullish and bearish divergences immediately upon formation without waiting for candle confirmation or historical validation. This eliminates signal delay but may increase false signals due to higher sensitivity.
Dual Period Analysis : Configure detection across two independent cycles - Short Period (default 15) and Long Period (default 50) - allowing for multi-timeframe divergence analysis and enhanced signal validation across different market conditions.
Visual Divergence Lines : Automatically draws dashed lines connecting divergence points between price highs/lows and corresponding RSI peaks/troughs, clearly illustrating the momentum-price relationship.
Customizable RSI Parameters : Adjustable RSI length (default 14) allows optimization for different market volatility and trading timeframes.
How It Works
The indicator continuously monitors price action patterns and RSI momentum:
- Bullish Divergence : Detected when price makes lower lows while RSI makes higher lows, suggesting potential upward momentum
- Bearish Divergence : Identified when price makes higher highs while RSI makes lower highs, indicating potential downward momentum
The algorithm uses candle color transitions and immediate RSI comparisons to trigger signals without historical repainting , ensuring backtesting accuracy and real-time reliability.
How To Read
Important Notes
Higher Signal Frequency : The zero-lag approach increases signal sensitivity, generating more frequent alerts that may include false signals. Consider using additional confirmation methods for trade entries.
Non-Repainting : All signals are generated and maintained without historical modification, ensuring consistent backtesting and forward-testing results.
Input Parameters
RSI Length: Period for RSI calculation (default: 14)
Short/Long Periods: Lookback periods for divergence detection (default: 15/50)
Line Colors: Customizable colors for short and long period divergence lines
Label Settings: Optional divergence labels with custom text
This indicator is designed for traders seeking immediate divergence identification across multiple timeframes while maintaining signal integrity and backtesting reliability.
RSI PotentialRSI Potential
This indicator does more than just track RSI; it measures the "energy" or "fuel" left in a trend. It answers a critical question: how much further can the price move before momentum is exhausted?
The key insight is that high momentum often means low potential, and vice versa. This inverse relationship is what allows the indicator to provide powerful, forward-looking signals about trend health and potential reversals.
Think of it like a race car:
Momentum is the car's current speed.
Potential is the amount of fuel left in the tank.
A car at top speed (high momentum) is burning fuel rapidly (potential is decreasing). A car just starting (low momentum) has a full tank of fuel (high potential). This indicator helps you see the fuel gauge, not just the speedometer.
This indicator plots three distinct components in a separate pane below your chart:
1. Upside Potential (Green Line)
What it shows: The percentage price increase required to hit the Overbought RSI Level. In other words, how much "fuel" is left for the upward trend.
How to interpret it:
Low Value (Approaching Zero): This is a warning sign. It means the price is already in high gear, and there is very little room left to run before hitting overbought exhaustion. Even if the price is rocketing up (high momentum), low potential signals the rally is likely on its last legs.
High Value: This indicates the market has a full tank of fuel for a rally. Even if the price is moving sideways or slowly (low momentum), the high potential suggests that if a new uptrend starts, it has the energy to be sustainable and significant.
2. Downside Potential (Red Line)
What it shows: The percentage price decrease required to hit the Oversold RSI Level—the "fuel" for a downtrend.
How to interpret it:
Low Value (Approaching Zero): A warning for bears. The price may be dropping fast (high momentum), but it's running out of energy to fall further. This signals seller exhaustion and increases the probability of a bounce or reversal.
High Value: The market has significant room to fall before becoming oversold. This can confirm the health of a new downtrend or suggest that a current downtrend has more to go.
3. Net Potential (Columns / Histogram)
What it shows: The net balance of energy: Upside Potential - Downside Potential. It answers, "Which side has more fuel in the tank?"

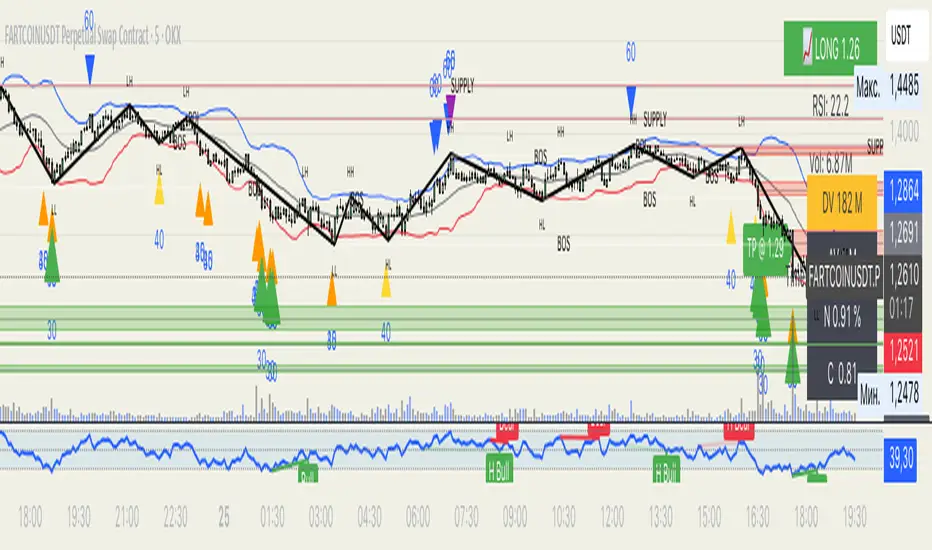
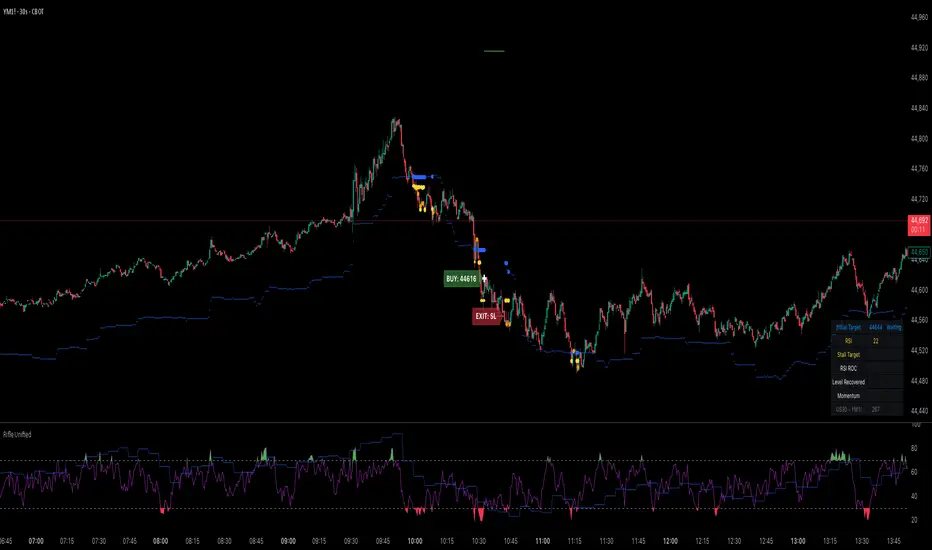
Rifle UnifiedThis script is designed for use on 30-second charts of Dow Jones-related symbols (YM, MYM, US30). It provides automated buy and sell signals using a combination of price action, RSI (Relative Strength Index), and volume analysis. The script is intended for both live trading signals and backtesting, with configurable risk management and debugging features.
Core Functionality
1. Signal Generation Logic
Trigger: The algorithm looks for a sharp price move (drop or rise) of a user-defined threshold (default: 80 points) within a specified lookback window (default: 20 minutes).
Levels: It monitors for price drops below specific numerical levels ending in 23, 43, or 73 (e.g., 42223, 42273).
RSI Condition: When price falls below one of these levels and the RSI is below 30, the setup is considered active.
Buy Signal: A buy is triggered if, after setup:
Price rises back above the level,
The RSI rate of change (ROC) indicates exhaustion of the drop,
The current bar shows positive momentum.
2. Trade Management
Stop Loss & Take Profit: Configurable fixed or trailing stop loss and take profit levels are plotted and managed automatically.
Exit Signals: The script signals exit based on price action relative to these risk management levels.
3. Filters & Enhancements
Parabolic Move Filter: Prevents entries during extreme price moves.
Dead Cat Bounce Filter: Avoids false signals after sharp reversals.
Volume Filter: Optionally requires volume conditions for trade entries (especially for shorts).
Multiple Confirmation Layers : Includes checks for 5-minute RSI, momentum, and price retracement.
User Inputs & Customization
Trade Direction: Toggle between LONG and SHORT signal generation.
Trigger Settings: Adjust thresholds for price moves, lookback windows, RSI ROC, and volume requirements.
Trade Settings: Set take profit, stop loss, and trailing stop behavior.
Debug & Visualization: Enable or disable various plots, labels, and debug tables for in-depth analysis.
Backtesting: Integrated backtester with summary and detailed statistics tables.
Technical Features
Uses External Libraries: Relies on RifleShooterLib for core logic and BackTestLib for backtesting and statistics.
Multi-timeframe Analysis: Incorporates both 30-second and 5-minute RSI calculations.
Chart Annotations: Plots entry/exit points, risk levels, and debug information directly on the chart.
Alert Conditions: Built-in alert triggers for key events (initial move, stall, entry).
Intended Use
Markets: Dow Jones symbols (YM, MYM, US30, or US30 CFD).
Timeframe: 30-second chart.
Purpose: Automated signal generation for discretionary or algorithmic trading, with robust risk management and backtesting support.
Notable Customization & Extension Points
Momentum Calculation: Plans to replace the current momentum measure with "sqz momentum".
Displacement Logic: Future update to use "FVG concept" for displacement.
High-Contrast RSI: Optional visual enhancements for RSI extremes.
Time-based Stop: Consideration for adding a time-based stop mechanism.
This script is highly modular, with extensive user controls, and is suitable for both live trading and historical analysis of Dow Jones index movements
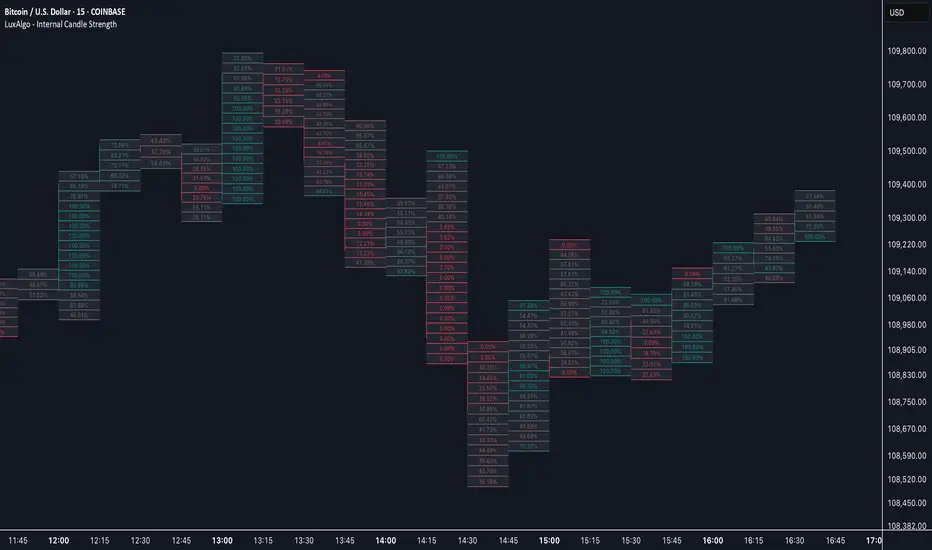
Internal Candle Strength [LuxAlgo]The Internal Candle Strength tool allows traders to divide each chart bar into multiple rows of custom size and inspect the strength of the lower timeframes trends located within each row.
This tool effectively helps traders in identifying the power dynamic between bulls and bears within multiple areas within each bar, providing the ability to conduct LTF analysis.
🔶 USAGE
The strength displayed within each row ranges from 0% to 100%, with 0% being the most bearish and 100% being the most bullish.
Traders should be aware of the extreme probabilities located at the higher/lower end of the bars, as this can signal a change in strength and price direction.
Traders can select the lower timeframe to pull the data from or the row size in the scale of the chart. Selecting a lower timeframe will provide more data to evaluate an area's strength.
Do note that only a timeframe lower than the chart timeframe should be selected.
🔹 Row Size
Selecting a smaller row size will increase the number of rows per bar, allowing for a more detailed analysis. A lower value will also generally mean that less data will be considered when calculating the strength of a specific area.
As we can see on the chart above (all BTCUSD 30m), by selecting a different row size, traders can control how many rows are displayed per bar.
🔶 SETTINGS
Timeframe: Lower timeframe used to calculate the candle strength.
Row Size: Size of each row on the chart scale, expressed as a fraction of the candle range.
Range Breakout [sgbpulse]Range Breakout
1. Overview
The "Range Breakout " indicator is a powerful tool designed to identify and visually display price ranges on your chart using pivot points. It dynamically draws two distinct boxes – an External Range and an Internal Range – helping traders pinpoint potential support and resistance zones. Beyond its visual representation, the indicator offers a comprehensive set of 12 unique breakout alerts, providing real-time notifications for significant price movements outside these defined ranges. Additionally, it integrates RSI and MFI metrics for momentum confirmation.
2. How It Works
The indicator operates by identifying pivot points based on user-defined "left" and "right" bar lengths. A high pivot is a bar with a specified number of lower highs both to its left and right, and similarly for a low pivot.
External Range: Calculated using longer pivot lengths (default: 15 bars left, 6 bars right). This range represents broader, more significant price consolidation areas.
Internal Range: Calculated using shorter pivot lengths (default: 4 bars left, 3 bars right). This range captures tighter, more immediate price consolidations within the broader trend.
The External Range will always be greater than or equal to the Internal Range, as it's based on a wider historical context. Both ranges are displayed as transparent boxes on your chart, dynamically adjusting as new pivots are formed.
3. Key Features and Settings
Customizable Pivot Lengths:
External Range (Left/Right Bars): Adjust sensitivity for identifying the broader price range. Longer lengths lead to more stable, but less frequent, range updates.
Internal Range (Left/Right Bars): Adjust sensitivity for the tighter, more immediate price range.
Tool Tips: Minimum 6 bars for the External Range, and minimum 2 bars for the Internal Range.
Customizable Range Colors: Easily change the background colors of the External and Internal Range boxes to match your chart's aesthetic.
Dynamic Range Display: The indicator automatically updates the range boxes as new pivot highs and lows are formed, always presenting the most current valid ranges.
RSI / MFI Settings:
Timeframe Source: Select the timeframe for RSI and MFI calculation.
- Chart: Calculation based on the current chart timeframe.
- Daily: Always calculated based on the daily ("D") timeframe, even if the chart is on a lower timeframe.
RSI Length: Period length for RSI calculation (default: 14).
RSI Overbought Level: Overbought level for RSI (default: 70.0).
RSI Oversold Level: Oversold level for RSI (default: 30.0).
MFI Length: Period length for MFI calculation (default: 14).
MFI Overbought Level: Overbought level for MFI (default: 80.0).
MFI Oversold Level: Oversold level for MFI (default: 20.0).
4. Synergy of Ranges & Breakout Strength
The interaction between the External and Internal Ranges provides deep insights into price movement and breakout strength:
Immediate Direction: The movement of the Internal Range (up or down) indicates the short-term directional bias within the broader framework of the External Range.
Strength Confirmation: A breakout of the External Range, followed by a breakout of the Internal Range, confirms the strength of the move and increases confidence in the breakout.
Strong Momentum ("Leaving" Ranges Behind): When price breaks out with exceptionally strong momentum, it continues to move aggressively and does not immediately form new pivots. In such situations, the existing ranges (External and Internal) remain in place while the candles "leave them behind." A "Full Candle" breakout, where the entire candle moves past both ranges, indicates a particularly powerful and decisive move.
Momentum (RSI / MFI) as Confirmation:
- RSI (Relative Strength Index): Measures the speed and change of price movements. Extreme values (above 70 or below 30) indicate overbought/oversold conditions respectively, confirming strong momentum in a breakout.
- MFI (Money Flow Index): Similar to RSI but incorporates volume. Extreme values (above 80 or below 20) indicate strong money flow in/out, reinforcing breakout confirmation.
- Importance of Confirmation: If a breakout occurs but momentum indicators do not confirm it (for example, an upside breakout while RSI is declining), this could signal weakness in the move and the risk of a false breakout (Fakeout).
5. Visuals
The indicator provides clear visual representations on the chart:
Range Boxes:
Two dynamic boxes are drawn on the chart: one for the External Range and one for the Internal Range.
These boxes update continuously, displaying the current range boundaries based on the latest pivots. They provide an immediate visual indication of support and resistance levels.
RSI/MFI Status Labels:
Small text labels appear to the right of the current bar, vertically centered.
They display the status of RSI and MFI: RSI OB (Overbought), RSI OS (Oversold), MFI OB, MFI OS, along with the exact value.
Important: The labels remain on the chart as long as the condition holds (indicator is above/below the level), unlike alerts which mark a singular crossover event.
Plotting of Key Values:
The indicator plots six invisible series on the chart, primarily to allow the user to view the exact numerical values of:
- The upper and lower bounds of the External Range (External High, External Low).
- The upper and lower bounds of the Internal Range (Internal High, Internal Low).
- The calculated RSI and MFI values (RSI, MFI).
These values are accessible for viewing through TradingView's Data Window and also via the Status Line when hovering over the relevant candle. This enables more precise quantitative analysis of range levels and momentum.
6. Comprehensive Breakout Alerts
The "Range Breakout " indicator provides 12 distinct alert conditions for breakouts, allowing you to select the required level of confirmation for each alert. All alerts are triggered only upon a fully confirmed bar close (barstate.isconfirmed) to minimize false signals and ensure reliability.
All breakout alerts are configured to detect a Crossover/Crossunder of the levels, meaning a specific event where the price moves from one side of the range to the other.
External Range Breakout UP
- Close: Price closes above the External Range.
- Real Body: The entire "real body" of the candle (min of open/close prices) closes above the External Range.
- Full Candle: The entire candle (the lowest point of the candle) closes above the External Range.
External Range Breakout DOWN
- Close: Price closes below the External Range.
- Real Body: The entire "real body" of the candle (max of open/close prices) closes below the External Range.
- Full Candle: The entire candle (the highest point of the candle) closes below the External Range.
Internal Range Breakout UP
- Close: Price closes above the Internal Range.
- Real Body: The "real body" of the candle closes above the Internal Range.
- Full Candle: The entire candle closes above the Internal Range.
Internal Range Breakout DOWN
- Close: Price closes below the Internal Range.
- Real Body: The "real body" of the candle closes below the Internal Range.
- Full Candle: The entire candle closes below the Internal Range.
7. Ideal Use Cases
This indicator is ideal for traders who:
Want to clearly identify and monitor price consolidation zones.
Seek confirmation for breakout strategies across various timeframes.
Require reliable and automated alerts for potential entry or exit points based on range expansion.
8. Complementary Indicator
For even more comprehensive market analysis, we highly recommend using this indicator in conjunction with Market Structure Support & Resistance External/Internal & BoS .
This powerful complementary indicator automatically and accurately identifies significant support and resistance levels by locating high and low pivot points, as well as key Pre-Market High/Low levels. Its strength lies in its dynamic adaptability to any timeframe and asset, providing precise and relevant real-time levels while maintaining a clean chart. It also identifies Break of Structure (BoS) to signal potential trend changes or continuations.
Using both indicators together provides a robust framework for identifying defined ranges and potential trend shifts, enabling more informed trading decisions.
View Market Structure Support & Resistance External/Internal & BoS Indicator
9. Important Note: Trading Risk
This indicator is intended for educational and informational purposes only and does not constitute investment advice or a recommendation for trading in any form whatsoever.
Trading in financial markets involves significant risk of capital loss. It is important to remember that past performance is not indicative of future results. All trading decisions are your sole responsibility. Never trade with money you cannot afford to lose.

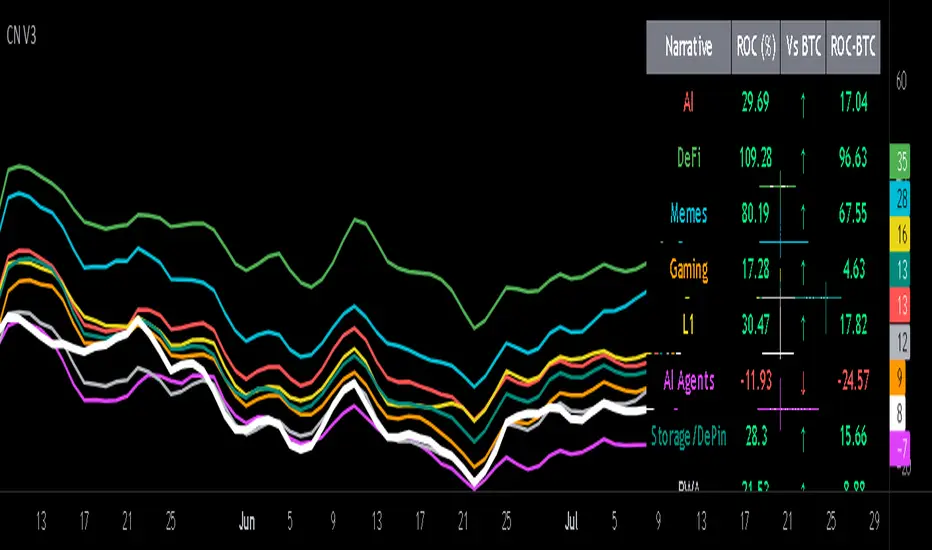
Crypto Narratives: Relative Strength V2Simple Indicator that displays the relative strength of 8 Key narratives against BTC as "Spaghetti" chart. The chart plots an aggregated RSI value for the 5 highest Market Cap cryopto's within each relevant narrative. The chart plots a 14 period SMA RSI for each narrative.
Functionality:
The indicator calculates the average RSI values for the current leading tokens associated with ten different crypto narratives:
- AI (Artificial Intelligence)
- DeFi (Decentralized Finance)
- Memes
- Gaming
- Level 1 (Layer 1 Protocols)
- AI Agents
- Storage/DePin
- RWA (Real-World Assets)
- BTC
Usage Notes:
The 5 crypto coins should be regularly checked and updated (in the script) by overtyping the current values from Rows 24 - 92 to ensure that you are using the up to date list of highest marketcap coins (or coins of your choosing).
The 14 period SMA can be changed in the indicator settings.
The indicator resets every 24 hours and is set to UTC+10. This can be changed by editing the script line 19 and changing the value of "resetHour = 1" to whatever value works for your timezone.
There is also a Rate of Change table that details the % rate of change of each narrative against BTC
Horizontal lines have been included to provide an indication of overbought and oversold levels.
The upper and lower horizontal line (overbought and oversold) can be adjusted through the settings.
The line width, and label offset can be customised through the input options.
Alerts can be set to triggered when a narrative's RSI crosses above the overbought level or below the oversold level. The alerts include the narrative name, RSI value, and the RSI level.
RSI Multi-Timeframe Dashboard by giua64)### Summary
This is an advanced dashboard that provides a comprehensive overview of market strength and momentum, based on the Relative Strength Index (RSI) analyzed across 6 different timeframes simultaneously (from 5 minutes to the daily chart).
The purpose of this script is to offer traders an immediate and easy-to-read summary of market conditions, helping to identify the prevailing trend direction, overbought/oversold levels, and potential reversals through divergence detection. All of this is available in a single panel, eliminating the need to switch timeframes on your main chart.
### Key Features
* **Multi-Timeframe Analysis:** Simultaneously monitors the 5m, 15m, 30m, 1H, 4H, and Daily timeframes.
* **Scoring System:** Each timeframe is assigned a score based on multiple RSI conditions (e.g., above/below 50, overbought/oversold status, direction) to quantify bullish or bearish strength.
* **Aggregated Signal:** The dashboard calculates a total percentage score and provides a clear summary signal: **LONG**, **SHORT**, or **WAIT**.
* **Divergence Detection:** Automatically identifies Bullish and Bearish divergences between price and RSI for each timeframe.
* **Non-Repainting Option:** In the settings, you can choose to base calculations on the close of the previous candle (`Use RSI on Closed Candle`). This ensures that past signals (like status and score) do not change, providing more reliable data for analysis.
* **Fully Customizable:** Users can modify the RSI period, overbought/oversold thresholds, divergence detection settings, and the appearance of the table.
### How to Read the Dashboard
The table consists of 6 columns, each providing specific information:
* **% (Total Score):**
* **Header:** Shows the overall strength as a percentage. A positive value indicates bullish momentum, while a negative value indicates bearish momentum. The background color changes based on intensity.
* **Rows:** Displays the numerical score for the individual timeframe.
* **RSI:**
* **Header:** The background color indicates the average of all RSI values. Green if the average is > 50, Red if < 50.
* **Rows:** Shows the real-time RSI value for that timeframe.
* **Signal (Status):**
* **Header:** This is the final operational signal. It turns **🟢 LONG** when bullish strength is high, **🔴 SHORT** when bearish strength is high, and **⚪ WAIT** in neutral conditions.
* **Rows:** Describes the RSI status for that timeframe (e.g., Bullish, Bearish, Overbought, Oversold).
* **Dir (Direction):**
* **Header:** Displays an arrow representing the majority direction across all timeframes.
* **Rows:** Shows the instantaneous direction of the RSI (↗️ for rising, ↘️ for falling).
* **Diverg (Divergence):**
* Indicates if a bullish (`🟢 Bull`) or bearish (`🔴 Bear`) divergence has been detected on that timeframe.
* **TF (Timeframe):**
* Indicates the reference timeframe for that row.
### Advantages and Practical Use
This tool was created to solve a common problem: the need to analyze multiple charts to understand the bigger picture. With this dashboard, you can:
1. **Confirm a Trend:** A predominance of green and a "LONG" signal provides strong confirmation of bullish sentiment.
2. **Identify Weakness:** Red signals on higher timeframes can warn of an impending loss of momentum.
3. **Spot Turning Points:** A divergence on a major timeframe can signal an excellent reversal opportunity.
### Originality and Acknowledgements
This script is an original work, written from scratch by giua64. The idea was to create a comprehensive and visually intuitive tool for RSI analysis.
Any feedback, comments, or suggestions to improve the script are welcome!
**Disclaimer:** This is a technical analysis tool and should not be considered financial advice. Always do your own research and backtest any tool before using it in a live trading environment.
Script open-source
In pieno spirito TradingView, il creatore di questo script lo ha reso open-source, in modo che i trader possano esaminarlo e verificarne la funzionalità. Complimenti all'autore! Sebbene sia possibile utilizzarlo gratuitamente, ricorda che la ripubblicazione del codice è soggetta al nostro Regolamento.
giua64
borsamercati.it – Educational tools by giua64
Anche su:
Declinazione di responsabilità
Le informazioni ed i contenuti pubblicati non costituiscono in alcun modo una sollecitazione ad investire o ad operare nei mercati finanziari. Non sono inoltre fornite o supportate da TradingView. Maggiori dettagli nelle Condizioni d'uso.

Low Price RSI CrossoverThis Pine Script indicator is a Multi-Timeframe Low RSI Crossover system that combines three key filtering criteria to identify high-probability buy signals. Here's what it does:
Core Concept
The indicator only generates buy signals when all three conditions are met simultaneously:
Price at Multi-Period Low: Current price must be at or near the lowest point within your selected timeframe (1 week to 5 years, or custom)
RSI Momentum Shift: The smoothed RSI must cross above its signal line (EMA), indicating upward momentum
Below Threshold Entry: Both the RSI and its signal line must be below your threshold level (default 50) when the crossover occurs
Key Features
RSI Smoothing: Uses Hull Moving Average (HMA) to smooth the raw RSI, reducing noise and false signals while maintaining responsiveness.
Flexible Timeframes: Choose from predefined periods (1W, 2W, 3W, 1M, 2M, 3M, 6M, 9M, 1Y, 2Y, 3Y, 5Y) or set a custom number of bars.
Visual Feedback:
Plots the smoothed RSI (blue line) and its signal line (red line)
Shows threshold and overbought levels
Highlights signal bars with green background
Displays tiny green triangles at signal points
Real-time status table showing all conditions
Trading Logic
This is essentially a mean-reversion strategy that waits for:
Price to reach significant lows (value zone)
Momentum to start shifting upward (RSI crossover)
Entry from oversold/neutral territory (below 50 RSI)
Why This Works
By requiring price to be at multi-period lows, you avoid buying during downtrends or sideways chop. The RSI crossover confirms that selling pressure is starting to ease, while the threshold filter ensures you're not buying into overbought conditions.
The combination of these filters should significantly reduce false signals compared to using any single indicator alone.

Divergence Screener [Trendoscope®]🎲Overview
The Divergence Screener is a powerful TradingView indicator designed to detect and visualize bullish and bearish divergences, including hidden divergences, between price action and a user-selected oscillator. Built with flexibility in mind, it allows traders to customize the oscillator type, trend detection method, and other parameters to suit various trading strategies. The indicator is non-overlay, displaying divergence signals directly on the oscillator plot, with visual cues such as lines and labels on the chart for easy identification.
This indicator is ideal for traders seeking to identify potential reversal or continuation signals based on price-oscillator divergences. It supports multiple oscillators, trend detection methods, and alert configurations, making it versatile for different markets and timeframes.
🎲Features
🎯Customizable Oscillator Selection
Built-in Oscillators : Choose from a variety of oscillators including RSI, CCI, CMO, COG, MFI, ROC, Stochastic, and WPR.
External Oscillator Support : Users can input an external oscillator source, allowing integration with custom or third-party indicators.
Configurable Length : Adjust the oscillator’s period (e.g., 14 for RSI) to fine-tune sensitivity.
🎯Divergence Detection
The screener identifies four types of divergences:
Bullish Divergence : Price forms a lower low, but the oscillator forms a higher low, signaling potential upward reversal.
Bearish Divergence : Price forms a higher high, but the oscillator forms a lower high, indicating potential downward reversal.
Bullish Hidden Divergence : Price forms a higher low, but the oscillator forms a lower low, suggesting trend continuation in an uptrend.
Bearish Hidden Divergence : Price forms a lower high, but the oscillator forms a higher high, suggesting trend continuation in a downtrend.
🎯Flexible Trend Detection
The indicator offers three methods to determine the trend context for divergence detection:
Zigzag : Uses zigzag pivots to identify trends based on higher highs (HH), higher lows (HL), lower highs (LH), and lower lows (LL).
MA Difference : Calculates the trend based on the difference in a moving average (e.g., SMA, EMA) between divergence pivots.
External Trend Signal : Allows users to input an external trend signal (positive for uptrend, negative for downtrend) for custom trend analysis.
🎯Zigzag-Based Pivot Analysis
Customizable Zigzag Length : Adjust the zigzag length (default: 13) to control the sensitivity of pivot detection.
Repaint Option : Choose whether divergence lines repaint based on the latest data or wait for confirmed pivots, balancing responsiveness and reliability.
🎯Visual and Alert Features
Divergence Visualization : Divergence lines are drawn between price pivots and oscillator pivots, color-coded for easy identification:
Bullish Divergence : Green
Bearish Divergence : Red
Bullish Hidden Divergence : Lime
Bearish Hidden Divergence : Orange
Labels and Tooltips : Labels (e.g., “D” for divergence, “H” for hidden) appear on price and oscillator pivots, with tooltips providing detailed information such as price/oscillator values, ratios, and pivot directions.
Alerts : Configurable alerts for each divergence type (bullish, bearish, bullish hidden, bearish hidden) trigger on bar close, ensuring timely notifications.
🎲 How It Works
🎯Oscillator Calculation
The indicator calculates the selected oscillator (or uses an external source) and plots it on the chart.
Oscillator values are stored in a map for reference during divergence calculations.
🎯Pivot Detection
A zigzag algorithm identifies pivots in the oscillator data, with configurable length and repainting options.
Price and oscillator pivots are compared to detect divergences based on their direction and ratio.
🎯Divergence Identification
The indicator compares price and oscillator pivot directions (HH, HL, LH, LL) to identify divergences.
Trend context is determined using the selected method (Zigzag, MA Difference, or External).
Divergences are classified as bullish, bearish, bullish hidden, or bearish hidden based on price-oscillator relationships and trend direction.
🎯Visualization and Alerts
Valid divergences are drawn as lines connecting price and oscillator pivots, with corresponding labels.
Alerts are triggered for allowed divergence types, providing detailed information via tooltips.
🎯Validation
Divergence lines are validated to ensure no intermediate bars violate the divergence condition, enhancing signal reliability.
🎲 Usage Instructions as Indicator
🎯Add to Chart:
Add the “Divergence Screener ” to your TradingView chart.
The indicator appears in a separate pane below the price chart, plotting the oscillator and divergence signals.
🎯Configure Settings:
Adjust the oscillator type and length to match your trading style.
Select a trend detection method and configure related parameters (e.g., MA type/length or external signal).
Set the zigzag length and repainting preference.
Enable/disable alerts for specific divergence types.
I🎯nterpret Signals:
Bullish Divergence (Green) : Look for potential buy opportunities in a downtrend.
Bearish Divergence (Red) : Consider sell opportunities in an uptrend.
Bullish Hidden Divergence (Lime) : Confirm continuation in an uptrend.
Bearish Hidden Divergence (Orange): Confirm continuation in a downtrend.
Use tooltips on labels to review detailed pivot and divergence information.
🎯Set Alerts:
Create alerts for each divergence type to receive notifications via TradingView’s alert system.
Alerts include detailed text with price, oscillator, and divergence information.
🎲 Example Scenarios as Indicator
🎯 With External Oscillator (Use MACD Histogram as Oscillator)
In order to use MACD as an oscillator for divergence signal instead of the built in options, follow these steps.
Load MACD Indicator from Indicator library
From Indicator settings of Divergence Screener, set Use External Oscillator and select MACD Histograme from the dropdown
You can now see that the oscillator pane shows the data of selected MACD histogram and divergence signals are generated based on the external MACD histogram data.
🎯 With External Trend Signal (Supertrend Ladder ATR)
Now let's demonstrate how to use external direction signals using Supertrend Ladder ATR indicator. Please note that in order to use the indicator as trend source, the indicator should return positive integer for uptrend and negative integer for downtrend. Steps are as follows:
Load the desired trend indicator. In this example, we are using Supertrend Ladder ATR
From the settings of Divergence Screener, select "External" as Trend Detection Method
Select the trend detection plot Direction from the dropdown. You can now see that the divergence signals will rely on the new trend settings rather than the built in options.
🎲 Using the Script with Pine Screener
The primary purpose of the Divergence Screener is to enable traders to scan multiple instruments (e.g., stocks, ETFs, forex pairs) for divergence signals using TradingView’s Pine Screener, facilitating efficient comparison and identification of trading opportunities.
To use the Divergence Screener as a screener, follow these steps:
Add to Favorites : Add the Divergence Screener to your TradingView favorites to make it available in the Pine Screener.
Create a Watchlist : Build a watchlist containing the instruments (e.g., stocks, ETFs, or forex pairs) you want to scan for divergences.
Access Pine Screener : Navigate to the Pine Screener via TradingView’s main menu: Products -> Screeners -> Pine, or directly visit tradingview.com/pine-screener/.
Select Watchlist : Choose the watchlist you created from the Watchlist dropdown in the Pine Screener interface.
Choose Indicator : Select Divergence Screener from the Choose Indicator dropdown.
Configure Settings : Set the desired timeframe (e.g., 1 hour, 1 day) and adjust indicator settings such as oscillator type, zigzag length, or trend detection method as needed.
Select Filter Criteria : Select the condition on which the watchlist items needs to be filtered. Filtering can only be done on the plots defined in the script.
Run Scan : Press the Scan button to display divergence signals across the selected instruments. The screener will show which instruments exhibit bullish, bearish, bullish hidden, or bearish hidden divergences based on the configured settings.
🎲 Limitations and Possible Future Enhancements
Limitations are
Custom input for oscillator and trend detection cannot be used in pine screener.
Pine screener has max 500 bars available.
Repaint option is by default enabled. When in repaint mode expect the early signal but the signals are prone to repaint.
Possible future enhancements
Add more built-in options for oscillators and trend detection methods so that dependency on external indicators is limited
Multi level zigzag support

ARSI – (VWAP & ATR) 3QKRAKThe ARSI Long & Short – Dynamic Risk Sizing (VWAP & ATR) indicator combines three core components—an adjusted RSI oscillator (ARSI), Volume‐Weighted Average Price (VWAP), and Average True Range (ATR)—so that entry/exit signals and position sizing are always tailored to current market conditions. ARSI, plotted from 0 to 100 with clearly marked overbought and oversold zones, is the primary signal driver: when ARSI falls below the lower threshold it indicates an excessive sell‐off and flags a long opportunity, whereas a break above the upper threshold signals overextended gains and foreshadows a short. A midpoint line at 50 can serve as an early exit or reduction signal when crossed against your position.
VWAP, showing the volume‐weighted average price over the chosen period, acts as a trend filter—long trades are only taken when price sits above VWAP, and shorts only when it’s below—ensuring each trade aligns with the prevailing market momentum. ATR measures current volatility and is used both to set safe stop‐loss levels and to dynamically size each position. In practice, this means positions automatically shrink in high‐volatility environments and grow in quieter markets, all while risking a fixed percentage of your capital.
Everything appears on a single chart: the ARSI pane below the price window with its reference levels; VWAP overlaid on the price; and the ATR‐based stop‐loss distances graphically displayed. Traders thus get a comprehensive, at-a-glance view of entries, exits, trend confirmation, and exactly how large a position they can safely take. The indicator runs in real time, removing the need for manual parameter calculations and letting you focus on strategic decision-making.

Adiyogi Trend🟢🔴 “Adiyogi” Trend — Market Alignment Visualizer
“Adiyogi” Trend is a powerful, non-intrusive trend detection system built for traders who seek clarity, discipline, and alignment with true market flow. Inspired by the meditative stillness of Adiyogi and the need for mindful, high-probability decisions, this tool offers a clean and intuitive visual guide to trending environments — without cluttering the chart or pushing forced trades.
This is not a buy/sell signal generator. Instead, it is designed as a background confirmation engine that helps you stay on the right side of the market by identifying moments of true directional strength.
🧠 Core Logic
The “Adiyogi” Trend indicator highlights the background of your chart in green or red when multiple layers of strength and structure align — including momentum, market positioning, and relative force. Only when these internal components agree does the system activate a directional state.
It’s built on three foundational energies of trend confirmation:
Strength of movement
Structure in price action
Conviction in momentum
By combining these into one visual background, the indicator filters out indecision and helps you stay focused during real trend phases — whether you're day trading, swing trading, or holding longer-term positions.
📌 Core Concepts Behind the Tool
The indicator integrates three essential market filters—each confirming a different dimension of trend strength:
ADX (Average Directional Index) – Measures trend momentum.
You’ve chosen a very responsive setting (ADX Length = 2), which helps catch the earliest possible signs of momentum emergence.
The threshold is ADX ≥ 22, ensuring that weak or sideways markets are filtered out.
SuperTrend (10,1) – Captures short-term trend direction.
This setup follows price closely and reacts quickly to reversals, making it ideal for fast-moving assets or intraday strategies.
SuperTrend acts as the structural confirmation of directional bias.
RSI (Relative Strength Index) – Measures strength based on recent price closes.
You’ve configured RSI > 50 for bullish zones and < 50 for bearish—a neutral midpoint standard often used by professional traders.
This ensures that only trades in sync with momentum and recent strength are highlighted.
🌈 How It Visually Works
Background turns GREEN when:
ADX ≥ 22, indicating strong momentum
Price is above the 20 EMA and above SuperTrend (10,1)
RSI > 50, confirming recent strength
Background turns RED when:
ADX ≥ 22, indicating strong momentum
Price is below the 20 EMA and below SuperTrend (10,1)
RSI < 50, confirming recent weakness
The background remains neutral (transparent) when trend conditions are not clearly aligned—this is the tool's way of keeping you out of indecisive markets.
A label (BULL / BEAR) appears only when the bias flips from the previous one. This helps avoid repeated or redundant alerts, focusing your attention only when something changes.
📊 Practical Uses & Benefits
✅ Stay with the trend: Perfectly filters out choppy or sideways markets by only activating when conditions align across momentum, structure, and strength.
✅ Pre-trade confirmation: Use this tool to confirm trade setups from other indicators or price action patterns.
✅ Avoid noise: Prevent overtrading by focusing only on high-quality trend conditions.
✅ Visual clarity: Unlike arrows or plots that clutter the chart, this tool subtly highlights trend conditions in the background, preserving your price action view.
📍 Important Notes
This is not a buy/sell signal generator. It is a trend-confirmation system.
Use it in conjunction with your existing entry setups—such as breakouts, order blocks, retests, or candlestick patterns.
The tool helps you stay in sync with the dominant direction, especially when combining multiple timeframes.
Can be used on any market (stocks, forex, crypto, indices) and on any timeframe.

RSI-BBGun-v6.1RSI BB Gun – Operator's Guide
“Eyes on target. Wait for the right moment. Then strike.”
________________________________________
🎯 Mission Objective
RSI BB Gun identifies extreme market conditions using RSI and Bollinger Bands, then overlays trend and volatility intelligence so you know when the setup is real.
The ❌ is your target acquisition signal—price just moved from an extreme zone back into play. Now you’ve got a clean radar lock.
________________________________________
📡 How to Operate
🟣 Step 1: Watch for the ❌'s (Black X = RSI & Bollinger Band Extremes Encountered)
• The Purple X means price and RSI are both stretched—and just snapped back into range.
• The target is now in the cross hairs and potentially ready for engagement.
🟥 Step 2: Confirm the Trend
• The thick ribbon tells you if the trend is with you:
o 🟢 Green = Uptrend. Focus on long setups.
o 🔴 Red = Downtrend. Focus on puts or short plays.
• Align with trend. Only engage when the field favors your position.
🔺 Step 3: Evaluate Signal Context
• Green Triangles = price just crossed below lower Bollinger Band (oversold).
• Red Triangles = price crossed above upper Band (overbought).
• Horizontal Lines Disappeared = The bar after the green or red horizontal line disappears means its time. We patiently wait for this as it means the momentum may be changing.
• These are your early indicators—they scout the setup on the GO / NO GO DECISION.
• ❌ + triangle + trend = clean shot.
________________________________________
☁️ Avoid These Situations
• ❌ in a choppy/no-trend zone = false alarm. Don’t engage.
• Repeated black ❌s without a purple ❌confirmation = low conviction. Let it go.
________________________________________
________________________________________
🪖 Operator's Mindset
“You don’t chase trades. You stalk them. When the ❌ flashes, the system has found a target. What you do next is up to your discipline, your tools, and your plan.”
________________________________________
Note: This is a free version. Upcoming paid version includes multi-timeframes working together. Multiple strategies. Volatility meter. Make money and master the BB Gun so that you can elevate to the Snipers weapon.
🔒 Want More Firepower?
Upgraded version coming soon. Unlocks next-gen targeting tools:
• Multi-timeframe RSI intelligence in a live dashboard
• Precision-timed combo signals based on layered volatility + RSI logic
• Advanced trend filters, trade zone overlays, and sniper-level entry indicators
• Ideal for swing traders and options strategists who want clarity under pressure
💥 Budget-friendly. No subscription. Upgrade when you're ready to go Pro.
Tip: Make 4+ trades mastering this setup. Then use a small portion of the trades to gain more features. Always be in a position you cannot lose.
🆚 Why This Beats Standard RSI/BB Tools
Mission Feature Basic Indicators RSI Ribbon Lite
Trend Confirmation ❌ ✅ Ribbon Overlay
Multi-Timeframe Awareness ❌ ✅ 5-Timeframe RSI Grid
Volatility Confirmation ❌ ✅ Weighted ATR Scoring
Combo Signal Alerts ❌ ✅ ❌ Reentry Combo Alerts
TradingView Alerts ❌ ✅ Built-In Radar Ping
#rsi #bb #bollingerbands #hull ma #trend