Trading Psychology - Fear & Greed Index by DGTPsychology of a Market Cycle - Where are we in the cycle?
Before proceeding with the question "where", let's first have a quick look at "What is market psychology?"
Market psychology is the idea that the movements of a market reflect the emotional state of its participants. It is one of the main topics of behavioral economics - an interdisciplinary field that investigates the various factors that precede economic decisions. Many believe that emotions are the main driving force behind the shifts of financial markets and that the overall fluctuating investor sentiment is what creates the so-called psychological market cycles - which is also dynamic.
Stages of Investor Emotions:
* Optimism – A positive outlook encourages us about the future, leading us to buy stocks.
* Excitement – Having seen some of our initial ideas work, we begin considering what our market success could allow us to accomplish.
* Thrill – At this point we investors cannot believe our success and begin to comment on how smart we are.
* Euphoria – This marks the point of maximum financial risk. Having seen every decision result in quick, easy profits, we begin to ignore risk and expect every trade to become profitable.
* Anxiety – For the first time the market moves against us. Having never stared at unrealized losses, we tell ourselves we are long-term investors and that all our ideas will eventually work.
* Denial – When markets have not rebounded, yet we do not know how to respond, we begin denying either that we made poor choices or that things will not improve shortly.
* Fear – The market realities become confusing. We believe the stocks we own will never move in our favor.
* Desperation – Not knowing how to act, we grasp at any idea that will allow us to get back to breakeven.
* Panic – Having exhausted all ideas, we are at a loss for what to do next.
* Capitulation – Deciding our portfolio will never increase again, we sell all our stocks to avoid any future losses.
* Despondency – After exiting the markets we do not want to buy stocks ever again. This often marks the moment of greatest financial opportunity.
* Depression – Not knowing how we could be so foolish, we are left trying to understand our actions.
* Hope – Eventually we return to the realization that markets move in cycles, and we begin looking for our next opportunity.
* Relief – Having bought a stock that turned profitable, we renew our faith that there is a future in investing.
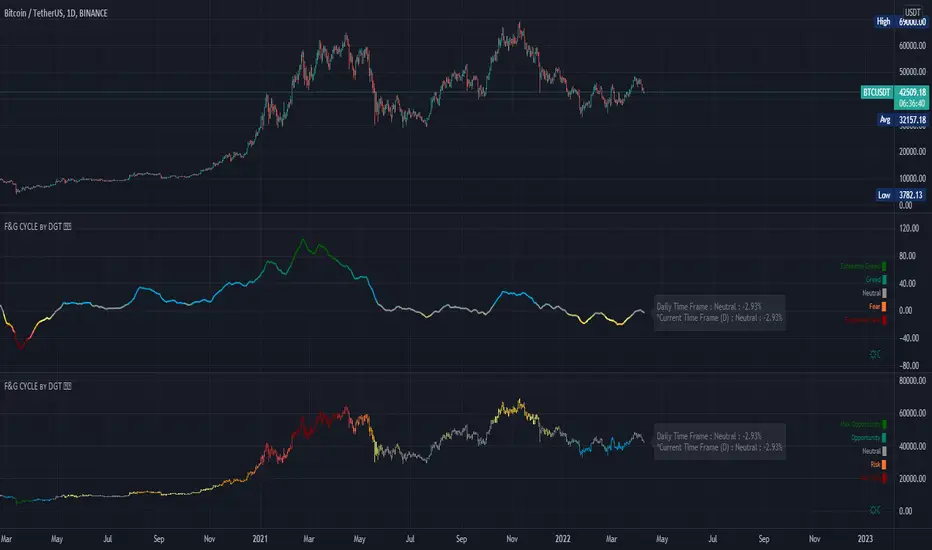
It's hard to predict with certainty where we exactly are in the market cycle, we can only make an educated guess as to the rough stage based on data available. And here comes the study "Trading Psychology - Fear & Greed Index"
Factors taken into account in this study include:
1-Price Momentum : Price Divergence/Convergence versus its Slow Moving Average
2-Strenght : Rate of Return (RoR) also called Return on Investment (ROI) is a performance measure used to evaluate the efficiency of an investment, net gain or loss of an investment over a specified time period, the rate of change in price movement over a period of time to help investors determine the strength
3-Money Flow : Chaikin Money Flow (CMF) is a technical analysis indicator used to measure Money Flow Volume over a set period of time. CMF can be used as a way to further quantify changes in buying and selling pressure and can help to anticipate future changes and therefore trading opportunities. CMF calculations is based on Accumulation/Distribution
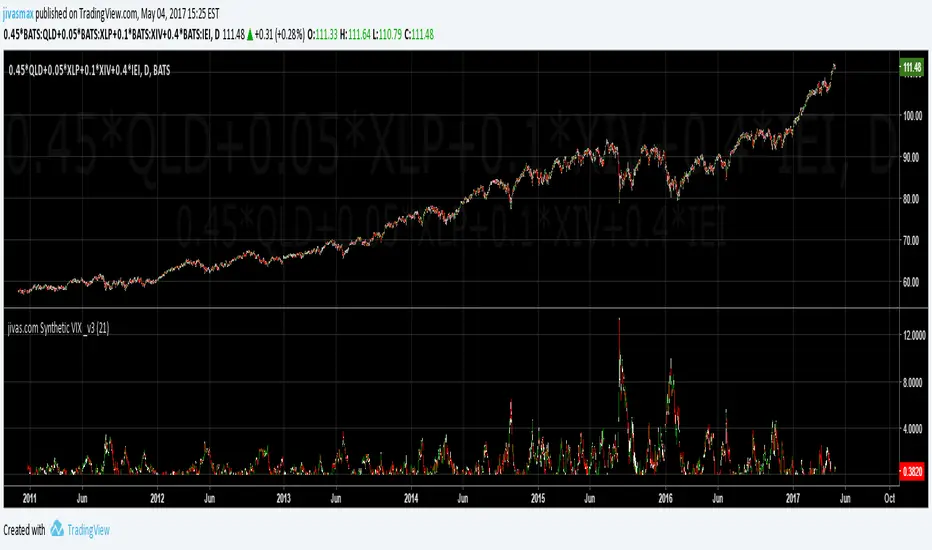
4-Market Volatility : CBOE Volatility Index (VIX), the Volatility Index, or VIX, is a real-time market index that represents the market's expectation of 30-day forward-looking volatility. Derived from the price inputs of the S&P 500 index options, it provides a measure of market risk and investors' sentiments. It is also known by other names like "Fear Gauge" or "Fear Index." Investors, research analysts and portfolio managers look to VIX values as a way to measure market risk, fear and stress before they take investment decisions
5-Safe Haven Demand : in this study GOLD demand is assumed
What to look for :
*Fear and Greed Index as explained above,
*Divergencies
Tool tip of the label displayed provides details of references
Conclusion:
As investors, we always get caught up in the day to day price movements, and lose sight of the bigger picture. The biggest crashes happen not when investors are cautious and fearful, it's when they're euphoric and expecting financial instruments to continue going higher. So as we continue investing, don’t forget to stop and ask yourself, where in the chart do you think we are right now? The Market Psychology Cycle shines light on how emotions evolve, fear and greed index can come in handy, provided that it is not the only tool used to make investment decisions. It is easy to look back at market cycles and recognize how the overall psychology changed. Analyzing previous data makes it obvious what actions and decisions would have been the most profitable. However, it is much harder to understand how the market is changing as it goes - and even harder to predict what comes next. Many investors use technical analysis (TA) to attempt to anticipate where the market is likely to go. Investors are advised to keep tabs on fear for potential buying the dips opportunities and view periods of greed as a potential indicator that financial instruments might be overvalued.
Warren Buffett's quote, buy when others are fearful, and sell when others are greedy
Trading success is all about following your trading strategy and the indicators should fit within your trading strategy, and not to be traded upon solely
Disclaimer : The script is for informational and educational purposes only. Use of the script does not constitute professional and/or financial advice. You alone have the sole responsibility of evaluating the script output and risks associated with the use of the script. In exchange for using the script, you agree not to hold dgtrd TradingView user liable for any possible claim for damages arising from any decision you make based on use of the script
Risk
Trend Risk Indicator (TRI)The Trend Risk Indicator is a simple bands indicator made of 2 custom averages of candlesticks ranges calculated within the variable “ BandBars ” period.
Upper and lower channel bands width can be adjusted with the “ Deviation ” variable, which act as a simple factor to enlarge the spread between them.
When Close crosses over the upper band, it is a bearish signal and candlesticks are painted in Red.
When Close crosses under the lower band, it’s a bullish signal and candlesticks are painted in Green.
One of the most interesting indicators for 1 minute scalping. Recommended to use on Renko bars.
*drag to chart and pin to scale, also remove borders from candlesticks.

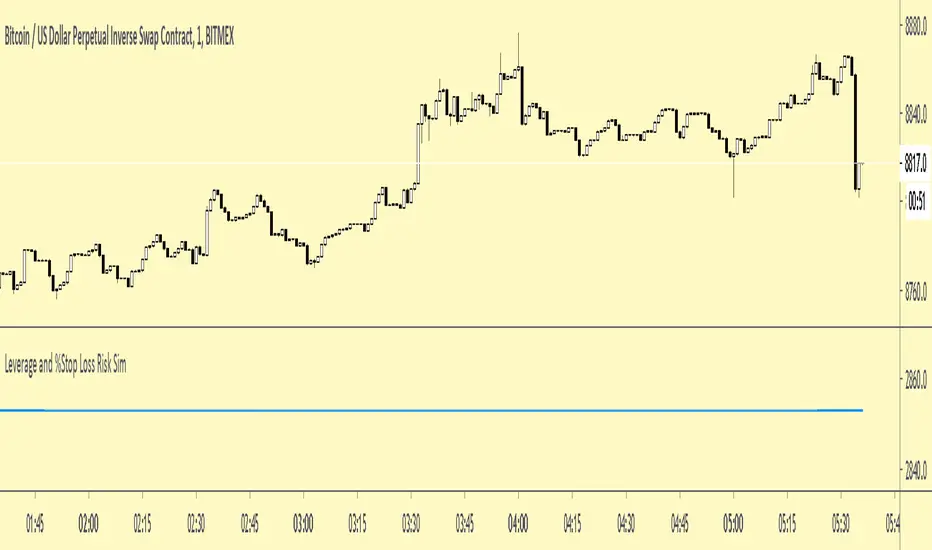
Drawdown SimulatorDrawdown Simulator.
Will simulate a series of percent based stop losses being triggered in a row if you risked x% of capital per trade.
Also simulates what the capital outcome would be if you were in a leveraged position.
Default settings simulate the use of $3000 starting capital balance , 1% Risk per trade and 5 Losing trades in a row with no leverage (1x).
This will not account of commission fees.
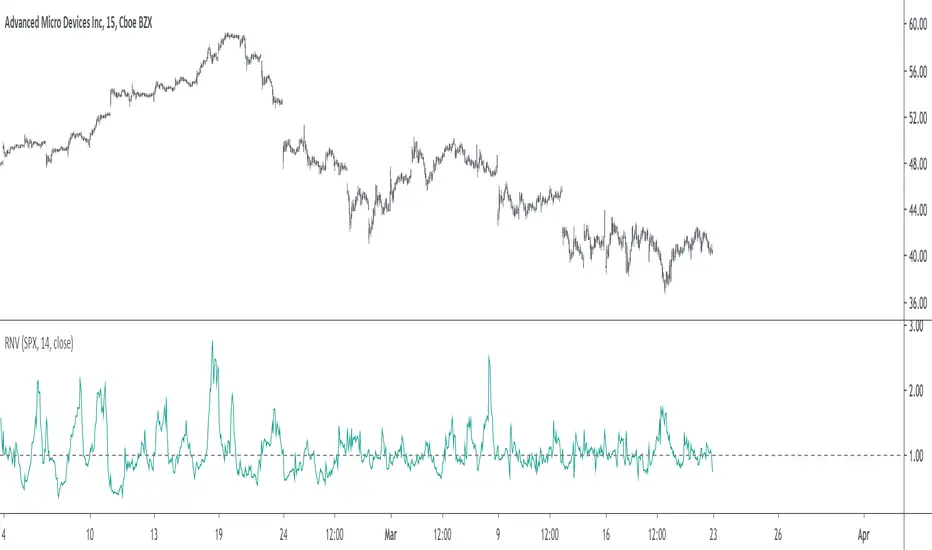
Relative Normalized VolatilityThere are plenty of indicators that aim to measure the volatility (degree of variation) in the price of an instrument, the most well known being the average true range and the rolling standard deviation. Volatility indicators form the key components of most bands and trailing stops indicators, but can also be used to normalize oscillators, they are therefore extremely versatile.
Today proposed indicator aim to compare the estimated volatility of two instruments in order to provide various informations to the user, especially about risk and profitability.
CALCULATION
The relative normalized volatility (RNV) indicator is the ratio between the moving average of the absolute normalized price changes value of two securities, that is:
SMA(|Δ(a)/σ(a)|)
―――――――――――
SMA(|Δ(b)/σ(b)|)
Where a and b are two different securities (note that notation "Δ(x)" refer to the 1st difference of x, and the "||" notation is used to indicate absolute value, for example "|x|" means absolute value of x) .
INTERPRETATION
The indicator aim tell us which security is more volatile between a and b , with a value of the indicator greater than 1 indicating that a is on average more volatile than b over the last length period, while a value lower than 1 indicating that the security b is more on average volatile than a .
The indicator use the current symbol as a , while the second security b must be defined in the setting window (by default the S&P500). Risk and profitability are closely related to volatility, as larger price variations could potentially mean larger losses (but also larger gains), therefore a value of the indicator greater than 1 can indicate that it could be more risked (and profitable) to trade security a .
RNV using AMD (top) volatility against Intel (bottom) volatility.
RNV using EURUSD (top) volatility against USDJPY (bottom) volatility.
Larger values of length will make the indicator fluctuate less often around 1. You can also plot the logarithm of the ratio instead in order to have the indicator centered around 0, it will also help make values originally below 1 have more importance in the scale.
POSSIBLE ERRORS
If you compare different types of markets the indicator might return NaN values, this is because one market might be closed, for example if you compare AMD against BTCUSD with the indicator you will get NaN values. If you really need to compare two markets then increase your time frame, else use an histogram or area plot in order to have a cleaner plot.
CONCLUSION
An original indicator comparing the volatility between two securities has been presented. The choice of posting a volatility indicator has been made by my twitter followers, so if you want to decide which type of indicator i should do next make sure to check my twitter to see if there are polls available (i should do one after every posted indicator).
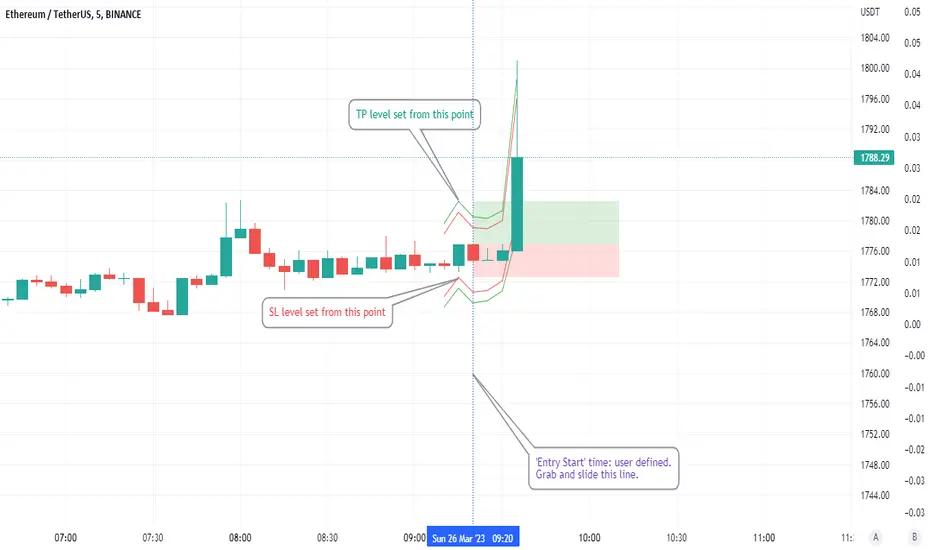
ATR based Stop and Take-Profit levels in realtime Little tool to quickly identify stops and take-profit levels based on Average True Range. User can change ATR multipiers, as well as the ATR length used. Green and red lines show these levels; plot is visible over last 8 bars only to reduce clutter. Label showing the current ATR, up above the last bar
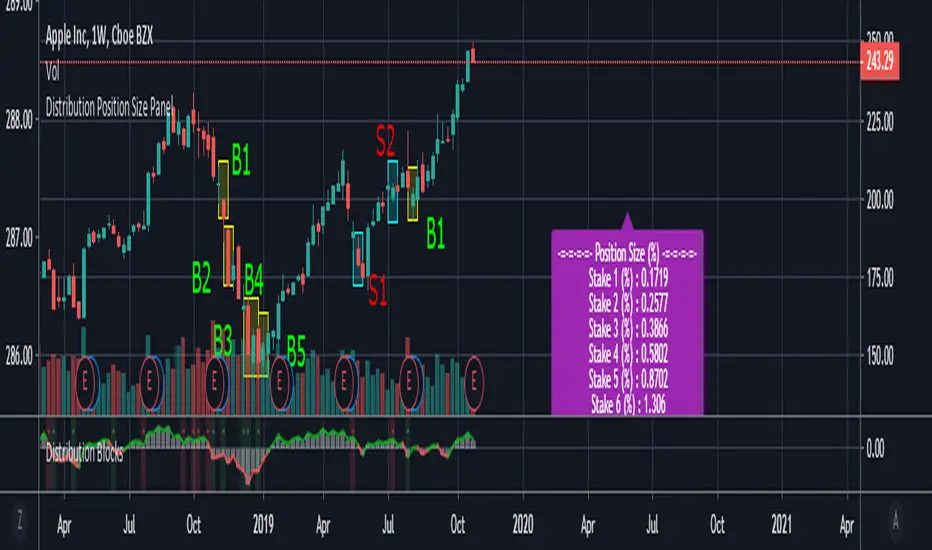
Distribution Position Size Panel
This panel is an example position size panel that I prepared and I consider the rates reasonable.
I have prepared this panel so that the money allocated to the investment ends 14 consecutive signals.
The sum of the ratios is 100 units.
You can adjust your positions according to this panel.
The first steps are low rates.
If the phrases are strong, you can specify a position size from the lower digits.
Likewise, when you make a big profit, you can empty your profits in the lower steps.
In the event of a color change, you can return to the beginning or lower limit.
NOTE: This script is an auxiliary command to the distribution blocks script,
if you want to use another script, you can add distribution days to yours.
14 th stake does not appear in the preview, you need to reduce the size of the distribution blocks indicator slightly.
Rafael Zioni's examples of the panels helped a lot, thanks to him.
Stay tuned ! Regards , Noldo.
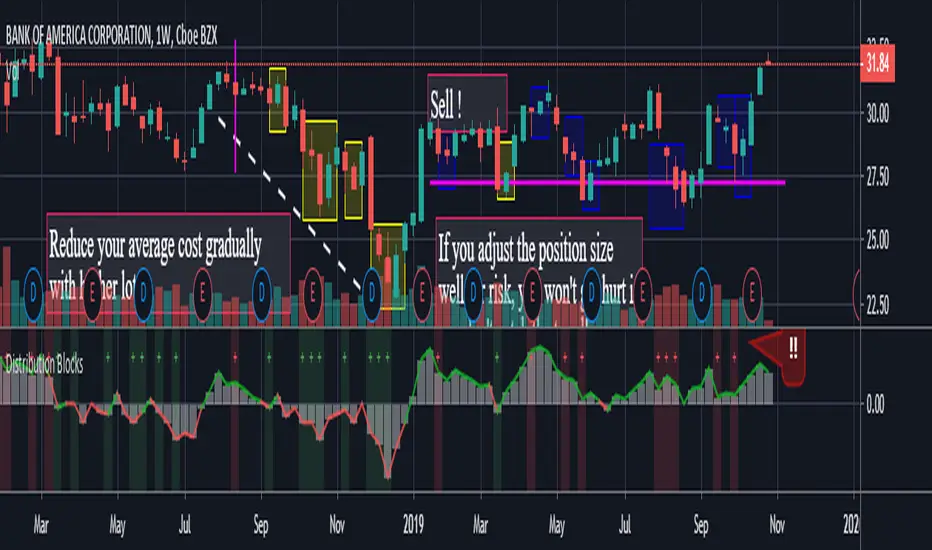
Distribution BlocksThis idea has been created by the combination of the two existing systems as a result of my efforts to create a distributional buying and selling guide that has plagued my head for a long time.
1st idea is Accumulation / Distribution Line :
2nd idea is Distribution Day :
These two ideas, the intellectual assistance of professional brokers, and my observations of cot data played a role in the formation of this idea.
Let's start.
No matter how often we divide our risk, both our minds are not comfortable and our capital may end at any moment, and if we do not use professional systems, our chances of success are 50 percent.
If we take this system as an aid to our classic systems, we can determine the amount of risk with those predictions and gradually trade.
If we don't use leverage and we have a little predictive ability, our chances of success go above 50 percent.
But for the first time, we can keep our first lot very low and increase the number of positions in the same order of orders (example: buy and buy and buy).
If we keep the first amount low, the folds won't hurt us.
When we catch up with the trend, purchases with larger position sizes than lower prices lower our average price, so that we can make a good profit when the rising trend starts.
By accepting the zone changes as the reset point just like in the martingale system, we enter the folds in the new zone with our first lot weight.
Although we cannot catch the trend, we determine the stoploss level by adding the first point we entered or the first point we entered and the commission cost.
In fact, this method is the method of buying and selling very large traders and producers, banks, pro-brokers, hedge funds and in other words the new popular phrase "whales".
Because if he trades otherwise, he cannot find buyers because his goods are too big.
I like the comfort of mind in this way.
Finally, your methods separating the negative and positive regions (macd, rsi, interpretation observation etc.)
the stronger you are, the higher your success rate.
I think the Accumulation Distribution method is very successful, but it can be adjusted for the period.
I can't wait to integrate my relativity system on this.
And when my deep learning series is over, I will integrate them on ANN series and share them publicly.
To start with, I can say briefly.
If your capital is 100:
(first lot + (increase multiplier * first lot) + (increase multiplier * increase multiplier * first lot) + .....) = 100
I tell you that you can have the same position in this series 10 - 15 times,
this will help you decide how small a position size is to be used as the starting rate and choose a low increment multiplier!
I think that this idea cannot be converted into strategy, because when our expectations come true, we may want to free all positions and start again.And I think that's better.
And in sudden movements and developments we take action with different expectations.
I'm going to talk about this script's calculations and profits on educational ideas.
Regards , Noldo.
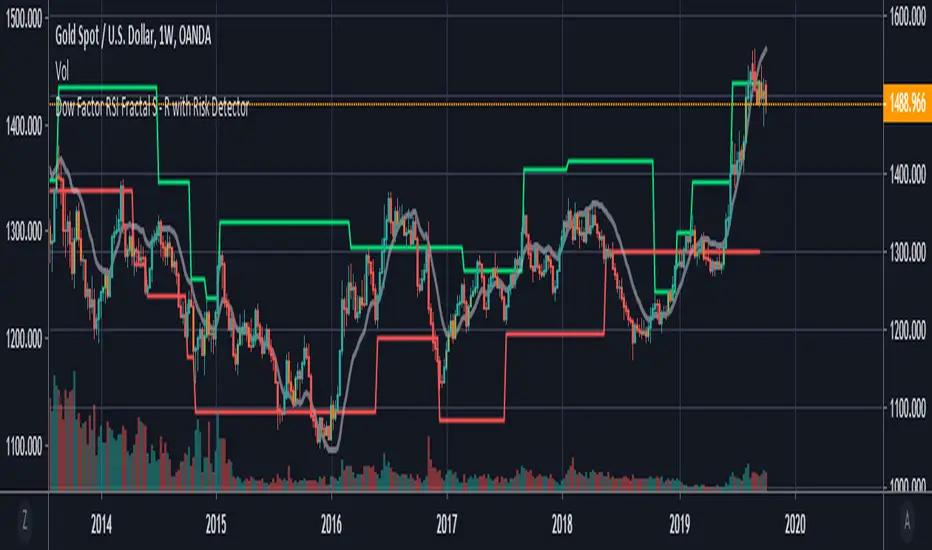
Dow Factor RSI Fractals with Risk Detector
This script is only the fact that the fractals are set according to my Dow Factor RSI .
Bar color and background change where risk factor is high.
You can turn it off or on from the menu.
I'm not licensing because "fractal support and resistances" are not my own codes.
The rest are my own products.
For more information about the Dow Factor RSI:
For more information on the DVOG Risk Detector:
For information about Dependent Variable Odd Generator :
To see the script in a storm theme with Quadruple Exponential Moving Averages:
Best wishes.
Dependent Variable Odd Generator Risk Detector
In fact, I wrote this script for detect Bollinger and Linear Regression Bands squeeze.
It's a side script.
Logic works like this:
Only the stagnant market probability is drawn from the Bollinger bandwidth by Dependent Variable Odd Generator and MFI index is calculated taking into account the volume.
This value ranges from 0 to 100.
To be sure, this value is averaged over a small period.
If you break the average and exceed 50, the bollinger band is too narrow and the risk is too high.
This means more commissions, more transactions, and vain work.
Or, when in position, the warning is not ignored due to unnecessary signals.
This code is open source under the MIT license. If you have any improvements or corrections to suggest, please send me a pull request via the github repository github.com
Stay tuned , best regards.

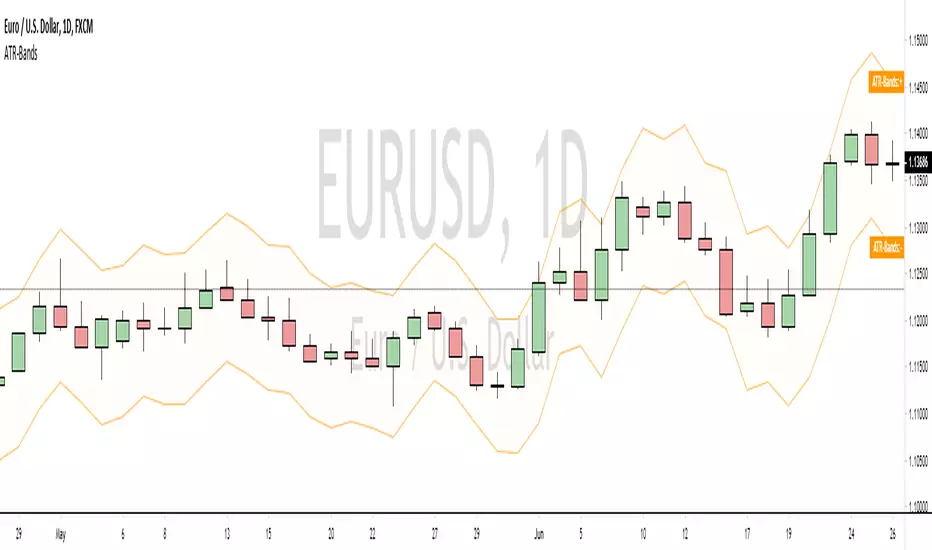
Average True Range BandsThis is a simple script to assist you in manual backtesting! Perfect for the NNFX crowd or anyone that enjoys manual backtesting.
Usage
1. Slap this bad boy on your chart.
2. Adjust period and multiplier (defaults are 14 period and 1.5x).
3. Put on the indicator/system you are testing.
4. Enter bar replay mode.
5. Drag your long/short position take profit and stop loss to the upper and lower bands.
(long/short positions are available on the left-hand toolbar)
6. Profit!
If you enjoy/use this script, drop me a follow and please note me in your code!
I'm *almost* always available for collabs and questions.
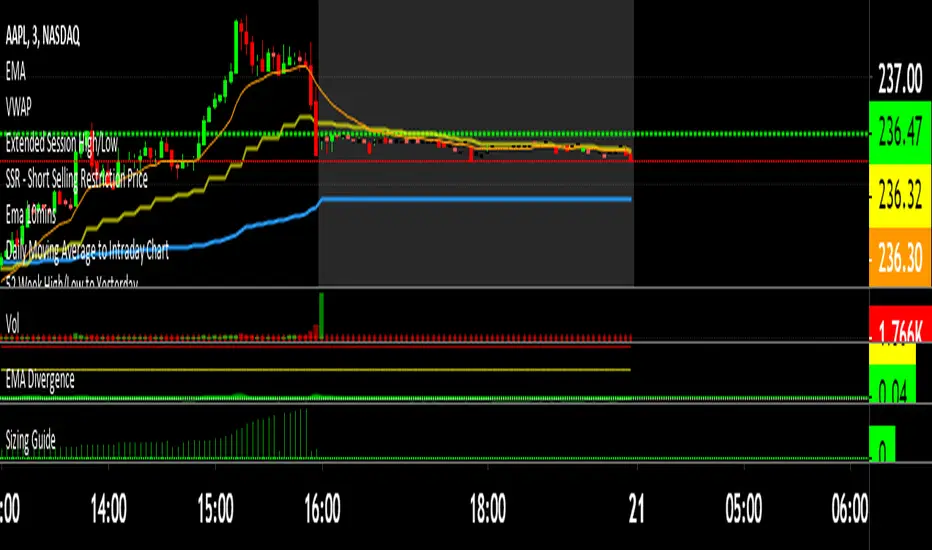
Sizing GuideThis indicator helps you defining your max sizing, depending on the max $$$ amount you're willing to risk against a specific exponential moving average (or VWAP, default is the 13ema).
You can define your max risk amount and your max allowed sizing. The indicator would suggest the best sizing in order to risk only up to the amount you are comfortable with on a potential trade.
Moreover, the column bar would turn yellow/red if the divergence is above a certain threshold (default are yellow > 1.50% and red > 2.75%, green otherwise).
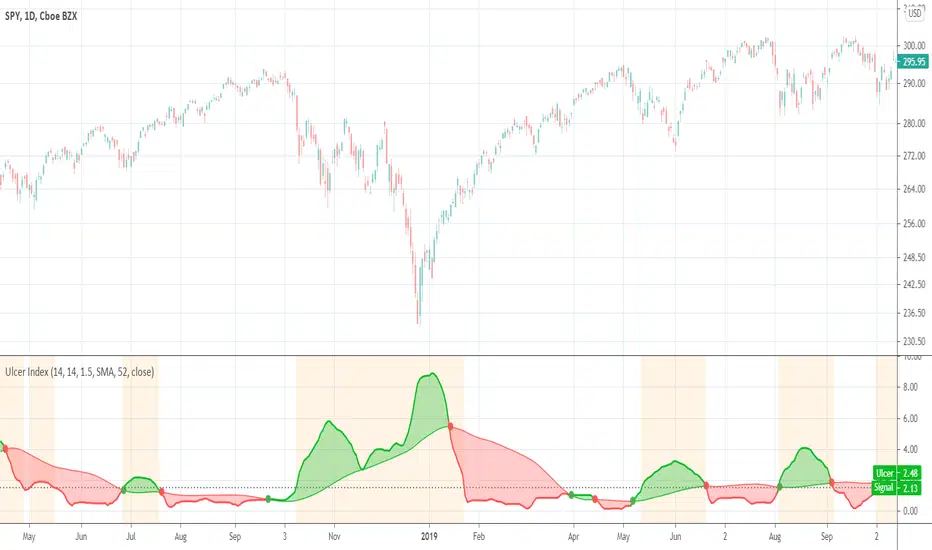
Ulcer IndexThis indicator was described by Peter G. Martin and Byron B. McCann in their book "The Investor's Guide to Fidelity Funds" (1989).
Order Size CalculatorScript to calculate the amount of stocks for of an order in relation to depot size (money), risk awareness, profit target and ATR
Volume (D)EMAA simple yet configurable indicator that shows recent traffic volumes.
The time period is specified as weeks/days/hours/minutes, not as bars.
Set the volume period to non-zero if you want to use a generalized double EMA instead of plain.
The "ratio" option will show the size of the current volume compared to the average volume as computed for the specified time period; say hello to fat tails and goodby to "standard" and "normal" and "average". With the "together" option, it compares the current volume to the both sides together (buy+sell), otherwise it compares it to just its respective side.

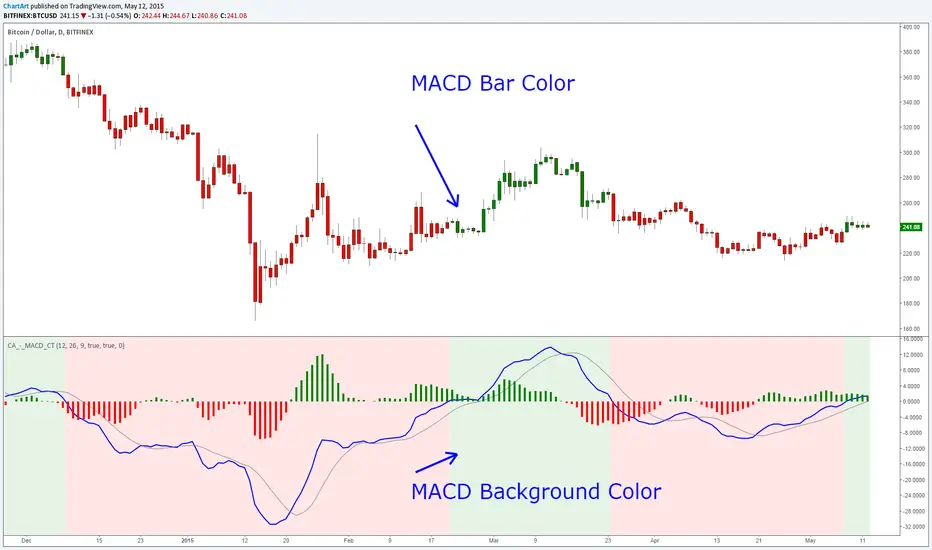
MACD Color Trawler (by ChartArt)This version of the MACD indicator is 'trawling' (checking) if the MACD histogram and the zero line crossing with the MACD line are both positive or negative. The idea behind this is to show areas with higher or lower risk.
Features:
1. Enable the bar color
2. Enable the background color
3. Change zero line value
FYI:
"The MACD-Histogram is an indicator of an indicator. In fact, MACD is also an indicator of an indicator. This means that the MACD-Histogram is the fourth derivative of price."
First derivative: 12-day EMA and 26-day EMA
Second derivative: MACD (12-day EMA less the 26-day EMA)
Third derivative: MACD signal line (9-day EMA of MACD)
Fourth derivative: MACD-Histogram (MACD less MACD signal line)
Source: stockcharts.com