• Products
  • Community
  • Markets
  • Brokers
  • More
Get started
  • Community
  • /Indicators and strategies
  • /Rsi_bands

Rsi_bands

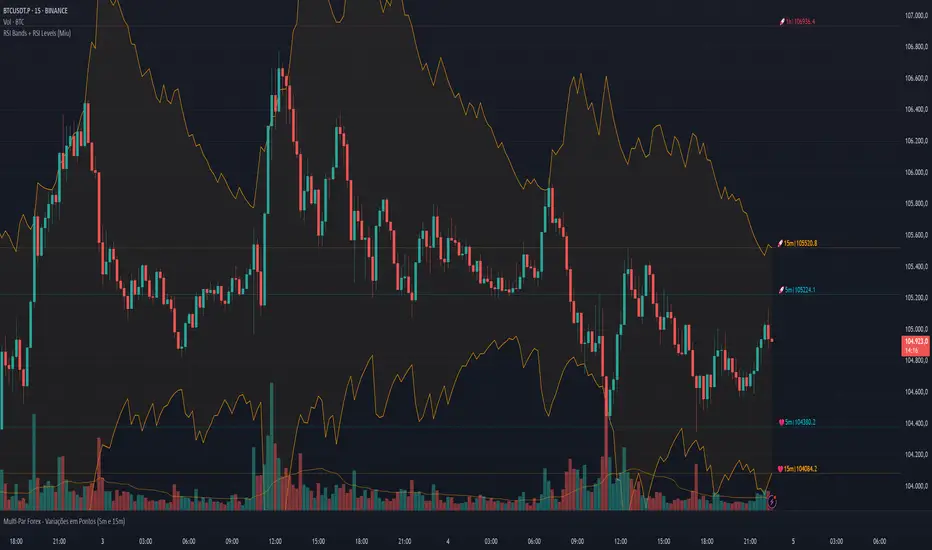
RSI Bands + Levels (Miu)This indicator was designed to plot lines from prices of overbought (OB) and oversold (OS) RSI levels in chart. It will also create a visible band between these levels. It's main utility is to show in chart current and past prices for OB/OS RSI levels. Traditionally the RSI is considered overbought when above 70 and oversold when below 30 but you can customize these values in settings. The RSI oscillates between zero and 100. Users can easily identify overbought and oversold prices using this indicator and then it is expected to help users to make better strategic decisions with their trades. There are some extra options available in settings: - Customizable RSI levels - Customizable RSI length - RSI Levels: if activated, it will draw lines above OB line and below OS line according to the multiplier, so it will plot sequential lines that goes in different RSI levels (e.g: RSI 72, 74, 76, 78 and 80). - Backgroud only: it will remove these lines and keep only a backgroung color instead - RSI 50: it will draw a line as RSI 50 - Customizable multiplier Enjoy!
Pine Script® indicator
by fabianomiu
Updated

Select market data provided by ICE Data services. Select reference data provided by FactSet. Copyright © 2025 FactSet Research Systems Inc.© 2025 TradingView, Inc.

More than a product
  • Supercharts
Screeners
  • Stocks
  • ETFs
  • Bonds
  • Crypto coins
  • CEX pairs
  • DEX pairs
  • Pine
Heatmaps
  • Stocks
  • ETFs
  • Crypto
Calendars
  • Economic
  • Earnings
  • Dividends
More products
  • Yield curves
  • Options
  • News Flow
  • Pine Script®
Apps
  • Mobile
  • Desktop
Community
  • Social network
  • Wall of Love
  • Refer a friend
  • House Rules
  • Moderators
Ideas
  • Trading
  • Education
  • Editors' picks
Pine Script
  • Indicators & strategies
  • Wizards
  • Freelancers
Tools & subscriptions
  • Features
  • Pricing
  • Market data
Trading
  • Overview
  • Brokers
Special offers
  • CME Group futures
  • Eurex futures
  • US stocks bundle
About company
  • Who we are
  • Manifesto
  • Athletes
  • Blog
  • Careers
  • Media kit
Merch
  • TradingView store
  • Tarot cards for traders
  • The C63 TradeTime
Policies & security
  • Terms of Use
  • Disclaimer
  • Privacy Policy
  • Cookies Policy
  • Accessibility Statement
  • Security vulnerability
  • Status page
Business solutions
  • Widgets
  • Charting libraries
  • Lightweight Charts™
  • Advanced Charts
  • Trading Platform
Growth opportunities
  • Advertising
  • Brokerage integration
  • Partner program
  • Education program
Community
  • Social network
  • Wall of Love
  • Refer a friend
  • House Rules
  • Moderators
Ideas
  • Trading
  • Education
  • Editors' picks
Pine Script
  • Indicators & strategies
  • Wizards
  • Freelancers
Business solutions
  • Widgets
  • Charting libraries
  • Lightweight Charts™
  • Advanced Charts
  • Trading Platform
Growth opportunities
  • Advertising
  • Brokerage integration
  • Partner program
  • Education program
Look FirstLook First