RSI-EMA-Crossing with Donchian-Stop-LossThe Donchian RSI Indicator is a visual tool that combines momentum and trend analysis to identify high-quality long opportunities based on RSI crossovers, price action, and Donchian channel dynamics.
How It Works
Momentum Signal: A bullish RSI crossover is detected when the RSI crosses above its moving average.
Trend Filter: A signal is only valid if the crossover occurs while the price is above its moving average – filtering out entries against the prevailing trend.
Signal Candle: The high of the crossover candle is stored.
Entry Trigger: A valid signal occurs when a later candle closes above that signal high.
Stop-Loss (Visual Only)
The lower band of the Donchian Channel acts as a visual reference for a dynamic stop-loss level.
Features
Customizable RSI, Donchian Channel, and moving average lengths
Selectable MA types: SMA, EMA, WMA, VWMA, HMA
Signal candle highlighted (yellow background)
Entry points labeled on the chart
Price MA and Donchian Channel plotted
Trend filter improves signal quality by confirming upward bias
Use Case
Designed for swing and position traders
Optimized for use on daily or 4H charts
Rsicrossover

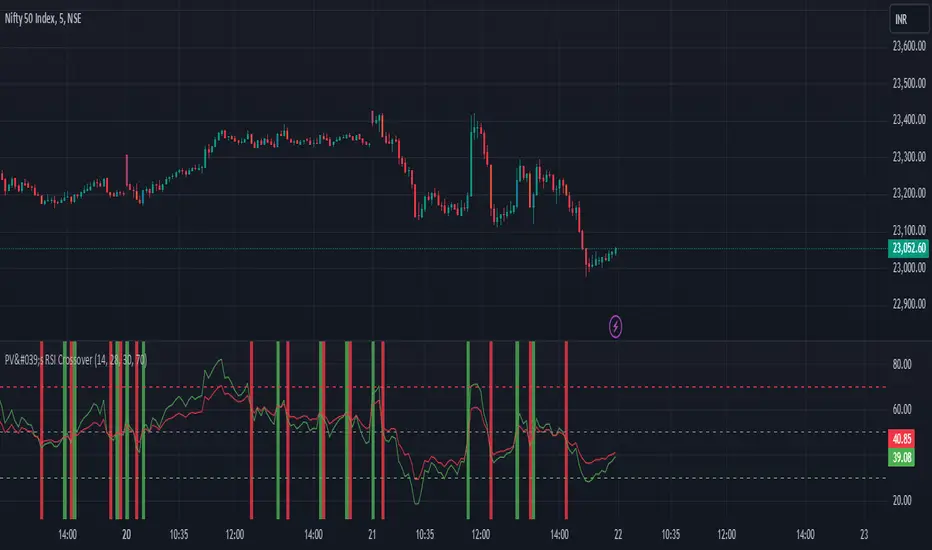
PV's Dual RSI Crossover StrategyIntroduction to the Dual RSI Two-Cross Indicator
The Relative Strength Index (RSI) is a widely used technical indicator in finance that measures the magnitude of recent price changes to determine overbought or oversold conditions. The RSI Two-Cross indicator takes this concept a step further by introducing a unique twist: it plots two RSI lines with different lengths and generates alerts based on their crossovers.
Key Features:
Dual RSI Lines: The indicator plots two RSI lines with user-defined lengths, allowing traders to compare the short-term and long-term momentum of an asset.
Crossover Alerts: The indicator generates alerts when the shorter RSI line crosses above or below the longer RSI line, indicating potential trend reversals or continuations.
Customizable Parameters: Users can adjust the lengths of the RSI lines, oversold and overbought levels, and other parameters to suit their trading strategy and asset of choice.
Visual Aids: The indicator features colored bars and backgrounds to highlight crossover events, making it easy to identify trading opportunities at a glance.
Trading Applications:
Trend Reversal Detection: The RSI Two-Cross indicator can help traders identify potential trend reversals by monitoring crossovers between the two RSI lines.
Momentum Confirmation: The indicator can be used to confirm momentum shifts in an asset's price, helping traders to filter out false signals and make more informed trading decisions.
Scalping and Day Trading: The indicator's short-term focus makes it suitable for scalping and day trading strategies, where traders aim to capitalize on small price movements.
By combining the versatility of the RSI with the power of crossover analysis, the RSI Two-Cross indicator offers a unique perspective on market momentum and trend dynamics. Whether you're a seasoned trader or just starting out, this indicator can help you navigate the markets with greater confidence and precision.
RSI BB StdDev SignalOverview
The RSI BB StdDev Signal Indicator is a powerful tool designed to enhance your trading strategy by combining the Relative Strength Index (RSI) with Bollinger Bands (BB). This unique combination allows traders to identify potential buy and sell signals more accurately by leveraging the strengths of both indicators. The RSI helps in identifying overbought and oversold conditions, while the Bollinger Bands provide a dynamic range to assess volatility and potential price reversals.
Key Features
— RSI Calculation: The indicator calculates the RSI based on user-defined parameters, allowing for customization to fit different trading styles.
— Bollinger Bands Integration: The RSI values are smoothed using a moving average, and Bollinger Bands are applied to this smoothed RSI to generate buy and sell signals.
— Divergence Detection: The indicator includes an optional feature to detect and alert on bullish and bearish divergences between the RSI and price action.
— Customizable Alerts: Users can set up alerts for buy and sell signals, as well as for divergences, ensuring they never miss a trading opportunity.
— Visual Aids: The indicator plots the RSI, Bollinger Bands, and signals on the chart, making it easy to visualize and interpret the data.
How It Works
1. RSI Calculation:
— The RSI is calculated using the change in the source input (default is close price) over a specified period.
— The RSI values are then plotted on the chart with customizable overbought and oversold levels.
2. Smoothing and Bollinger Bands:
— The RSI values are smoothed using a moving average (SMA, EMA, SMMA, WMA, VWMA) selected by the user.
— Bollinger Bands are applied to the smoothed RSI to create dynamic upper and lower bands.
3. Signal Generation:
—Buy signals are generated when the RSI crosses above the lower Bollinger Band.
—Sell signals are generated when the RSI crosses below the upper Bollinger Band.
—These signals are plotted on both the RSI pane and the main price chart for easy reference.
4. Divergence Detection:
— The indicator can detect and alert on regular bullish and bearish divergences between the RSI and price action.
— Bullish divergences occur when the price makes a lower low, but the RSI makes a higher low.
— Bearish divergences occur when the price makes a higher high, but the RSI makes a lower high.
Usage
1. Setting Up:
— Add the indicator to your TradingView chart.
— Customize the RSI length, source, and other parameters in the settings panel.
— Enable or disable the divergence detection based on your trading strategy.
2. Interpreting Signals:
— Use the buy and sell signals generated by the RSI crossing the Bollinger Bands as potential entry and exit points.
— Pay attention to divergences for additional confirmation of trend reversals.
3. Alerts:
— Set up alerts for buy and sell signals to receive notifications in real-time.
— Enable divergence alerts to be notified of potential trend reversals.
Conclusion
The RSI BB StdDev Signal Indicator is a comprehensive tool that combines the strengths of the RSI and Bollinger Bands to provide traders with more accurate and reliable signals. Whether you are a beginner or an experienced trader, this indicator can enhance your trading strategy by offering clear visual cues and customizable alerts.
Note
This indicator is provided with open-source code, allowing users to understand its logic and customize it further if needed. The detailed description and customizable settings ensure that traders of all levels can benefit from its unique features.

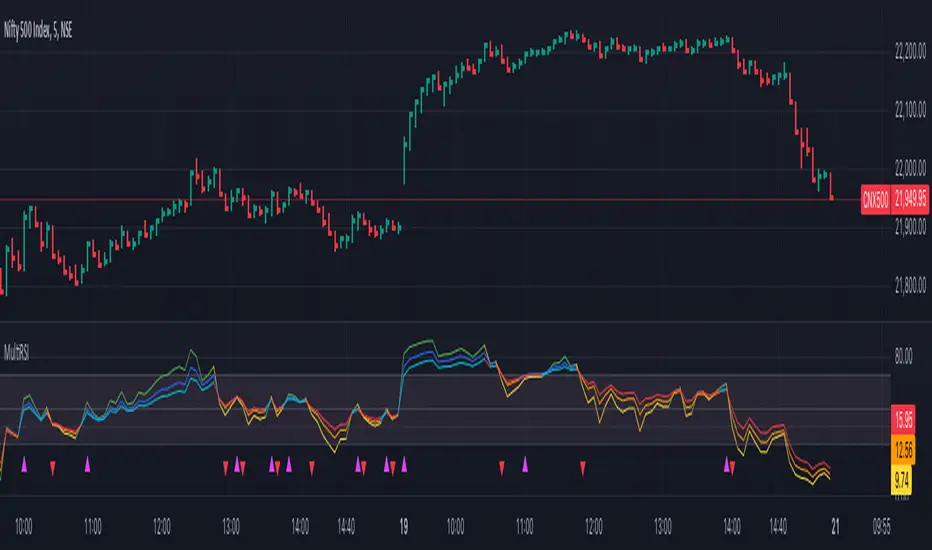
Multiple RSITitle: MultiRSI: A Versatile Multi-Timeframe RSI Indicator
Short Description:
A powerful RSI-based indicator that incorporates three RSI lengths (Fast, Medium, and Slow) to help traders analyze trends, momentum, and potential reversals with clear visual signals.
Full Description:
Overview:
The MultiRSI script provides traders with a dynamic tool to assess market conditions across multiple RSI timeframes. It calculates Fast, Medium, and Slow RSI values, assigns meaningful colors based on trend analysis, and highlights key crossover points for actionable insights.
Key Features:
Triple RSI Display:
Fast RSI (default: 8): Ideal for capturing short-term momentum.
Medium RSI (default: 12): Provides a balanced perspective.
Slow RSI (default: 16): Helps identify longer-term trends.
Trend Analysis:
Color-coded RSI lines:
Green, blue, and aqua for uptrends.
Yellow, orange, and red for potential downtrends.
Visual differentiation for easy interpretation.
Crossover Signals:
Upward Cross (triangle up): Indicates potential bullish momentum.
Downward Cross (triangle down): Suggests possible bearish momentum.
Marked directly on the chart for clarity.
Customizable Inputs:
Adjust RSI lengths to suit your trading strategy.
Grouped input settings for a seamless configuration experience.
Usage Scenarios:
Identify trend strength and reversals in different timeframes.
Spot key momentum shifts with crossover signals.
Combine with other indicators for a comprehensive trading strategy.
How It Works:
The script compares the Fast RSI against the Medium RSI and the Medium RSI against the Slow RSI to determine short-, medium-, and long-term trends. Crossovers between Medium and Slow RSI values signal potential momentum shifts.
Visualization:
Clear, color-coded plots for the three RSI levels.
Highlighted crossovers for quick decision-making.
License:
This script is open-source under the Mozilla Public License 2.0. Feel free to use, modify, and share!
Scalping Strategy (5min)This indicator is designed for scalping strategies on a 5-minute timeframe. It generates signals based on two RSI crossovers and incorporates moving averages to identify trends. Additionally, a Bollinger Band is included to eliminate the need for an additional Bollinger Band on the chart.
Please note that this indicator does not guarantee 100% accurate signals and may produce false signals. It is recommended to use this indicator in conjunction with other indicators such as Stochastic, MACD, SuperTrend, or any other suitable indicators to enhance the accuracy of trading decisions.
1) Signal Generation: The indicator generates buy and sell signals based on two RSI crossovers. A buy signal is generated when the fast RSI crosses above the slow RSI, indicating potential bullish momentum. Conversely, a sell signal is generated when the fast RSI crosses below the slow RSI, suggesting potential bearish momentum.
2) To adjust the indicator to your specific chart and trading preferences, you have the flexibility to modify the RSI and moving average (MA) values. By changing the RSI values (slow RSI length and fast RSI length), you can fine-tune the sensitivity of the RSI crossovers to suit different timeframes and market conditions. Similarly, adjusting the MA values (slow MA period and fast MA period) allows you to adapt the indicator to the desired trend identification and short-term trend confirmation.
3) Pay attention to trades that are confirmed by the short-term moving average (MA) aligning with the desired direction. For buy signals, ensure that the short MA is tending upward, indicating a potential uptrend. For sell signals, confirm that the short MA is trending downward, suggesting a potential downtrend.
4) Moving Averages: The indicator uses a 200-period moving average (MA) to identify the overall trend and a short-term MA for additional confirmation.
5) Bollinger Band: The included Bollinger Band is not directly used in the indicator's calculations. However, it is provided for convenience so that users don't need to add another Bollinger Band to their chart separately.
6) Exercise caution when the short MA is below the 200-period MA but showing signs of attempting an upward move. These situations may indicate a potential reversal or consolidation, and it is advisable to avoid taking trades solely based on the 200-period MA crossover in such cases.
Remember that these guidelines are intended to provide additional insights and should be used in combination with your trading judgment and analysis.

RSI MA CrossBuilding onto the standard RSI indicator, with the following modification and improvements:
- Added signals for RSI moving average crossovers, which usually indicator a bull or bear trend
- Added option to use smoothed RSI line
- Added alert for crossover signals
Enjoy~~~!
