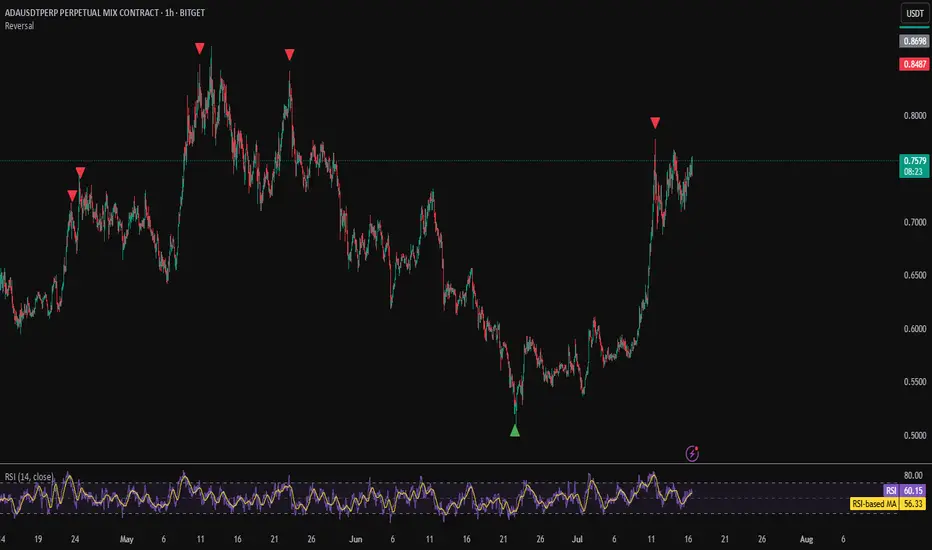
Reversal IndicatorWhat does this indicator do?
This indicator is designed to help traders spot potential reversal points in the market by combining multiple conditions:
✅ Multi-Timeframe RSI – Checks RSI on a lower timeframe (like 5m) to see if the market is oversold or overbought.
✅ Higher Timeframe SMA Filter – Uses a higher timeframe SMA (like 1h) as a trend filter, so signals only trigger in the direction of the bigger trend.
✅ Candle Pattern Confirmation – Looks for bullish or bearish engulfing candles to confirm price exhaustion before signaling a reversal.
When all these conditions align, the indicator plots a triangle under/above the candle to highlight a possible reversal.
Why is this useful?
Many traders struggle with false RSI signals or candle patterns that fail because they don’t respect the larger trend.
This indicator filters out weak setups by requiring alignment between:
A lower timeframe RSI oversold/overbought condition,
A higher timeframe trend filter (SMA),
And a strong candle reversal pattern.
This multi-layer approach helps avoid chasing every RSI dip and focuses only on high-probability reversal zones.
How does it work?
Bullish reversal signal → appears when RSI on the lower TF is oversold, price is still above the higher TF SMA (trend still intact), AND a bullish engulfing candle forms.
Bearish reversal signal → appears when RSI on the lower TF is overbought, price is below the higher TF SMA, AND a bearish engulfing candle forms.
When all conditions match, the indicator plots a triangle under the candle for bullish signals and above the candle for bearish signals.
How to use it?
Choose your timeframes:
A timeframe for trend filtering (e.g. 1h).
A timeframe for RSI (e.g. 4h).
NOTICE: THE RSI TIMEFRAME SHOULD BE GREATER THEN THE TIMEFRAME FOR THE SMA
Otherwise it will not generate that much signals.
Watch for signals ONLY in the direction of the higher trend.
Use the signals as potential reversal points, not as guaranteed entries. Combine with your own confluence.
Optionally set alerts for bullish or bearish reversal conditions so you never miss a setup.
Customization
✅ Choose your RSI length & overbought/oversold levels.
✅ Select which timeframes you want for SMA & RSI.
✅ Toggle the higher TF SMA display on/off.
✅ Adjust signal appearance (triangles).
Important Notes
⚠️ This is not a standalone trading system. It’s a tool to help spot possible reversal areas. Always confirm with price action, support/resistance, or your own strategy
Rsisignal
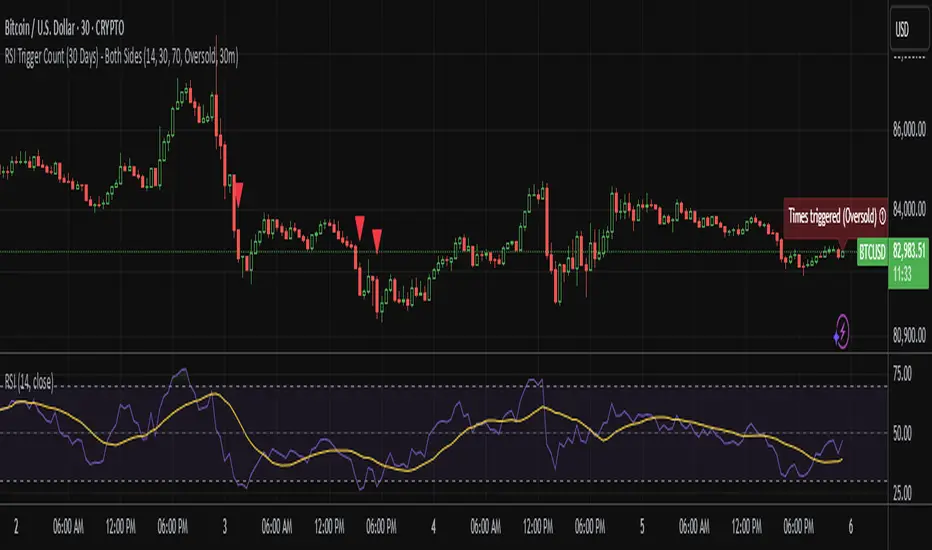
RSI Trigger Count (30 Days) - Both SidesRSI Dual Trigger Counter (30 Days)
This indicator tracks both oversold ( crossunder ) and overbought ( crossover ) RSI events on a 30-minute chart, featuring:
Dual-Mode Selector:
Counts either RSI < 30 (oversold) or RSI > 70 (overbought) crossings
Toggle between modes via input menu
30-Day Rolling Count:
Displays total triggers in the last 30 days (e.g., "Times triggered (Oversold) ① 19")
Visual Alerts:
Red triangles ↓ for oversold crossunders
Green triangles ↑ for overbought crossovers
Customizable:
Adjustable RSI length (2-100) and thresholds (1-100)
Works on any timeframe (auto-scales calculations)
Purpose: Identifies frequent reversal signals for both buying dips (oversold) and selling rallies (overbought).
RSI BB StdDev SignalOverview
The RSI BB StdDev Signal Indicator is a powerful tool designed to enhance your trading strategy by combining the Relative Strength Index (RSI) with Bollinger Bands (BB). This unique combination allows traders to identify potential buy and sell signals more accurately by leveraging the strengths of both indicators. The RSI helps in identifying overbought and oversold conditions, while the Bollinger Bands provide a dynamic range to assess volatility and potential price reversals.
Key Features
— RSI Calculation: The indicator calculates the RSI based on user-defined parameters, allowing for customization to fit different trading styles.
— Bollinger Bands Integration: The RSI values are smoothed using a moving average, and Bollinger Bands are applied to this smoothed RSI to generate buy and sell signals.
— Divergence Detection: The indicator includes an optional feature to detect and alert on bullish and bearish divergences between the RSI and price action.
— Customizable Alerts: Users can set up alerts for buy and sell signals, as well as for divergences, ensuring they never miss a trading opportunity.
— Visual Aids: The indicator plots the RSI, Bollinger Bands, and signals on the chart, making it easy to visualize and interpret the data.
How It Works
1. RSI Calculation:
— The RSI is calculated using the change in the source input (default is close price) over a specified period.
— The RSI values are then plotted on the chart with customizable overbought and oversold levels.
2. Smoothing and Bollinger Bands:
— The RSI values are smoothed using a moving average (SMA, EMA, SMMA, WMA, VWMA) selected by the user.
— Bollinger Bands are applied to the smoothed RSI to create dynamic upper and lower bands.
3. Signal Generation:
—Buy signals are generated when the RSI crosses above the lower Bollinger Band.
—Sell signals are generated when the RSI crosses below the upper Bollinger Band.
—These signals are plotted on both the RSI pane and the main price chart for easy reference.
4. Divergence Detection:
— The indicator can detect and alert on regular bullish and bearish divergences between the RSI and price action.
— Bullish divergences occur when the price makes a lower low, but the RSI makes a higher low.
— Bearish divergences occur when the price makes a higher high, but the RSI makes a lower high.
Usage
1. Setting Up:
— Add the indicator to your TradingView chart.
— Customize the RSI length, source, and other parameters in the settings panel.
— Enable or disable the divergence detection based on your trading strategy.
2. Interpreting Signals:
— Use the buy and sell signals generated by the RSI crossing the Bollinger Bands as potential entry and exit points.
— Pay attention to divergences for additional confirmation of trend reversals.
3. Alerts:
— Set up alerts for buy and sell signals to receive notifications in real-time.
— Enable divergence alerts to be notified of potential trend reversals.
Conclusion
The RSI BB StdDev Signal Indicator is a comprehensive tool that combines the strengths of the RSI and Bollinger Bands to provide traders with more accurate and reliable signals. Whether you are a beginner or an experienced trader, this indicator can enhance your trading strategy by offering clear visual cues and customizable alerts.
Note
This indicator is provided with open-source code, allowing users to understand its logic and customize it further if needed. The detailed description and customizable settings ensure that traders of all levels can benefit from its unique features.
