EMA 10,20 SMA 50, 200This indicator is very helpful for swing traders who plan their trades using EMAs and SMAs. It is used on the daily chart and displays the 10- and 20-EMA, as well as the 50- and 200-SMA.
Simple Moving Average (SMA)
Multi Averages - CustomizableThis script adds up to 5 moving averages to your plot!
Both type and length are customizable.
Multi EMA & SMA IndicatorDraws EMA 5/20/50/100 and SMA 200 in different colors and thickness in a single indicator

3x Multi EMA/SMA ColoredThis is a Multi-Colored EMA/SMA Script with 3 ema's that can be toggled on/off and 3 sma's that can be toggled on/off.
Giving you more visibility where price is actually going using 3 ema's at the same time or 3 sma's at the same time allowing you to change the colors when Bearish or Bullish.

Adjustable Percentage Range Moving Average - Add'l LinesThe Adjustable Percentage Range Moving Average (APRMA), originally developed by @ReallyWendy, is a versatile PineScript indicator designed for traders and market analysts to analyze market volatility and identify trends dynamically. Building on the original concept, this updated version plots a central moving average (MA) with four customizable percentage-based range bands around it. Users can select the MA type (SMA, EMA, HMA, RMA, SWMA, TMA, WMA, VWMA), timeframe, and length, tailoring the indicator to their trading style. Each range band (upper and lower) is calculated as a percentage offset from the MA, with adjustable colors and transparency settings for enhanced visual clarity. Extension lines project the latest values forward, with customizable styles (solid, dashed, dotted). The indicator includes toggleable display options for the MA and each range pair, making it an effective tool for identifying price ranges, support/resistance levels, and trend dynamics.
Credit to @ReallyWendy for the foundational concept.
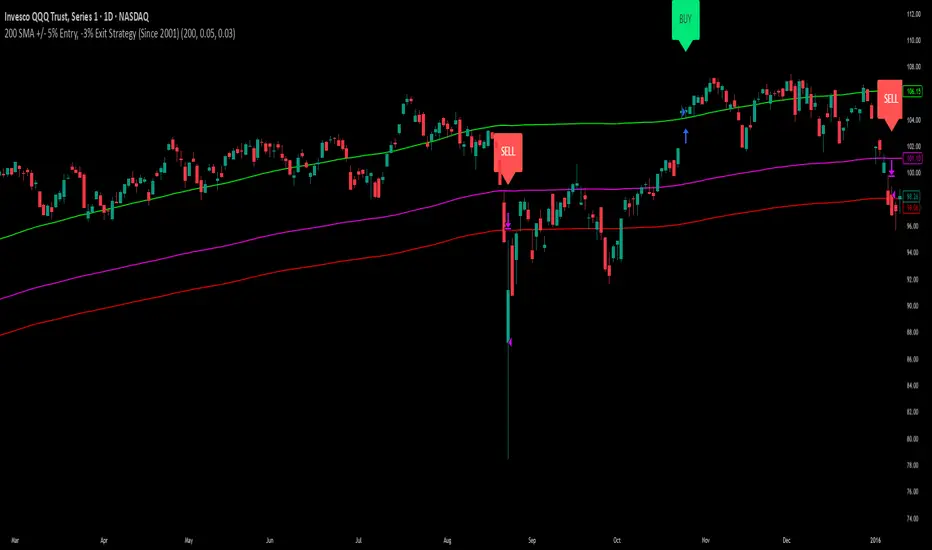
200 SMA (5%/-3% Buffer) for SPY & QQQ In my testing TQQQ is an absolute monster of an ETF that performs extremely well even from a buy and hold standpoint over long periods of time, its largest drawback is the massive drawdown exposure that it faces which can be easily sidestepped with this strategy.
This strategy is meant to basically abuse TQQQ's insane outperformance while augmenting the typical 200SMA strategy in a way that uses all of its strengths while avoiding getting whipsawed in sideways markets.
The strategy BUYS when price crosses 5% over the 200SMA and then SELLS when price drops 3% below the 200SMA. Between trades I'll be parking my entire account in SGOV.
So maximizing profit while minimizing risk.
You use the strategy based off of QQQ and then make the trades on TQQQ when it tells you to BUY/SELL.
Here are some reasons why I will be using this strategy:
Simple emotionless BUY and SELL signals where I don't care who the president is, what is happening in the world, who is bombing who, who the leadership team is, no attachment to individual companies and diversified across the NASDAQ.
~85% win percentage and when it does lose the loses are nothing compared to the wins and after a loss you're basically set up for a massive win in the next trade.
Max drawdown of around 53% when using TQQQ
You benefit massively when the market is doing well and when there is a recession you basically sit in SGOV for a year and then are set up for a monster recovery with a clear easy BUY signal. So as long as you're patient you win regardless of what happens.
The trades are often very long term resulting in you taking advantage of Long Term Capital Gains tax advantage which could mean saving up to 15-20% in taxes.
With only a few trades you can spend time doing other stuff and don't have to track or pay attention to anything that is happening.
Simple, easy, and massively profitable.
NAIFCHART_NAS Ultimate Algo | Remastered+# NAIFCHART NAS Ultimate Algo Remastered+: Advanced Trend Following System
## Overview
The NAIFCHART NAS Ultimate Algo Remastered+ represents a sophisticated trend-following system that combines Supertrend analysis with multiple moving average confirmations. This comprehensive indicator was developed and shared by the trading community at t.me designed specifically for identifying high-probability trend continuation and reversal opportunities.
## Core Algorithm Components
**Supertrend Foundation**: The primary signal generation relies on a customizable Supertrend indicator with adjustable sensitivity (1-20 range). This adaptive trend-following tool uses Average True Range calculations to establish dynamic support and resistance levels that respond to market volatility.
**SMA Confirmation Matrix**: Multiple Simple Moving Averages (SMA 4, 5, 9, 13) provide layered confirmation for signal strength. The algorithm distinguishes between regular signals and "Strong" signals based on SMA 4 vs SMA 5 relationship, offering traders different conviction levels for position sizing.
**Trend Ribbon Visualization**: SMA 21 and SMA 34 create a visual trend ribbon that changes color based on their relationship. Green ribbon indicates bullish momentum while red signals bearish conditions, providing immediate visual trend context.
**RSI-Based Candle Coloring**: Advanced 61-tier RSI system colors candles with gradient precision from deep red (RSI ≤20) through purple transitions to bright green (RSI ≥79). This visual enhancement helps traders instantly assess momentum strength and overbought/oversold conditions.
## Signal Generation Logic
**Buy Signal Criteria**:
- Price crosses above Supertrend line
- Close price must be above SMA 9 (trend confirmation)
- Signal strength determined by SMA 4 vs SMA 5 relationship
- "Strong Buy" when SMA 4 ≥ SMA 5
- Regular "Buy" when SMA 4 < SMA 5
**Sell Signal Criteria**:
- Price crosses below Supertrend line
- Close price must be below SMA 9 (trend confirmation)
- Signal strength based on SMA relationship
- "Strong Sell" when SMA 4 ≤ SMA 5
- Regular "Sell" when SMA 4 > SMA 5
## Advanced Risk Management System
**Automated TP/SL Calculation**: The indicator automatically calculates stop loss and take profit levels using ATR-based measurements. Risk percentage and ATR length are fully customizable, allowing traders to adapt to different market conditions and personal risk tolerance.
**Multiple Take Profit Targets**:
- 1:1 Risk-Reward ratio for conservative profit taking
- 2:1 Risk-Reward for balanced trade management
- 3:1 Risk-Reward for maximum profit potential
**Visual Risk Display**: All risk management levels appear as both labels and optional trend lines on the chart. Customizable line styles (solid, dashed, dotted) and positioning ensure clear visualization without chart clutter.
**Dynamic Level Updates**: Risk levels automatically recalculate with each new signal, maintaining current market relevance throughout position lifecycles.
## Visual Enhancement Features
**Customizable Display Options**: Toggle trend ribbon, TP/SL levels, and risk lines independently. Decimal precision adjustments (1-8 decimal places) accommodate different instrument price formats and personal preferences.
**Professional Label System**: Clean, informative labels show entry points, stop losses, and take profit targets with precise price levels. Labels automatically position themselves for optimal chart readability.
**Color-Coded Momentum**: The gradient RSI candle coloring system provides instant visual feedback on momentum strength, helping traders assess market energy and potential reversal zones.
## Implementation Strategy
**Timeframe Optimization**: The algorithm performs effectively across multiple timeframes, with higher timeframes (4H, Daily) providing more reliable signals for swing trading. Lower timeframes work well for day trading with appropriate risk adjustments.
**Sensitivity Adjustment**: Lower sensitivity values (1-5) generate fewer but higher-quality signals, ideal for conservative approaches. Higher sensitivity (15-20) increases signal frequency for active trading styles.
**Risk Management Integration**: Use the automated risk calculations as baseline parameters, adjusting risk percentage based on account size and market conditions. The 1:1, 2:1, 3:1 targets enable systematic profit-taking strategies.
## Market Application
**Trend Following Excellence**: Primary strength lies in capturing significant trend movements through the Supertrend foundation with SMA confirmation. The dual-layer approach reduces false signals common in single-indicator systems.
**Momentum Assessment**: RSI-based candle coloring provides immediate momentum context, helping traders assess signal strength and potential continuation probability.
**Range Detection**: The trend ribbon helps identify ranging conditions when SMA 21 and SMA 34 converge, alerting traders to potential breakout opportunities.
## Performance Optimization
**Signal Quality**: The requirement for both Supertrend crossover AND SMA 9 confirmation significantly improves signal reliability compared to basic trend-following approaches.
**Visual Clarity**: The comprehensive visual system enables rapid market assessment without complex calculations, ideal for traders managing multiple instruments.
**Adaptability**: Extensive customization options allow fine-tuning for specific markets, trading styles, and risk preferences while maintaining the core algorithm integrity.
## Community Resources
Join the active trading community at t.me for ongoing discussions about optimization techniques, market analysis, and strategy refinements using this advanced algorithm system.
The collaborative environment provides valuable insights into parameter adjustments for different market conditions and real-world performance feedback from experienced traders.
## Conclusion
The NAIFCHART NAS Ultimate Algo Remastered+ combines proven trend-following principles with modern visual enhancements and comprehensive risk management. The algorithm's strength lies in its multi-layered confirmation approach and automated risk calculations, providing both novice and experienced traders with clear signals and systematic trade management.
Success with this system requires understanding the relationship between signal strength indicators and adapting sensitivity settings to match current market conditions. The comprehensive visual feedback system enables rapid decision-making while the automated risk management ensures consistent trade parameters.
Practice with different sensitivity settings and timeframes to optimize performance for your specific trading style and risk tolerance. The algorithm's systematic approach provides excellent framework for disciplined trend-following strategies across various market environments.

RSI SMA 7 Signal Strategy (No 50 Level)Script uses SMA 7 Perio and 14 Period RSI
If SMA crosses 40 RSI level from below consider it a buy zone or buy signal, if SMA crosses from below 60 RSI level, then super bullish, IF SMA crosses 60 RSI level from above its a profit taking time and Sell zone, if SMA crosses 40 level from above then super bearish sell signal.

Breakout Range Signal with Quality Analysis [Dova Lazarus]📌 Breakout Range Signal with Quality Analysis
🎓 Training-focused indicator for breakout logic, SL & TP behavior and signal quality assessment
🔷 PURPOSE
This tool identifies breakout candles from a calculated channel range and visually simulates entries, stop losses, and take profits, providing live and historical performance metrics.
⚙️ MAIN SETTINGS
1️⃣ Channel Setup
channel_length = 10 → how many candles are averaged to form channel boundaries
channel_multiplier = 0.0 → adds expansion above/below the base channel
channel_smoothing_type = SMA → smoothing method for high/low averaging
📊 The channel consists of two moving averages: one from highs, the other from lows. When expanded (via multiplier), it creates a buffer range for breakout validation.
2️⃣ Signal Detection
Body > Channel % = 50 → a breakout candle's body must exceed 150% of the channel width
Signal Mode:
• Weak → every valid breakout candle is highlighted
• Strong → only the first signal in a sequence is shown (helps reduce noise)
🟦 Bullish signals (blue):
• Candle opens inside the channel
• Closes above the channel
• Body is large enough
• Optional: confirms with trend (if enabled)
🟨 Bearish signals (yellow):
• Candle opens inside the channel
• Closes below the channel
• Body is large enough
• Optional: confirms with trend
3️⃣ Trend Filter (optional)
Enabled via checkbox
Uses a higher timeframe MA to filter signals
Bullish signals are allowed only if price is below the trend MA
Bearish signals only if price is above it
⏱️ trend_timeframe = 1D (typically set higher than the chart's timeframe)
🟢 Trend line is plotted if enabled
🎯 ENTRY, STOP LOSS & TAKE PROFIT LOGIC
SL and TP are based on channel width, not fixed pip/tick size:
📍 Entry Price = close of the breakout candle
🛑 Stop Loss:
• Bullish → below the lower channel border (minus offset)
• Bearish → above the upper channel border (plus offset)
🎯 Take Profit:
• Bullish → entry + channel width × profit multiplier
• Bearish → entry − channel width × profit multiplier
You can control:
Profit Target Multiplier (e.g., 1.0 → TP = 1×channel width)
Stop Loss Target Multiplier (e.g., 0.5 → SL = 0.5×channel width)
Signals to Show = how many historical SL/TP setups to display
📈 Lines and labels ("TP", "SL") are drawn on the chart for clarity.
🧪 QUALITY ANALYSIS MODULE
If enabled, the indicator will:
Track each new signal (entry, SL, TP)
Analyze outcomes:
• Win = TP hit before SL
• Loss = SL hit before TP
• Expired = signal unresolved after N bars
Display statistics in a table (top-right corner):
📋 Table fields:
✅ Overall win rate
📈 Bullish win rate
📉 Bearish win rate
🔢 Total signals
🕓 Pending (still active trades)
Maximum bars to wait for outcome is customizable (max_bars_to_analyze).
📐 VISUALIZATION TOOLS
TP / SL lines per signal
Labels “TP” and “SL”
Optional channel lines and trendline for better context
Colored bars for valid signals (blue/yellow)
📌 BEST USE CASES
Understand how breakout signals are formed
Learn SL/TP logic based on dynamic range
Test how volatility affects trade outcomes
Use as a visual simulation of trade behavior over time

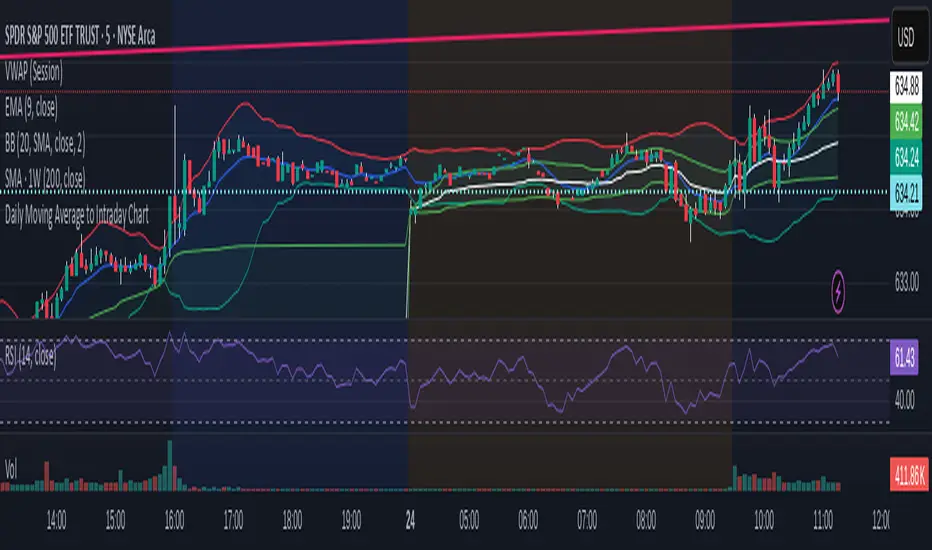
Daily Moving Average to Intraday ChartPlaces 200D, 100D, 50D SMAs as well as the 20D EMA onto intraday charts. (Script v6)
Double Banded Momentum CloudDouble Banded Momentum Cloud (DBMC) extends the logic of BMC by layering two volatility bands around a moving average to create stacked momentum thresholds. It compares a fast Exponential Moving Average (EMA) to a slow Simple Moving Average (SMA), while introducing inner and outer bands based on standard deviation multipliers.
SMA defines the central trend anchor.
EMA captures short-term price momentum.
Band A (inner) represents normal volatility range.
Band B (outer) flags extended or extreme conditions.
Momentum Cloud between EMA and SMA visualizes bias.
By observing how the EMA interacts with these bands, traders can distinguish between ordinary momentum and more aggressive or potentially exhausted moves.
Banded Momentum CloudBanded Momentum Cloud (BMC) is a visual momentum indicator that blends trend-following averages with volatility-based thresholds. It compares a fast Exponential Moving Average (EMA) to a slower Simple Moving Average (SMA), while using a standard deviation band around the SMA to define momentum boundaries.
SMA provides the baseline trend.
EMA responds faster and highlights momentum shifts.
Standard Deviation Bands (above and below SMA) act as adaptive thresholds.
Momentum Cloud fills the space between the EMA and SMA to illustrate the directional bias and intensity.
When the EMA pushes beyond the upper or lower band, it may signal increased momentum or volatility in that direction.
Envelope Momentum CloudEnvelope Momentum Cloud (EMC) is a momentum visualization tool using moving averages and fixed-percentage envelopes. It compares an EMA (fast) to an SMA (slow), with static envelopes around the SMA to create momentum thresholds.
SMA anchors the trend baseline.
EMA highlights momentum shifts relative to the SMA.
Envelopes are placed at a user-defined % above and below the SMA.
Momentum Cloud visually fills the gap between EMA and SMA to show directional pressure.
Crosses beyond the envelope boundaries can indicate overextended moves or possible trend shifts.

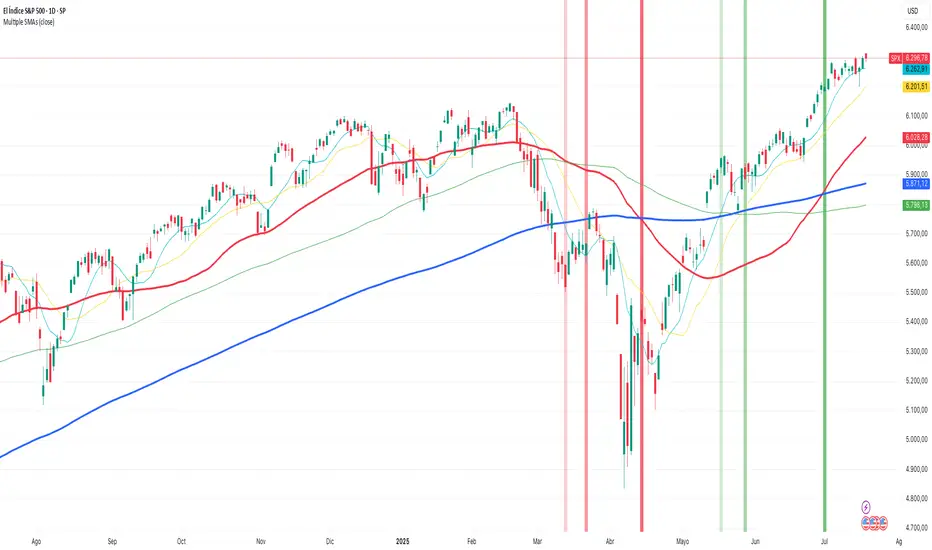
Multiple SMAsPlots multiple SMAs in a single indicator.
This script only plots the SMAs if the timeframe is set to daily.
- SMA10 in light blue
- SMA20 in yellow
- SMA50 in red
- SMA100 in green
- SMA200 in blue
It also plots the crosses between SMA20 and SMA50
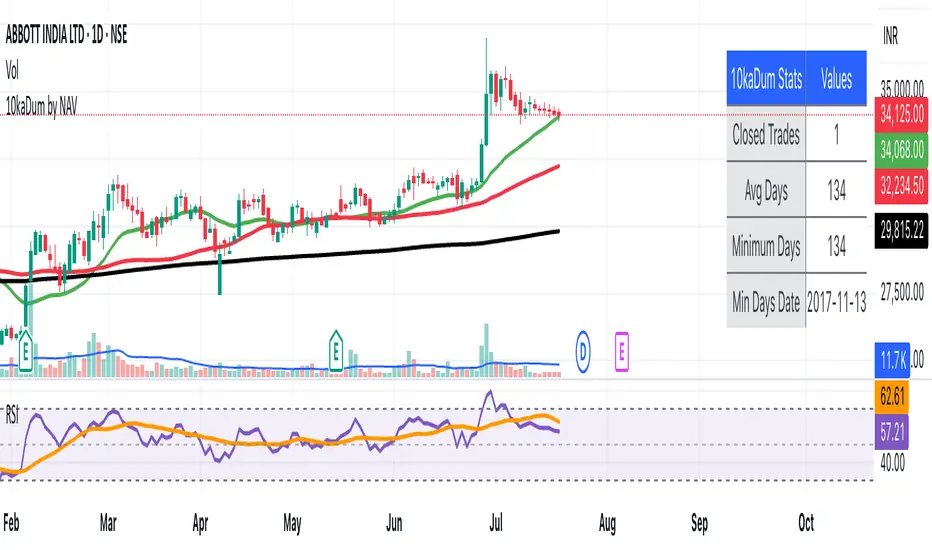
10kaDum by NAVHere's a comprehensive description for publishing your "10kaDum by NAV" script on TradingView:
---
# 🎯 10kaDum by NAV - Advanced SMA Alignment Trading System
**A comprehensive trading strategy that combines SMA alignment signals with intelligent dip-buying and automated profit-taking mechanisms.**
## 📊 Strategy Overview
The 10kaDum system identifies optimal entry and exit points using Simple Moving Average (SMA) alignment patterns, while providing additional opportunities through systematic dip buying and profit taking.
### Core Signals:
🟢 **MAIN BUY**: Triggers when Close < SMA20 < SMA50 < SMA200 (bearish alignment - potential reversal)
🟡 **10kaDum BUY**: Secondary buy signal when price drops 10% after main buy (dollar-cost averaging)
🟠 **10kaDum SELL**: Exit signal when price rises 10% from 10kaDum buy (quick profit taking)
🔴 **MAIN SELL**: Exit signal when Close > SMA20 > SMA50 > SMA200 (bullish alignment - trend reversal)
## 🔥 Key Features
### Smart Signal Management
- **One-time signals**: Each signal triggers only once until the opposite condition occurs
- **No signal spam**: Clean, actionable entries without repetitive alerts
- **Cycle-based logic**: Complete trading cycles from entry to exit
### Performance Analytics
- **Real-time statistics table** with configurable position and styling
- **Closed Trades**: Total number of completed 10kaDum cycles
- **Average Days**: Mean holding period for 10kaDum positions
- **Minimum Days**: Fastest trade completion time
- **Min Days Date**: When the fastest trade occurred
### Advanced Label System
- **Performance metrics**: Days held, gain percentage, and CAGR on exit signals
- **Calendar days calculation**: Accurate time-based performance (not just bars)
- **Anti-overlap positioning**: Smart label placement to avoid chart clutter
- **Fully customizable**: Colors, sizes, and text styling
### Professional Customization
- **Label colors**: Separate color controls for each signal type
- **Table styling**: Full control over fonts, colors, and positioning
- **Position controls**: Precise offset adjustments for optimal visibility
- **Alert system**: Built-in alerts for all signal types
## 📈 Trading Logic
**Entry Strategy:**
1. Wait for bearish SMA alignment (potential bottom)
2. Enter initial position on MAIN BUY
3. Add to position on 10% dips (10kaDum BUY)
**Exit Strategy:**
1. Take quick profits on 10kaDum positions (+10% gain)
2. Hold main position until bullish SMA alignment
3. Full exit on MAIN SELL signal
## 🎨 Visual Elements
- **SMA Lines**: 20, 50, and 200-period moving averages
- **Colored Labels**: Distinct visual signals for each action
- **Statistics Table**: Live performance tracking
- **Clean Design**: Minimal chart clutter with maximum information
## ⚡ Best Practices
- Use on daily or higher timeframes for best results
- Combine with volume analysis for confirmation
- Monitor the statistics table for strategy performance
- Adjust position sizes based on signal type
- Set alerts for hands-free trading
## 🔧 Customization Options
- **9 table positions** (top, middle, bottom × left, center, right)
- **5 font sizes** (tiny to huge)
- **Full color customization** for all elements
- **Adjustable label spacing** for different chart scales
- **Toggle statistics display** on/off
---
**Disclaimer**: This indicator is for educational purposes. Past performance doesn't guarantee future results. Always practice proper risk management and consider your financial situation before trading.
**Created by**: NAV
**Version**: 1.0
**Category**: Strategy / Trend Analysis
---
This description highlights the key features, provides clear usage instructions, and maintains a professional tone suitable for TradingView's marketplace.
SMA Crossover Strategy📈 Indicator: SMA Crossover Strategy
This strategy uses optimized fast and slow SMA values tailored to popular timeframes for more responsive trend detection. You can let the script auto-select values or manually define your own crossover settings. Clean visual cues and per-candle signal filtering keep your chart sharp and actionable.
🔧 Key Features:
- Auto Mode: Smart defaults for each timeframe with trader-tested pairs
- Manual Mode: User-defined flexibility when custom values are needed
- Signal Clarity: BUY/SELL labels are plotted only once per confirmed candle
🧠 Default Auto Values (Based on Chart Timeframe)
- 1-min: Fast = 5, Slow = 20
- 5-min: Fast = 5, Slow = 10
- 15-min: Fast = 5, Slow = 13
- 30-min: Fast = 15, Slow = 30
- 1-hr: Fast = 50, Slow = 200
- 4-hr: Fast = 20, Slow = 50
- Daily: Fast = 50, Slow = 200
- Weekly: Fast = 10, Slow = 30
If your timeframe isn't matched exactly, the script falls back to sensible defaults.
📊 How to Improve Conviction
SMA crossovers are strong signals when confirmed by other tools. Here are some add-ons you can layer into your chart:
🔍 Confirmation Indicators
- RSI (14): Look for crossovers near RSI crossing 50 or at oversold/overbought zones for momentum confirmation.
- MACD: Use histogram alignment with crossover signals to detect real trend shifts.
- Volume Filters: Pair signals with rising volume for institutional confirmation.
🌀 Trend & Volatility Filters
- ATR (Average True Range): Helps filter signals during consolidation—watch for expanding ATR as a volatility cue.
- ADX: Trade only when ADX > 20 to avoid false signals in ranging markets.
- HMA (Hull MA): A smoother, faster MA that can act as a trend bias overlay.
🔭 Multi-Timeframe Awareness
Overlay higher-timeframe trend indicators (like a daily 200 SMA on an intraday chart) to avoid trading against macro momentum.

10/20 MA Coil: Progressive Colors & Multi-Day BreakoutThis indicator detects price “coil” setups and highlights potential breakout or breakdown opportunities using moving average alignment and volatility compression.
Features:
• Coil Detection:
• Identifies consolidation when:
• The 10 and 20 MAs are tightly aligned (within user-defined tolerance)
• Price is above both MAs and within 1.5x ADR of them
• The 50 MA is rising
• Progressive Coil Coloring:
• Coil candles are colored in progressively darker orange as the streak continues
• Bullish Breakout Signal:
• Triggers when a green candle follows a coiled bar
• The candle’s body must be greater than or equal to 1 ATR
• Colored lime green
• Bearish Breakdown Signal:
• Triggers when a red candle follows a coiled bar
• The candle’s body must be greater than or equal to 1 ATR to the downside
• Colored black
• Custom Candle Rendering:
• Candle body color represents coil or breakout state
• Wick and border are red or green to reflect price direction
• Optional Debug Tools:
• Coil streak, ATR, and distance from MAs can be plotted for deeper analysis
This script is designed for traders looking to spot price compression and prepare for high-probability moves following low-volatility setups.

Crypto Trend StrengthCrypto Trend Strength Dashboard (11-Point System)
Description:
This indicator is a visually enhanced dashboard that evaluates 11 key technical signals to assess bullish momentum for crypto. Each condition is displayed in a easy reading table for quick interpretation and visual appeal.
Signals include:
Higher highs and higher lows
Price above SMA18 and SMA365
SMA180 > SMA365
Positive slope on SMA180 and SMA365
RSI trending upward
Ideal for traders who want a clean, at-a-glance summary of market strength without scanning multiple charts or indicators.

Multi-Timeframe 200 SMAs (2m, 5m, 10m, 1H, 1D)Intraday 200 SMA Multi-Timeframe Overlay
This indicator displays the 200-period Simple Moving Averages (SMA) from the 2-minute, 5-minute, 10-minute, 1-hour, and 1-day timeframes on any chart — providing powerful multi-timeframe context for intraday trading.
Each moving average is color-coded and labeled for quick reference, helping traders identify dynamic support and resistance levels across key timeframes without needing to switch charts. Designed specifically for day traders, this tool enhances situational awareness and assists in aligning trades with broader trend direction.
Features:
2-minute 200 SMA (Yellow)
5-minute 200 SMA (Light Orange)
10-minute 200 SMA (Dark Orange)
1-hour 200 SMA (Red)
1-day 200 SMA (Purple)
Displayed on any intraday chart
Clean line styles with optional labels for timeframe reference
Perfect for scalpers and intraday swing traders who rely on higher timeframe moving averages for confluence and trade validation.

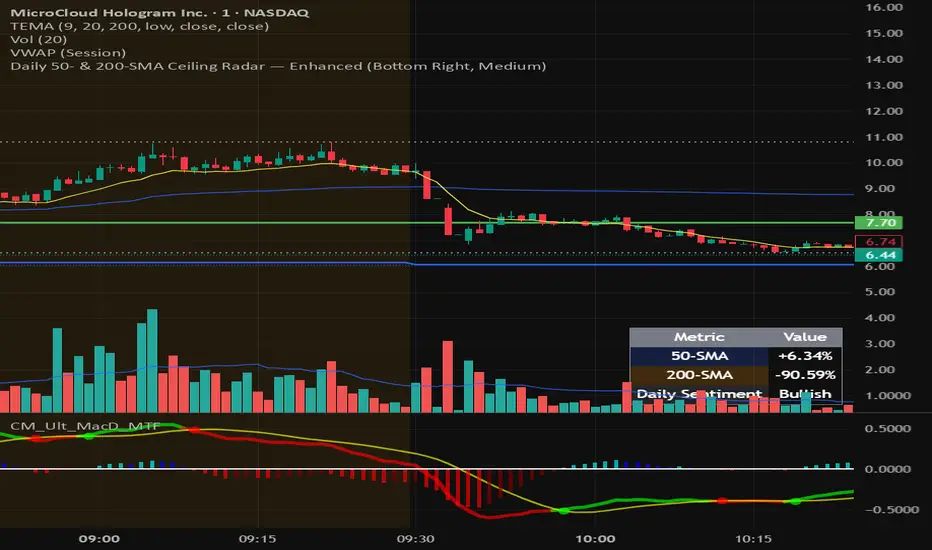
Daily 50‑ & 200‑SMA Ceiling Radar — EnhancedDescription:
This custom TradingView indicator, developed by Trader Malik and licensed under Trades Per Minute, is a powerful visual tool for identifying how price behaves relative to major daily moving averages — the 50-SMA and 200-SMA. It helps traders quickly understand key technical dynamics such as trend alignment, MA proximity, and short-term momentum sentiment — all displayed on a clean, minimal overlay with visual alerts and an adjustable data table.
FEATURES
1. Daily 50 & 200 Simple Moving Averages (SMA):**
- Displayed directly on the chart using distinct blue and orange lines.
- These serve as primary trend filters and support/resistance zones.
2. Price Highlighting:
- A red background flashes momentarily when the price crosses either the 50-SMA or 200-SMA.
- A green background fills the chart when price is above both MAs (bullish zone).
- A red background persists if price is below both MAs (bearish zone).
3. MA Gap Analysis Table:
- 50-SMA Row**: Shows % gap between 50-SMA and 200-SMA.
- 200-SMA Row**: Shows % gap between 200-SMA and 50-SMA.
- Sentiment Row**: Displays short-term trend bias based on the slope of the past 7 daily closes — Bullish, Neutral, or Bearish.
USER SETTINGS
Table Location: Choose between **Top Right** or **Bottom Right** of the chart.
Table Size: Select **Small**, **Medium**, or **Large** to suit screen preferences and layout aesthetics.
This script is **intellectual property of Trades Per Minute** and distributed by **Trader Malik** for use under licensing terms. Redistribution or repurposing without authorization is strictly prohibited.
Multi SMA AnalyzerMulti SMA Analyzer with Custom SMA Table & Advanced Session Logic
A feature-rich SMA analysis suite for traders, offering up to 7 configurable SMAs, in-depth trend detection, real-time table, and true session-aware calculations.
Ideal for those who want to combine intraday, swing, and higher-timeframe trend analysis with maximum chart flexibility.
Key Features
📊 Multi-SMA Overlay
- 7 SMAs (default: 5, 20, 50, 100, 200, 21, 34)—individually configurable (period, source, color, line style)
- Show/hide each SMA, custom line style (solid, stepline, circles), and color logic
- Dynamic color: full opacity above SMA, reduced when below
⏰ Session-Aware SMAs
- Each SMA can be calculated using only user-defined session hours/days/timezone
- “Ignore extended hours” option for accurate intraday trend
📋 Smart Data Table
- Live SMA values, % distance from price, and directional arrows (↑/↓/→)
- Bull/Bear/Sideways trend classification
- Custom table position, size, colors, transparency
- Table can run on chart or custom (higher) timeframe for multi-TF analysis
🎯 Golden/Death Cross Detection
- Flexible crossover engine: select any two from (5, 10, 20, 50, 100, 200) for fast/slow SMA cross signals
- Plots icons (★ Golden, 💀 Death), optional crossover labels with custom size/colors
🏷️ SMA Labels
- Optional on-chart SMA period labels
- Custom placement (above/below/on line), size, color, offset
🚨 Signal & Trend Engine
- Bull/Bear/Sideways logic: price vs. multiple SMAs (not just one pair)
- Volume spike detection (2x 20-period SMA)
- Bullish engulfing candlestick detection
- All signals can use chart or custom table timeframe
🎨 Visual Customization
- Dynamic background color (Bull: green, Bear: red, Neutral: gray)
- Every visual aspect is customizable: label/table colors, transparency, size, position
🔔 Built-in Alerts
- Crossovers (SMA20/50, Golden/Death)
- Bull trend, volume spikes, engulfing pattern—all alert-ready
How It Works
- Session Filtering:
- SMAs can be set to count only bars from your chosen market session, for true intraday/trading-hour signals
Dynamic Table & Signals:
- Table and all signal logic run on your selected chart or custom timeframe
Flexible Crossover:
- Choose any pair (5, 10, 20, 50, 100, 200) for cross detection—SMA 10 is available for crossover even if not shown as an SMA line
Everything is modular:
- Toggle features, set visuals, and alerts to your workflow
🚨 How to Use Alerts
- All key signals (crossovers, trend shifts, volume spikes, engulfing patterns) are available as alert conditions.
To enable:
- Click the “Alerts” (clock) icon at the top of TradingView.
- Select your desired signal (e.g., “Golden Cross”) from the condition dropdown.
- Set your alert preferences and create the alert.
- Now, you’ll get notified automatically whenever a signal occurs!
Perfect For
- Multi-timeframe and swing traders seeking higher timeframe SMA confirmation
- Intraday traders who want to ignore pre/post-market data
- Anyone wanting a modern, powerful, fully customizable multi-SMA overlay
// P.S: Experiment with Golden Cross where Fast SMA is 5 and Slow SMA is 20.
// Set custom timeframe for 4 hr while monitoring your chart on 15 min time frame.
// Enable Background Color and Use Table Timeframe for Background.
// Uncheck Pine labels in Style tab.
Clean, open-source, and loaded with pro features—enjoy!
Like, share, and let me know if you'd like any new features added.

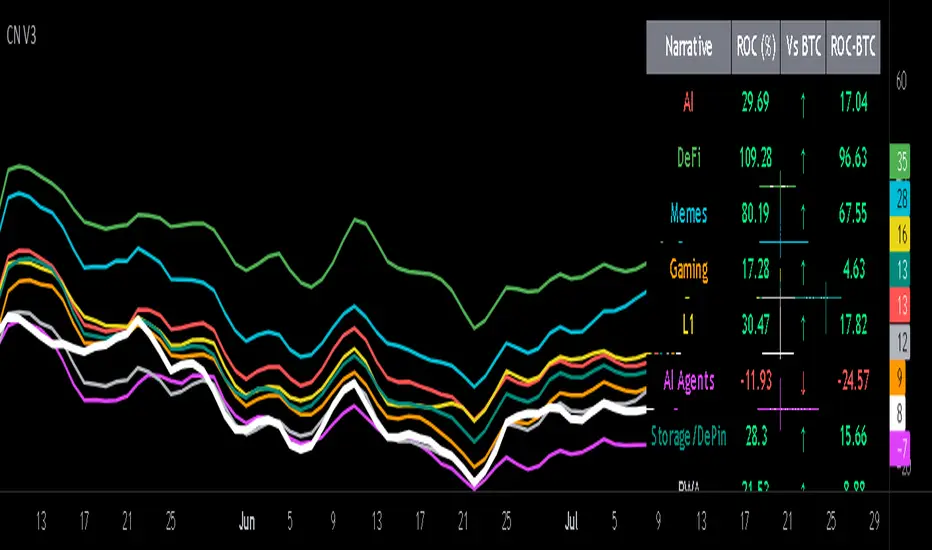
Crypto Narratives: Relative Strength V2Simple Indicator that displays the relative strength of 8 Key narratives against BTC as "Spaghetti" chart. The chart plots an aggregated RSI value for the 5 highest Market Cap cryopto's within each relevant narrative. The chart plots a 14 period SMA RSI for each narrative.
Functionality:
The indicator calculates the average RSI values for the current leading tokens associated with ten different crypto narratives:
- AI (Artificial Intelligence)
- DeFi (Decentralized Finance)
- Memes
- Gaming
- Level 1 (Layer 1 Protocols)
- AI Agents
- Storage/DePin
- RWA (Real-World Assets)
- BTC
Usage Notes:
The 5 crypto coins should be regularly checked and updated (in the script) by overtyping the current values from Rows 24 - 92 to ensure that you are using the up to date list of highest marketcap coins (or coins of your choosing).
The 14 period SMA can be changed in the indicator settings.
The indicator resets every 24 hours and is set to UTC+10. This can be changed by editing the script line 19 and changing the value of "resetHour = 1" to whatever value works for your timezone.
There is also a Rate of Change table that details the % rate of change of each narrative against BTC
Horizontal lines have been included to provide an indication of overbought and oversold levels.
The upper and lower horizontal line (overbought and oversold) can be adjusted through the settings.
The line width, and label offset can be customised through the input options.
Alerts can be set to triggered when a narrative's RSI crosses above the overbought level or below the oversold level. The alerts include the narrative name, RSI value, and the RSI level.
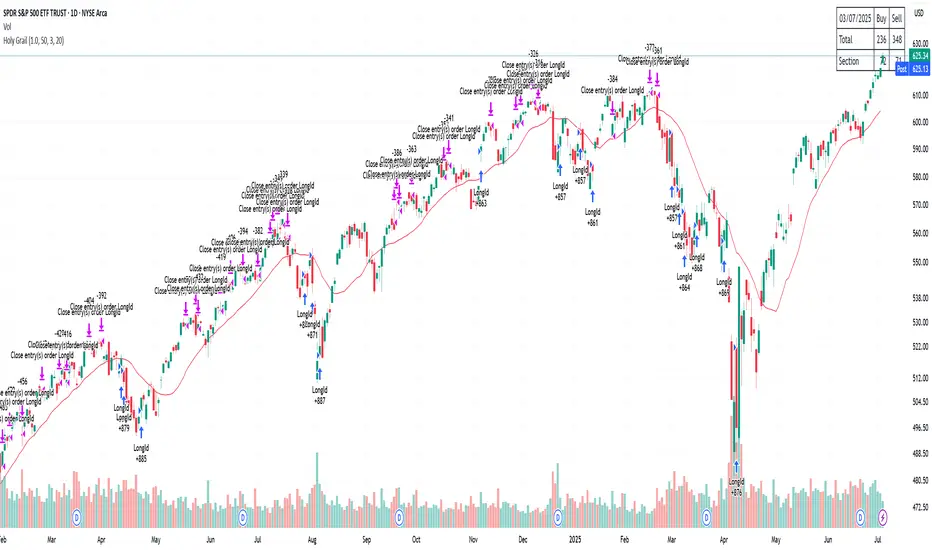
Holy GrailThis is a long-only educational strategy that simulates what happens if you keep adding to a position during pullbacks and only exit when the asset hits a new All-Time High (ATH). It is intended for learning purposes only — not for live trading.
🧠 How it works:
The strategy identifies pullbacks using a simple moving average (MA).
When price dips below the MA, it begins monitoring for the first green candle (close > open).
That green candle signals a potential bottom, so it adds to the position.
If price goes lower, it waits for the next green candle and adds again.
The exit happens after ATH — it sells on each red candle (close < open) once a new ATH is reached.
You can adjust:
MA length (defines what’s considered a pullback)
Initial buy % (how much to pre-fill before signals start)
Buy % per signal (after pullback green candle)
Exit % per red candle after ATH
📊 Intended assets & timeframes:
This strategy is designed for broad market indices and long-term appreciating assets, such as:
SPY, NASDAQ, DAX, FTSE
Use it only on 1D or higher timeframes — it’s not meant for scalping or short-term trading.
⚠️ Important Limitations:
Long-only: The script does not short. It assumes the asset will eventually recover to a new ATH.
Not for all assets: It won't work on assets that may never recover (e.g., single stocks or speculative tokens).
Slow capital deployment: Entries happen gradually and may take a long time to close.
Not optimized for returns: Buy & hold can outperform this strategy.
No slippage, fees, or funding costs included.
This is not a performance strategy. It’s a teaching tool to show that:
High win rate ≠ high profitability
Patience can be deceiving
Many signals = long capital lock-in
🎓 Why it exists:
The purpose of this strategy is to demonstrate market psychology and risk overconfidence. Traders often chase strategies with high win rates without considering holding time, drawdowns, or opportunity cost.
This script helps visualize that phenomenon.