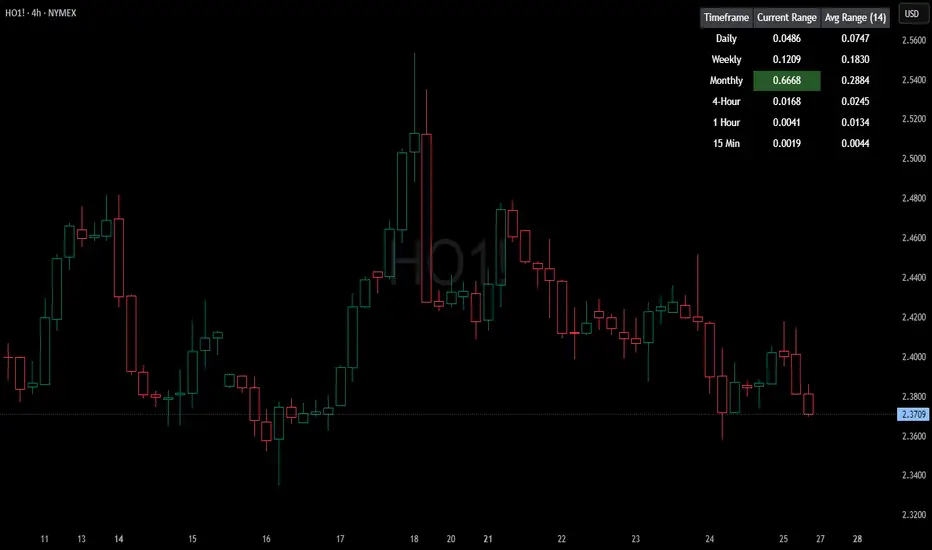
HTF Current/Average RangeThe "HTF(Higher Timeframe) Current/Average Range" indicator calculates and displays the current and average price ranges across multiple timeframes, including daily, weekly, monthly, 4 hour, and user-defined custom timeframes.
Users can customize the lookback period, table size, timeframe, and font color; with the indicator efficiently updating on the final bar to optimize performance.
When the current range surpasses the average range for a given timeframe, the corresponding table cell is highlighted in green, indicating potential maximum price expansion and signaling the possibility of an impending retracement or consolidation.
For day trading strategies, the daily average range can serve as a guide, allowing traders to hold positions until the current daily range approaches or meets the average range, at which point exiting the trade may be considered.
For scalping strategies, the 15min and 5min average range can be utilized to determine optimal holding periods for fast trades.
Other strategies:
Intraday Trading - 1h and 4h Average Range
Swing Trading - Monthly Average Range
Short-term Trading - Weekly Average Range
Also using these statistics in accordance with Power 3 ICT concepts, will assist in holding trades to their statistical average range of the chosen HTF candle.
CODE
The core functionality lies in the data retrieval and table population sections.
The request.security function (e.g., = request.security(syminfo.tickerid, "D", , lookahead = barmerge.lookahead_off)) retrieves high and low prices from specified timeframes without lookahead bias, ensuring accurate historical data.
These values are used to compute current ranges and average ranges (ta.sma(high - low, avgLength)), which are then displayed in a dynamically generated table starting at (if barstate.islast) using table.new, with conditional green highlighting when the current range is greater than average range, providing a clear visual cue for volatility analysis.
Statistics
ES Gap Trading Levels# ES Gap Trading Levels
## Overview
A professional gap trading indicator designed specifically for ES Futures traders. This indicator automatically captures the closing price at 3:59 PM ET (NYSE close) and immediately displays key gap levels for the evening trading session starting at 6:00 PM ET.
## Key Features
### ✅ **Automatic Gap Level Detection**
- Captures ES Futures closing price at 3:59-4:00 PM ET
- Instantly displays gap levels for immediate session planning
- Resets daily for fresh gap analysis
### ✅ **Six Critical Gap Levels**
- **±10 Points** (White lines) - Short-term gap targets
- **±20 Points** (Light Blue lines) - Medium gap targets
- **±30 Points** (Red lines) - Extended gap targets
### ✅ **Professional Display**
- Clean horizontal lines with customizable colors
- Clear labels showing point values (+30, +20, +10, -10, -20, -30)
- Gap levels table showing exact price targets
- Optional closing price reference line
### ✅ **Customizable Settings**
- Adjustable line colors, width, and extension
- Toggle labels and reference table on/off
- Manual closing price override for testing
- Debug mode for troubleshooting
### ✅ **Smart Management**
- Automatic cleanup of previous day's levels
- Lines appear immediately after market close
- Optimized for ES1!, MES1!, and other ES futures contracts
## How It Works
1. **Market Close Capture**: At 3:59 PM ET, the indicator captures the ES closing price
2. **Instant Display**: Gap levels immediately appear on your chart
3. **Evening Session Ready**: Lines are positioned for 6:00 PM ET session start
4. **Daily Reset**: Old levels are automatically cleared each new trading day
## Perfect For:
- Gap trading strategies
- Overnight futures trading
- ES futures scalping
- Session transition analysis
- Risk management levels
## Usage Tips:
- Best used on 1-15 minute ES futures charts
- Ensure chart timezone shows ET times
- Use manual mode for backtesting specific dates
- Combine with volume and momentum indicators
## Settings Guide:
- **Display Settings**: Control lines, labels, and table visibility
- **Colors**: Customize each gap level color scheme
- **Manual Settings**: Override closing price for testing
- **Debug**: View time detection and diagnostic information
*Designed by traders, for traders. Clean, professional, and reliable gap level detection for serious ES futures trading.*

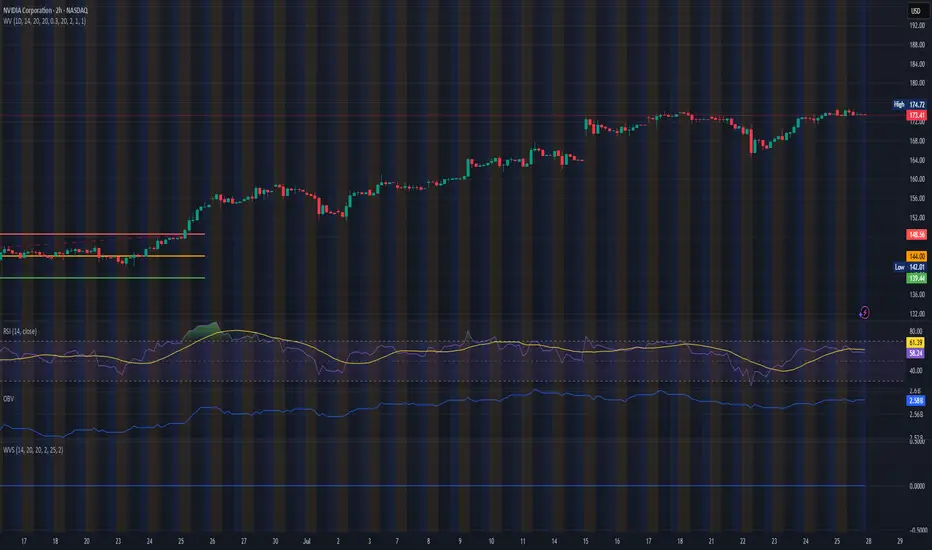
Waterfall ScreenerHow to Use This to Screen Stocks: A Step-by-Step Guide
Save the Screener Script: Open the Pine Editor, paste the code above, and save it with a clear name like "Waterfall Screener".
Open the Stock Screener: Go to the TradingView homepage or any chart page and click the "Screener" tab at the bottom. Make sure you are on the "Stock" screener.
Set Your Market: Choose the market you want to scan (e.g., NASDAQ, NYSE).
Add Your Custom Filter (The Magic Step):
Click the "Filters" button on the right side of the screener panel.
In the search box that appears, type the name of your new script: "Waterfall Screener".
It will appear as a selectable filter. Click it.
Configure the Filter:
A new filter will appear in your screener list named "Waterfall Screener".
You can now set conditions for the "ScreenerSignal" value we plotted.
To find stocks with a new, actionable trade plan, set the filter to:
Waterfall Screener | Equal | 1
Refine and Scan:
Add other essential filters to reduce noise, such as:
Volume > 1M (to find liquid stocks)
Market Cap > 1B (to find established companies)
The screener will now automatically update and show you a list of all stocks that currently have a "PENDING_ENTRY" setup according to the indicator's logic and your chosen timeframe (e.g., Daily).
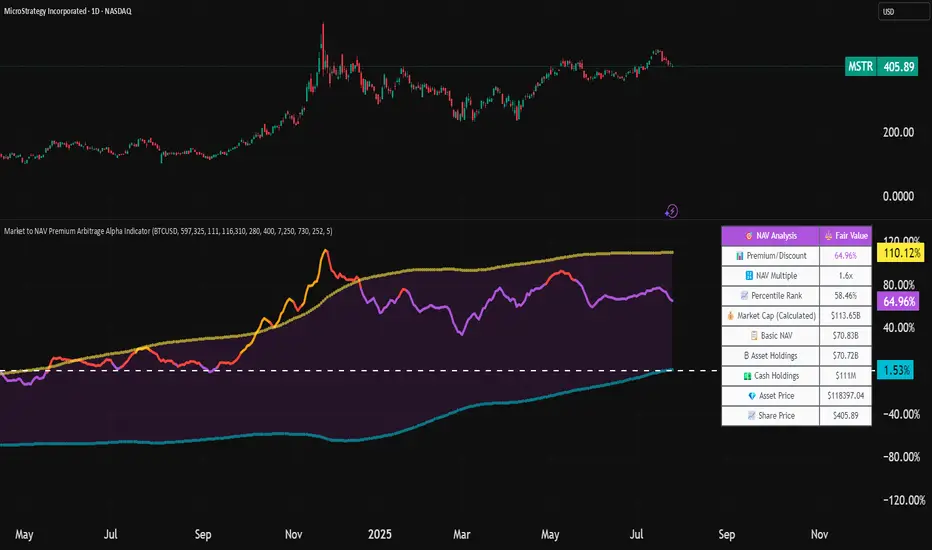
Market to NAV Premium Arbitrage Alpha IndicatorBitcoin treasury companies such as Microstrategy are known for trading at significant premiums. but how big exactly is the premium? And how can we measure it in real time?
I developed this quantitative tool to identify statistical mispricings between market capitalization and net asset value (NAV), specifically designed for arbitrage strategies and alpha generation in Bitcoin-holding companies, such as MicroStrategy or Sharplink Gaming, or SPACs used primarily to hold cryptocurrencies, Bitcoin ETFs, and other NAV-based instruments. It can probably also be used in certain spin-offs.
KEY FEATURES:
✅ Real-time Premium/Discount Calculation
• Automatically retrieves market cap data from TradingView
• Calculates precise NAV based on underlying asset holdings (for example Bitcoin)
• Formula: (Market Cap - NAV) / NAV × 100
✅ Statistical Analysis
• Historical percentile rankings (customizable lookback period)
• Standard deviation bands (2σ) for extreme value detection (close to these values might be seen as interesting points to short or go long)
• Smoothing period to reduce noise
✅ Multi-Source Market Cap Detection
• You can add the ticker of the NAV asset, but if necessary, you can also put it manually. Priority system: TradingView data → Calculated → Manual override
✅ Advanced NAV Modeling
• Basic NAV: Asset holdings + cash.
• Adjusted NAV: Includes software business value, debt, preferred shares. If the company has a lot of this kind of intrinsic value, put it in the "cash" field
• Support for any underlying asset (BTC, ETH, etc.)
TRADING APPLICATIONS:
🎯 Pairs Trading Signals
• Long/Short opportunities when premium reaches statistical extremes
• Mean reversion strategies based on historical ranges
• Risk-adjusted position sizing using percentile ranks
🎯 Arbitrage Detection
• Identifies when market pricing significantly deviates from fair value
• Quantifies the magnitude of mispricing for profit potential
• Historical context for timing entry/exit points
CONFIGURATION OPTIONS:
• Underlying Asset: Any symbol (default: COINBASE:BTCUSD) NEEDS MANUAL INPUT
• Asset Quantity: Precise holdings amount (for example, how much BTC does the company currently hold). NEEDS MANUAL INPUT
• Cash Holdings: Additional liquid assets. NEEDS MANUAL INPUT
• Market Cap Mode: Auto-detect, calculated, or manual
• Advanced Adjustments: Business value, debt, preferred shares
• Display Settings: Lookback period, smoothing, custom colors
IT CAN BE USED BY:
• Quantitative traders focused on statistical arbitrage
• Institutional investors monitoring NAV-based instruments
• Bitcoin ETF and MSTR traders seeking alpha generation
• Risk managers tracking premium/discount exposures
• Academic researchers studying market efficiency (as you can see, markets are not efficient 😉)
Stochastic Z-Score [AlgoAlpha]🟠 OVERVIEW
This indicator is a custom-built oscillator called the Stochastic Z-Score , which blends a volatility-normalized Z-Score with stochastic principles and smooths it using a Hull Moving Average (HMA). It transforms raw price deviations into a normalized momentum structure, then processes that through a stochastic function to better identify extreme moves. A secondary long-term momentum component is also included using an ALMA smoother. The result is a responsive oscillator that reacts to sharp imbalances while remaining stable in sideways conditions. Colored histograms, dynamic oscillator bands, and reversal labels help users visually assess shifts in momentum and identify potential turning points.
🟠 CONCEPTS
The Z-Score is calculated by comparing price to its mean and dividing by its standard deviation—this normalizes movement and highlights how far current price has stretched from typical values. This Z-Score is then passed through a stochastic function, which further refines the signal into a bounded range for easier interpretation. To reduce noise, a Hull Moving Average is applied. A separate long-term trend filter based on the ALMA of the Z-Score helps determine broader context, filtering out short-term traps. Zones are mapped with thresholds at ±2 and ±2.5 to distinguish regular momentum from extreme exhaustion. The tool is built to adapt across timeframes and assets.
🟠 FEATURES
Z-Score histogram with gradient color to visualize deviation intensity (optional toggle).
Primary oscillator line (smoothed stochastic Z-Score) with adaptive coloring based on momentum direction.
Dynamic bands at ±2 and ±2.5 to represent regular vs extreme momentum zones.
Long-term momentum line (ALMA) with contextual coloring to separate trend phases.
Automatic reversal markers when short-term crosses occur at extremes with supporting long-term momentum.
Built-in alerts for oscillator direction changes, zero-line crosses, overbought/oversold entries, and trend confirmation.
🟠 USAGE
Use this script to track momentum shifts and identify potential reversal areas. When the oscillator is rising and crosses above the previous value—especially from deeply negative zones (below -2)—and the ALMA is also above zero, this suggests bullish reversal conditions. The opposite holds for bearish setups. Reversal labels ("▲" and "▼") appear only when both short- and long-term conditions align. The ±2 and ±2.5 thresholds act as momentum warning zones; values inside are typical trends, while those beyond suggest exhaustion or extremes. Adjust the length input to match the asset’s volatility. Enable the histogram to explore underlying raw Z-Score movements. Alerts can be configured to notify key changes in momentum or zone entries.

Synthetic VX3! & VX4! continuous /VX futuresTradingView is missing continuous 3rd and 4th month VIX (/VX) futures, so I decided to try to make a synthetic one that emulates what continuous maturity futures would look like. This is useful for backtesting/historical purposes as it enables traders to see how their further out VX contracts would've performed vs the front month contract.
The indicator pulls actual realtime data (if you subscribe to the CBOE data package) or 15 minute delayed data for the VIX spot (the actual non-tradeable VIX index), the continuous front month (VX1!), and the continuous second month (VX2!) continually rolled contracts. Then the indicator's script applies a formula to fairly closely estimate how 3rd and 4th month continuous contracts would've moved.
It uses an exponential mean‑reversion to a long‑run level formula using:
σ(T) = θ+(σ0−θ)e−kT
You can expect it to be off by ~5% or so (in times of backwardation it might be less accurate).

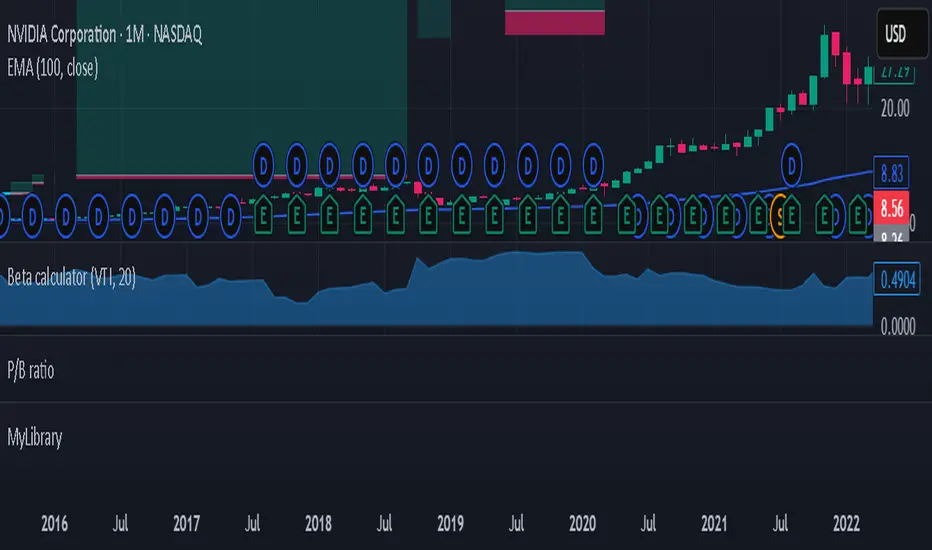
Beta calculatorCalculates the market beta for the stock that is on your screen. You may change the parameters by changing the symbol you are using as benchmark to calculate market beta in the settings. This will affect the market beta you get. VTI is used since it has a theoretical market beta of 1.
Custom Screener with Alerts @RAMLAKSHMANDASScan the Nifty 50 directly on TradingView!
This script provides a real-time screener for the top 40 Nifty 50 stocks ranked by current index weightage (starting from RELIANCE, HDFCBANK, ICICIBANK, etc.), offering rapid on-chart multi-symbol analysis.
Features
Multi-symbol screener: Monitors the leading 40 Nifty constituents (NSE equities) in one view.
Full indicator table: Get snapshot values for Price, RSI, TSI, ADX, and SuperTrend for every symbol.
Dynamic filtering: Instantly filter results by any indicator value (e.g., highlight all stocks with RSI below 30).
Customizable symbols: Easily edit the symbol list to match updated Nifty composition or your stocks of interest.
Multi-timeframe support: Table values will update for any chosen chart timeframe.
Real-time alerts: Set up alerts for filtered stocks matching your strategy.

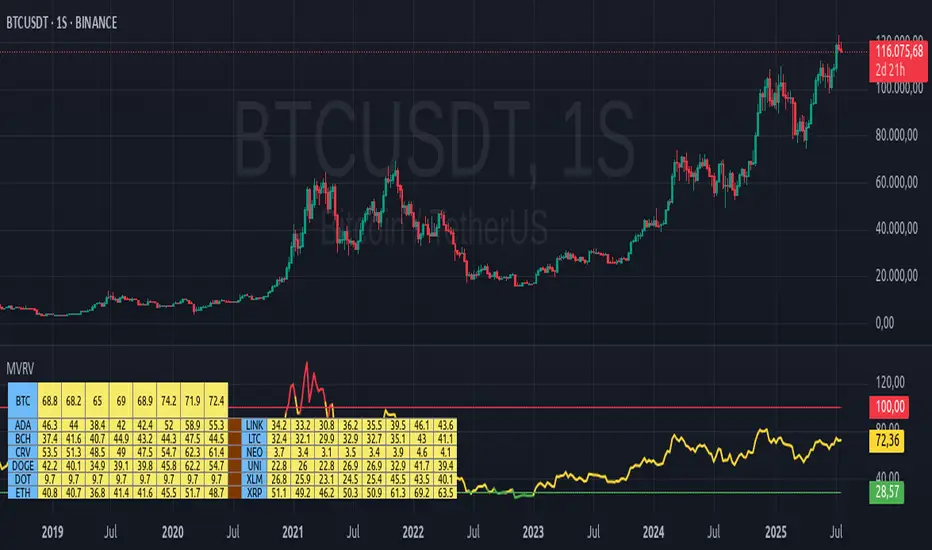
MVRV Altcoins📌 Technical Description of Indicator: MVRV Altcoins
This advanced script calculates the Market Value to Realized Value (MVRV) ratio across multiple cryptocurrencies simultaneously. It offers two analytical modes: Normal and Z-Score, optimized for visual comparison and real-time monitoring of up to 13 predefined assets. If a user applies the indicator to a symbol that is not among the 13 programmed assets, the default behavior displays the Bitcoin chart as a fallback reference.
🔍 What Is MVRV and Why Is It Important?
MVRV is an on-chain metric designed to assess whether a cryptocurrency is overvalued or undervalued by comparing its market capitalization to its realized capitalization.
- Market Cap: The total circulating supply multiplied by the current market price.
- Realized Cap: The sum value of all coins based on the price at the time they last moved on-chain, offering a time-weighted valuation.
Normal Calculation:
MVRV_Normal = Market Cap / Realized Cap
This version reflects investor profitability and identifies potential accumulation or distribution zones.
📊 Z-Score Calculation:
MVRV_ZScore = (Market Cap − Realized Cap) / Standard Deviation of Market Cap
This formula evaluates how extreme the current market conditions are compared to historical norms. It normalizes the difference using statistical dispersion, turning it into a volatility-aware metric that better reflects valuation extremes.
🔎 How Market Cap Is Computed
Unlike conventional indicators relying on consolidated feeds, this script uses modular components from CoinMetrics to construct the active capitalization more accurately, especially for altcoins. Here's the breakdown:
Active Capitalization = MARKETCAPFF + MARKETCAPACTSPLY
Realized Capitalization = MARKETCAPREAL
Component Definitions:
- MARKETCAPFF: Market Cap Free Float — total valuation based only on truly circulating coins.
- MARKETCAPACTSPLY: Capitalization from actively circulating supply — filters dormant or locked coins.
- MARKETCAPREAL: Realized Cap — historical valuation weighted by the last on-chain movement of each coin.
This method offers enhanced precision and compatibility across assets that may lack comprehensive data from centralized providers.
⚙️ User-Configurable Parameters
- MVRV Mode: Choose between Normal and Z-Score.
- Percentage Scale View: If enabled, visual output is scaled using predefined divisors (100 / 3.5 or 100 / 6).
- Thresholds for Analysis:
- Normal mode: Define overbought and oversold levels (default 1.0 and 3.5).
- Z-Score mode: Configure statistical boundaries (default 0.0 and 6.0).
- Table Controls:
- Adjustable position on screen (9 options).
- Font size customization: tiny, small, normal, large.
- Color scheme personalization:
- Header: text and background
- Body: text and background
- Central column separator color
📊 Multicrypto Table Architecture
The indicator renders a high-performance visual table displaying data from up to 13 assets simultaneously. Each asset is represented as a vertical column featuring eigth historical data points plus the most recent value.
- Assets are displayed in two blocks separated by a decorative column.
- Each value is rounded to one decimal place for clarity.
- Cells are styled dynamically based on user settings.
🎨 Decorative Column Separator
Since the entire table is built as a unified structure, a color-configurable empty column is inserted mid-table to act as a visual divider. This approach improves readability and aesthetic balance without duplicating code or splitting table logic.
🔁 Default Behavior on Unsupported Assets
If the active chart is not one of the 13 predefined assets, the indicator will automatically display Bitcoin’s data. This ensures the chart remains functional and informative even outside the target asset group.
🎯 Color Interpretation by Condition
The MVRV value for each asset is highlighted using a traffic light system:
- Green: Undervalued (below oversold threshold)
- Red: Overvalued (above overbought threshold)
- Yellow: Neutral zone
This coding simplifies decision-making and visual scanning across assets.
Final Notes
This indicator is modular and fully adaptable, with well-commented sections designed for efficient customization. Its multiactive architecture makes it a valuable tool for crypto analysts tracking diversified portfolios beyond Bitcoin and Ethereum.
It supports visual storytelling across assets, comparative historical evaluation, and identification of strategic zones — whether for accumulation, distribution, or monitoring on-chain sentiment.
Days Since ±1% Move on CloseInterpretation & Use‑Case
The “Days Since ±1% Move” indicator simply tells you how many trading days have passed since the last daily close that moved at least 1% in either direction. Here’s how to put it to work:
Complacency Gauge
A long stretch without a ≥1% move often signals that realized volatility has collapsed and market participants may be under‑positioned for a sudden swing.
Positioning Insight
When institutional hedges and systematic strategies see low recent volatility, they tend to scale back protection (fewer options hedges, tighter risk limits), which can amplify the impact of any eventual volatility pickup.
Mean‑Reversion Signal
After an extended streak (e.g. 20–30 days), a fresh ≥1% move is more likely—and often more violent—because pent‑up positioning flows rush to adjust.
Trend Confirmation
Conversely, a reset in the count (i.e., a new ≥1% move) that coincides with strong volume and follow‑through suggests genuine directional conviction rather than just a volatility “blip.”

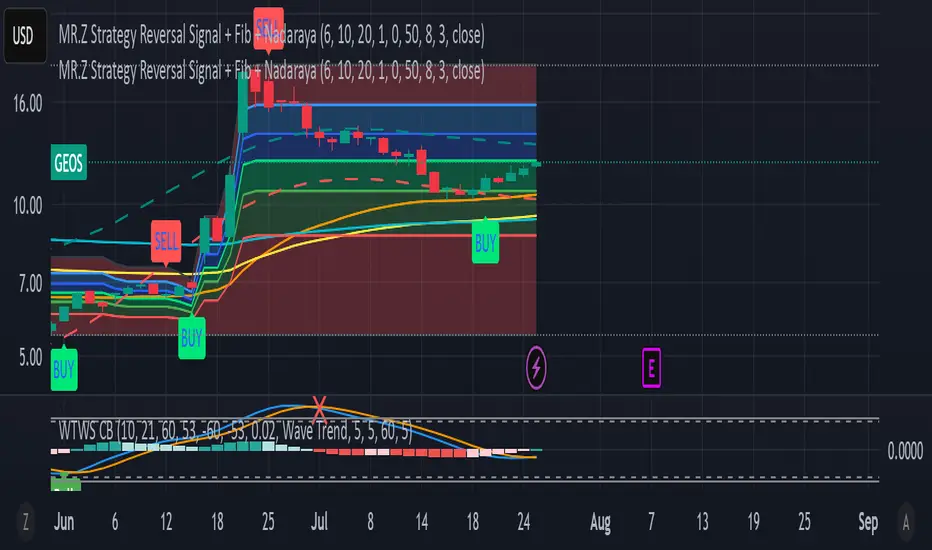
MR.Z Strategy Reversal Signal Nadaraya SMA)Nadaraya-Watson Envelope (NW Envelope):
A smoothed, non-linear dynamic envelope that adapts to price structure. It visually identifies price extremes using kernel regression. The upper and lower bands move with the chart and provide reliable dynamic support and resistance.
EMA Levels:
Includes three key exponential moving averages:
EMA 50 (short-term trend)
EMA 100 (medium-term)
EMA 200 (long-term, institutional level)
Fully Scrollable and Responsive:
All lines and envelopes are plotted using plot() so they move with the chart and respond to zoom and pan actions naturally.
🧠 Ideal Use:
Identify reversal zones, dynamic support/resistance, and trend momentum exhaustion.
Combine WTB and NW Envelope for confluence-based entries.
Use EMA structure for trend confirmation or breakout anticipation.
Let me know if you'd like to add:
Divergence detection
Buy/Sell signals
Alerts or signal filtering options
I’ll be happy to extend the description or the script accordingly!
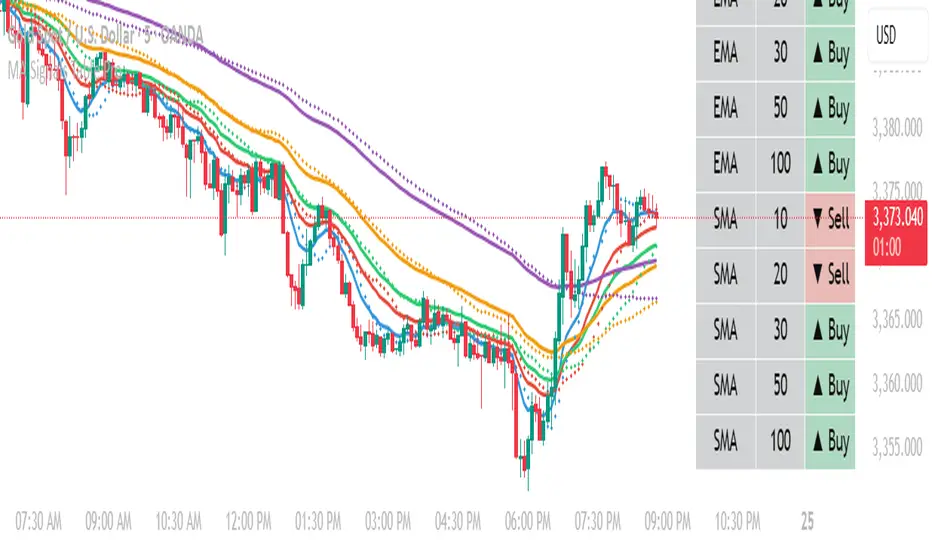
MA Table [RanaAlgo]The "MA Table " indicator is a comprehensive and visually appealing tool for tracking moving average signals in TradingView. Here's a short summary of its usefulness:
Key Features:
Dual MA Support:
Tracks both EMA (Exponential Moving Average) and SMA (Simple Moving Average) signals (10, 20, 30, 50, 100 periods).
Users can toggle visibility for EMA/SMA separately.
Clear Signal Visualization:
Displays Buy (▲) or Sell (▼) signals based on price position relative to each MA.
Color-coded (green for buy, red for sell) for quick interpretation.
Customizable Table Design:
Adjustable position (9 placement options), colors, text size, and border styling.
Alternating row colors improve readability.
Optional MA Plots:
Can display the actual MA lines on the chart for visual confirmation (with distinct colors/styles).
Usefulness:
Quick Overview: The table consolidates multiple MA signals in one place, saving time compared to checking each MA individually.
Trend Confirmation: Helps confirm trend strength when multiple MAs align (e.g., price above all MAs → strong uptrend).
Flexible: Suitable for both short-term (10-20 period) and long-term (50-100 period) traders.
Aesthetic: Professional design enhances chart clarity without clutter.
Ideal For:
Traders who rely on moving average crossovers or price-MA relationships.
Multi-timeframe analysis when combined with other tools.
Beginners learning MA strategies (clear visual feedback).
BE-Indicator Aggregator toolkit█ Overview:
BE-Indicator Aggregator toolkit is a toolkit which is built for those we rely on taking multi-confirmation from different indicators available with the traders. This Toolkit aid's traders in understanding their custom logic for their trade setups and provides the summarized results on how it performed over the past.
█ How It Works:
Load the external indicator plots in the indicator input setting
Provide your custom logic for the trade setup
Set your expected SL & TP values
█ Legends, Definitions & Logic Building Rules:
Building the logic for your trade setup plays a pivotal role in the toolkit, it shall be broken into parts and toolkit aims to understand each of the logical parts of your setup and interpret the outcome as trade accuracy.
Toolkit broadly aims to understand 4 types of inputs in "Condition Builder"
Comments : Line which starts with single quotation ( ' ) shall be ignored by toolkit while understanding the logic.
Note: Blank line space or less than 3 characters are treated equally to comments.
Long Condition: Line which starts with " L- " shall be considered for identifying Long setups.
Short Condition: Line which starts with " S- " shall be considered for identifying Short setups.
Variables: Line which starts with " VAR- " shall be considered as variables. Variables can be one such criteria for Long or short condition.
Building Rules: Define all variables first then specify the condition. The usual declare and assign concept of programming. :p)
Criteria Rules: Criteria are individual logic for your one parent condition. multiple criteria can be present in one condition. Each parameter should be delimited with ' | ' key and each criteria should be delimited with ' , ' (Comma with a space - IMPORTANT!!!)
█ Sample Codes for Conditional Builder:
For Trading Long when Open = Low
For Trading Short when Open = High with a Red candle
'Long Setup <---- Comment
L-O|E|L
' E <- in the above line refers to Equals ' = '
'Short Setup
S-AND:O|E|H, O|G|C
' 2 Criteria for used building one condition. Since, both have to satisfied used "AND:" logic.
Understanding of Operator Legends:
"E" => Refers to Equals
"NE" => Refers to Not Equals
"NEOR" => Logical value is Either Comparing value 1 or Comparing value 2
"NEAND" => Logical value is Comparing value 1 And Comparing value 2
"G" => Logical value Greater than Comparing value 1
"GE" => Logical value Greater than and equal to Comparing value 1
"L" => Logical value Lesser than Comparing value 1
"LE" => Logical value Lesser than and equal to Comparing value 1
"B" => Logical value is Between Comparing value 1 & Comparing value 2
"BE" => Logical value is Between or Equal to Comparing value 1 & Comparing value 2
"OSE" => Logical value is Outside of Comparing value 1 & Comparing value 2
"OSI" => Logical value is Outside or Equal to Comparing value 1 & Comparing value 2
"ERR" => Logical value is 'na'
"NERR" => Logical value is not 'na'
"CO" => Logical value Crossed Over Comparing value 1
"CU" => Logical value Crossed Under Comparing value 1
Understanding of Condition Legends:
AND: -> All criteria's to be satisfied for the condition to be True.
NAND: -> Output of AND condition shall be Inversed for the condition to be True.
OR: -> One of criteria to be satisfied for the condition to be True.
NOR: -> Output of OR condition shall be Inversed for the condition to be True.
ATLEAST:X: -> At-least X no of criteria to be satisfied for the condition to be True.
Note: "X" can be any number
NATLEAST:X: -> Output of ATLEAST condition shall be Inversed for the condition to be True
WASTRUE:X: -> Single criteria WAS TRUE within X bar in past for the condition to be True.
Note: "X" can be any number.
ISTRUE:X: -> Single criteria is TRUE since X bar in past for the condition to be True.
Note: "X" can be any number.
Understanding of Variable Legends:
While Condition Supports 8 Types, Variable supports only 6 Types listed below
AND: -> All criteria's to be satisfied for the Variable to be True.
NAND: -> Output of AND condition shall be Inversed for the Variable to be True.
OR: -> One of criteria to be satisfied for the Variable to be True.
NOR: -> Output of OR condition shall be Inversed for the Variable to be True.
ATLEAST:X: -> At-least X no of criteria to be satisfied for the Variable to be True.
Note: "X" can be any number
NATLEAST:X: -> Output of ATLEAST condition shall be Inversed for the Variable to be True
█ Sample Outputs with Logics:
1. RSI Indicator + Technical Indicator: StopLoss: 2.25 against Reward ratio of 1.75 (3.94 value)
Plots Used in Indicator Settings:
Source 1:- RSI
Source 2:- RSI Based MA
Source 3:- Strong Buy
Source 4:- Strong Sell
Logic Used:
For Long Setup : RSI Should be above RSI Based MA, RSI has been Rising when compared to 3 candles ago, Technical Indicator signaled for a Strong Buy on the current candle, however in last 6 candles Technical indicator signaled for Strong Sell.
Similarly Inverse for Short Setup.
L-AND:ES1|GE|ES2, ES1|G|ES1
L-ES3|E|1
L-OR:ES4 |E|1, ES4 |E|1, ES4 |E|1, ES4 |E|1, ES4 |E|1, ES4 |E|1
S-AND:ES1|LE|ES2, ES1|L|ES1
S-ES4|E|1
S-OR:ES3 |E|1, ES3 |E|1, ES3 |E|1, ES3 |E|1, ES3 |E|1, ES3 |E|1
'Note: Last OR condition can also be written by using WASTRUE definition like below
'L-WASTRUE:6:ES4|E|1
'S-WASTRUE:6:ES3|E|1
Output:
2. Volumatic Support / Resistance Levels :
Plots Used in Indicator Settings:
Source 1:- Resistance
Source 2:- Support
Logic Used:
For Long Setup : Long Trade on Liquidity Support.
For Short Setup : Short Trade on Liquidity Resistance.
'Variable Named "ChkLowTradingAbvSupport" is declared to check if last 3 candles is trading above support line of liquidity.
VAR-ChkLowTradingAbvSupport:AND:L|G|ES2, L |G|ES2, L |G|ES2
'Variable Named "ChkCurBarClsdAbv4thBarHigh" is declared to check if current bar closed above the high of previous candle where the Liquidity support is taken (4th Bar).
VAR-ChkCurBarClsdAbv4thBarHigh:OR:C|GE|H , L|G|H
'Combining Condition and Variable to Initiate Long Trade Logic
L-L |LE|ES2
L-AND:ChkLowTradingAbvSupport, ChkCurBarClsdAbv4thBarHigh
VAR-ChkHghTradingBlwRes:AND:H|L|ES1, H |L|ES1, H |L|ES1
VAR-ChkCurBarClsdBlw4thBarLow:OR:C|LE|L , H|L|L
S-H |GE|ES1
S-AND:ChkHghTradingBlwRes, ChkCurBarClsdBlw4thBarLow
Output 1: Day Trading Version
Output 2: Scalper Version
Output 3: Position Version

xGhozt Pattern StatisticsUnlock the power of candlestick patterns with this comprehensive indicator. It automatically identifies and calculates the historical statistics of popular formations like Large Green/Red, Hammer, Doji, Bullish/Bearish Engulfing patterns.
An insights into each pattern's probability of an 'Up', 'Down', or 'Flat' outcome on the **next bar** and over a user-defined **N subsequent bars**. All statistics are presented in a customizable, interactive table directly on your chart, highlighting the most frequent outcomes. Visual markers are plotted to help you spot patterns instantly.

Cross-Correlation Lead/Lag AnalyzerCross-Correlation Lead/Lag Analyzer (XCorr)
Discover which instrument moves first with advanced cross-correlation analysis.
This indicator analyzes the lead/lag relationship between any two financial instruments using rolling cross-correlation at multiple time offsets. Perfect for pairs trading, market timing, and understanding inter-market relationships.
Key Features:
Universal compatibility - Works with any two symbols (stocks, futures, forex, crypto, commodities)
Multi-timeframe analysis - Automatically adjusts lag periods based on your chart timeframe
Real-time correlation table - Shows current correlation values for all lag scenarios
Visual lead/lag detection - Color-coded plots make it easy to spot which instrument leads
Smart "Best" indicator - Automatically identifies the strongest relationship
How to Use:
Set your symbols in the indicator settings (default: NQ1! vs RTY1!)
Adjust correlation length (default: 20 periods for smooth but responsive analysis)
Watch the colored lines:
• Red/Orange: Symbol 2 leads Symbol 1 by 1-2 periods
• Blue: Instruments move simultaneously
• Green/Purple: Symbol 1 leads Symbol 2 by 1-2 periods
Check the table for exact correlation values and the "Best" relationship
Interpreting Results:
Correlation > 0.7: Strong positive relationship
Correlation 0.3-0.7: Moderate relationship
Correlation < 0.3: Weak/no relationship
Highest line indicates the optimal timing relationship
Popular Use Cases:
Index Futures : NQ vs ES, RTY vs IWM
Sector Rotation : XLF vs XLK, QQQ vs SPY
Commodities : GC vs SI, CL vs NG
Currency Pairs : EURUSD vs GBPUSD
Crypto : BTC vs ETH correlation analysis
Technical Notes:
Cross-correlation measures linear relationships between two time series at different time lags. This implementation uses Pearson correlation with adjustable periods, calculating correlations from -2 to +2 period offsets to detect leading/lagging behavior.
Perfect for quantitative analysts, pairs traders, and anyone studying inter-market relationships.

Volume Delta Pressure Tracker ⚡ by GSK-VIZAG-AP-INDIA📢 Title:
Volume Delta Pressure Tracker ⚡ by GSK-VIZAG-AP-INDIA
📝 Short Description (for script title box):
Real-time volume pressure tracker with estimated Buy/Sell volumes and Delta visualization in an Indian-friendly format (K, L, Cr).
📃 Full Description
🔍 Overview:
This indicator estimates buy and sell volumes using candle structure (OHLC) and displays a real-time delta table for the last N candles. It provides traders with a quick view of volume imbalance (pressure) — often indicating strength behind price moves.
📊 Features:
📈 Buy/Sell Volume Estimation using the candle’s OHLC and Volume.
⚖️ Delta Calculation (Buy Vol - Sell Vol) to detect pressure zones.
📅 Time-stamped Table displaying:
Time (HH:MM)
Buy Volume (Green)
Sell Volume (Red)
Delta (Color-coded)
🔢 Indian Number Format (K = Thousands, L = Lakhs, Cr = Crores).
🧠 Fully auto-calculated — no need for tick-by-tick bid/ask feed.
📍 Neatly placed bottom-right table, customizable number of rows.
🛠️ Inputs:
Show Table: Toggle the table on/off
Number of Bars to Show: Choose how many recent candles to include (5–50)
🎯 Use Cases:
Identify hidden buyer/seller strength
Detect volume absorption or exhaustion
✅ Compatibility:
Works on any timeframe
Ideal for intraday instruments like NIFTY, BANKNIFTY, etc.
Ideal for volume-based strategy confirmation.
🖋️ Developed by:
GSK-VIZAG-AP-INDIA

🧠 Aggressive RSI + EMA Strategy with TP/SL⚙️ How It Works
RSI-Based Entries:
Buys when RSI is below 40 (oversold) and trend is up (fast EMA > slow EMA).
Sells when RSI is above 60 (overbought) and trend is down (fast EMA < slow EMA).
Trend Filter:
Uses two EMAs (short/long) to filter signals and avoid trading against momentum.
Risk Management:
Default Take Profit: +1%
Default Stop Loss: -0.5%
This creates a 2:1 reward-to-risk setup.
📊 Backtest Settings
Initial Capital: $10,000
Order Size: 10% of equity per trade (adjustable)
Commission: 0.04% per trade (Binance spot-style)
Slippage: 2 ticks
Tested on: BTC/USDT – 15min timeframe (suitable for high-frequency scalping)
Trade Sample: (Adjust this based on your actual results.)
🔔 Features
Built-in alerts for buy/sell signals
Visual chart plots for entry/exit, RSI, EMAs
Customizable inputs for RSI thresholds, TP/SL %, EMA lengths
💡 Why It’s Unique
Unlike many RSI systems that trade blindly at 70/30 levels, this strategy adds a trend filter to boost signal quality.
The tight TP/SL configuration is tailored for scalpers and intraday momentum traders who prefer quick, consistent trades over long holds.

Zone Levels (Final 888)📌 Zone Levels Indicator – Buy & Sell Zones with Alerts
This script plots clearly defined buy and sell zones on the chart, with custom top/bottom price inputs for each zone. Ideal for traders who want to visually track high-probability reversal or entry areas.
✅ Key Features:
🔧 Fully customizable zones via settings
📏 Extends zones 240 bars to the left and 40 bars to the right
🏷️ Auto-labeled zones with proper price formatting (e.g. 3385–3390)
🔔 Built-in alerts when price enters any zone
🎯 Mid-zone line for key reference level
🟢 Buy Zones:
Buy Z1: 3415–3412
Buy Z2: 3405–3402
Buy Z3: 3400–3397
Buy Z4: 3390–3385
🔴 Sell Zones:
Sell Z1: 3430–3431
Sell Z2: 3434–3436
Sell Z3: 3439–3441
Sell Z4: 3445–3450
This indicator helps discretionary traders who rely on clean visual zones and precise price levels to act confidently without clutter.
Feel free to modify zone values in the settings to match your own strategy or market conditions.
Remark: This script created by AI

Log Return DistributionThis indicator calculates the statistical distribution of logarithmic returns over a user-defined lookback period and visualizes it as a horizontal profile anchored to the most recent opening price.
Lookback Length: The number of recent bars to include in the distribution analysis. A larger value (e.g., 252) provides a long-term statistical view, while a smaller value (e.g., 20) focuses on recent, short-term volatility.
Bins Count: The number of price levels to divide the distribution into. An odd number is recommended (e.g., 31, 51) to ensure a dedicated central line for the 0% return.
Max Line Length: The horizontal length (in bars) of the line representing the most frequent return bin (the mode). This setting scales the entire profile, allowing you to make differences in frequency more or less pronounced visually.

NY Liquidity Reversal - Debug Mode70 percent 1 rate strategy, no red folder news, trades from only 730 to noon, 20 EMA plus voluntarily breakout, 1 and one entry per direction per session per asset
OHLC_DayLibrary "OHLC_Day"
TODO: add library description here
openD(x)
Parameters:
x (int)
highD(x)
Parameters:
x (int)
lowD(x)
Parameters:
x (int)
closeD(x)
Parameters:
x (int)

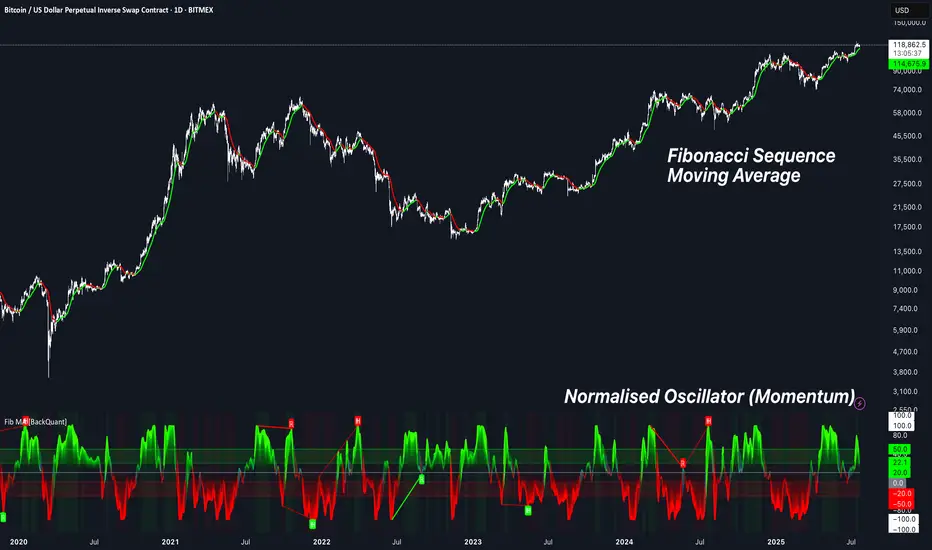
Fibonacci Sequence Moving Average [BackQuant]Fibonacci Sequence Moving Average with Adaptive Oscillator
1. Overview
The Fibonacci Sequence Moving Average indicator is a two‑part trading framework that combines a custom moving average built from the famous Fibonacci number set with a fully featured oscillator, normalisation engine and divergence suite. The moving average half delivers an adaptive trend line that respects natural market rhythms, while the oscillator half translates that trend information into a bounded momentum stream that is easy to read, easy to compare across assets and rich in confluence signals. Everything from weighting logic to colour palettes can be customised, so the tool comfortably fits scalpers zooming into one‑minute candles as well as position traders running multi‑month trend following campaigns.
2. Core Calculation
Fibonacci periods – The default length array is 5, 8, 13, 21, 34. A single multiplier input lets you scale the whole family up or down without breaking the golden‑ratio spacing. For example a multiplier of 3 yields 15, 24, 39, 63, 102.
Component averages – Each period is passed through Simple Moving Average logic to produce five baseline curves (ma1 through ma5).
Weighting methods – You decide how those five values are blended:
• Equal weighting treats every curve the same.
• Linear weighting applies factors 1‑to‑5 so the slowest curve counts five times as much as the fastest.
• Exponential weighting doubles each step for a fast‑reacting yet still smooth line.
• Fibonacci weighting multiplies each curve by its own period value, honouring the spirit of ratio mathematics.
Smoothing engine – The blended average is then smoothed a second time with your choice of SMA, EMA, DEMA, TEMA, RMA, WMA or HMA. A short smoothing length keeps the result lively, while longer lengths create institution‑grade glide paths that act like dynamic support and resistance.
3. Oscillator Construction
Once the smoothed Fib MA is in place, the script generates a raw oscillator value in one of three flavours:
• Distance – Percentage distance between price and the average. Great for mean‑reversion.
• Momentum – Percentage change of the average itself. Ideal for trend acceleration studies.
• Relative – Distance divided by Average True Range for volatility‑aware scaling.
That raw series is pushed through a look‑back normaliser that rescales every reading into a fixed −100 to +100 window. The normalisation window defaults to 100 bars but can be tightened for fast markets or expanded to capture long regimes.
4. Visual Layer
The oscillator line is gradient‑coloured from deep red through sky blue into bright green, so you can spot subtle momentum shifts with peripheral vision alone. There are four horizontal guide lines: Extreme Bear at −50, Bear Threshold at −20, Bull Threshold at +20 and Extreme Bull at +50. Soft fills above and below the thresholds reinforce the zones without cluttering the chart.
The smoothed Fib MA can be plotted directly on price for immediate trend context, and each of the five component averages can be revealed for educational or research purposes. Optional bar‑painting mirrors oscillator polarity, tinting candles green when momentum is bullish and red when momentum is bearish.
5. Divergence Detection
The script automatically looks for four classes of divergences between price pivots and oscillator pivots:
Regular Bullish, signalling a possible bottom when price prints a lower low but the oscillator prints a higher low.
Hidden Bullish, often a trend‑continuation cue when price makes a higher low while the oscillator slips to a lower low.
Regular Bearish, marking potential tops when price carves a higher high yet the oscillator steps down.
Hidden Bearish, hinting at ongoing downside when price posts a lower high while the oscillator pushes to a higher high.
Each event is tagged with an ℝ or ℍ label at the oscillator pivot, colour‑coded for clarity. Look‑back distances for left and right pivots are fully adjustable so you can fine‑tune sensitivity.
6. Alerts
Five ready‑to‑use alert conditions are included:
• Bullish when the oscillator crosses above +20.
• Bearish when it crosses below −20.
• Extreme Bullish when it pops above +50.
• Extreme Bearish when it dives below −50.
• Zero Cross for momentum inflection.
Attach any of these to TradingView notifications and stay updated without staring at charts.
7. Practical Applications
Swing trading trend filter – Plot the smoothed Fib MA on daily candles and only trade in its direction. Enter on oscillator retracements to the 0 line.
Intraday reversal scouting – On short‑term charts let Distance mode highlight overshoots beyond ±40, then fade those moves back to mean.
Volatility breakout timing – Use Relative mode during earnings season or crypto news cycles to spot momentum surges that adjust for changing ATR.
Divergence confirmation – Layer the oscillator beneath price structure to validate double bottoms, double tops and head‑and‑shoulders patterns.
8. Input Summary
• Source, Fibonacci multiplier, weighting method, smoothing length and type
• Oscillator calculation mode and normalisation look‑back
• Divergence look‑back settings and signal length
• Show or hide options for every visual element
• Full colour and line width customisation
9. Best Practices
Avoid using tiny multipliers on illiquid assets where the shortest Fibonacci window may drop under three bars. In strong trends reduce divergence sensitivity or you may see false counter‑trend flags. For portfolio scanning set oscillator to Momentum mode, hide thresholds and colour bars only, which turns the indicator into a heat‑map that quickly highlights leaders and laggards.
10. Final Notes
The Fibonacci Sequence Moving Average indicator seeks to fuse the mathematical elegance of the golden ratio with modern signal‑processing techniques. It is not a standalone trading system, rather a multi‑purpose information layer that shines when combined with market structure, volume analysis and disciplined risk management. Always test parameters on historical data, be mindful of slippage and remember that past performance is never a guarantee of future results. Trade wisely and enjoy the harmony of Fibonacci mathematics in your technical toolkit.
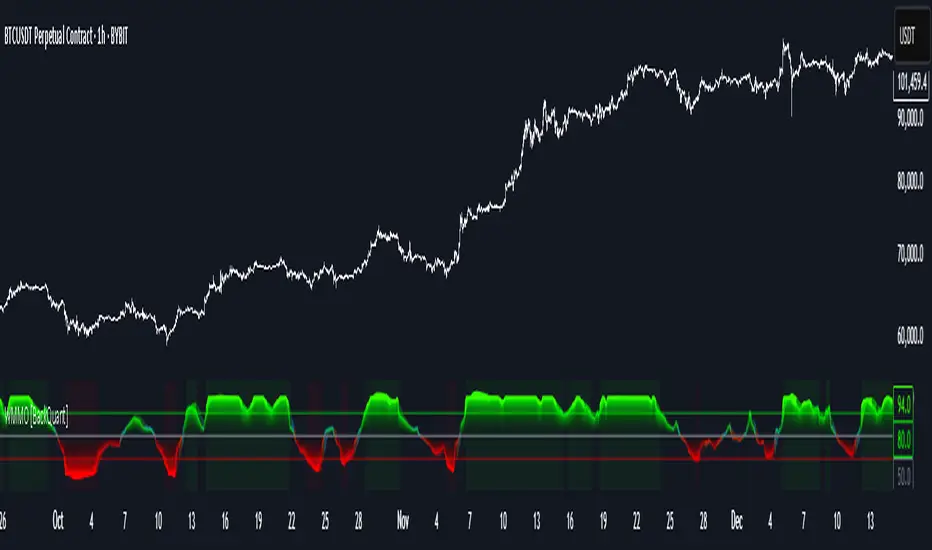
Weighted Multi-Mode Oscillator [BackQuant]Weighted Multi‑Mode Oscillator
1. What Is It?
The Weighted Multi‑Mode Oscillator (WMMO) is a next‑generation momentum tool that turns a dynamically‑weighted moving average into a 0‑100 bounded oscillator.
It lets you decide how each bar is weighted (by volume, volatility, momentum or a hybrid blend) and how the result is normalised (Percentile, Z‑Score or Min‑Max).
The outcome is a self‑adapting gauge that delivers crystal‑clear overbought / oversold zones, divergence clues and regime shifts on any market or timeframe.
2. How It Works
• Dynamic Weight Engine
▪ Volume – emphasises bars with exceptional participation.
▪ Volatility – inverse ATR weighting filters noisy spikes.
▪ Momentum – amplifies strong directional ROC bursts.
▪ Hybrid – equal‑weight blend of the three dimensions.
• Multi‑Mode Smoothing
Choose from 8 MA types (EMA, DEMA, HMA, LINREG, TEMA, RMA, SMA, WMA) plus a secondary smoothing factor to fine‑tune lag vs. responsiveness.
• Normalization Suite
▪ Percentile – rank vs. recent history (context aware).
▪ Z‑Score – standard deviations from mean (statistical extremes).
▪ Min‑Max – scale between rolling high/low (trend friendly).
3. Reading the Oscillator
Zone Default Level Interpretation
Bull > 80 Acceleration; momentum buyers in control
Neutral 20 – 80 Consolidation / no edge
Bear < 20 Exhaustion; sellers dominate
Gradient line/area automatically shades from bright green (strong bull) to deep red (strong bear).
Optional bar‑painting colours price bars the same way for rapid chart scanning.
4. Typical Use‑Cases
Trend Confirmation – Set Weight = Hybrid, Smoothing = EMA. Enter pullbacks only when WMMO > 50 and rising.
Mean Reversion – Weight = Volatility, reduce upper / lower bands to 70 / 30 and fade extremes.
Volume Pulse – Intraday futures: Weight = Volume to catch participation surges before breakout candles.
Divergence Spotting – Compare price highs/lows to WMMO peaks for early reversal clues.
5. Inputs & Styling
Calculation: Source, MA Length, MA Type, Smoothing
Weighting: Volume period & factor, Volatility length, Momentum period
Normalisation: Method, Look‑back, Upper / Lower thresholds
Display: Gradient fills, Threshold lines, Bar‑colouring toggle, Line width & colours
All thresholds, colours and fills are fully customisable inside the settings panel.
6. Built‑In Alerts
WMMO Long – oscillator crosses up through upper threshold.
WMMO Short – oscillator crosses down through lower threshold.
Attach them once and receive push / e‑mail notifications the moment momentum flips.
7. Best Practices
Percentile mode is self‑adaptive and works well across assets; Z‑Score excels in ranges; Min‑Max shines in persistent trends.
Very short MA lengths (< 10) may produce jitter; compensate with higher “Smoothing” or longer look‑backs.
Pair WMMO with structure‑based tools (S/R, trend lines) for higher‑probability trade confluence.
Disclaimer
This script is provided for educational purposes only. It is not financial advice. Always back‑test thoroughly and manage risk before trading live capital.