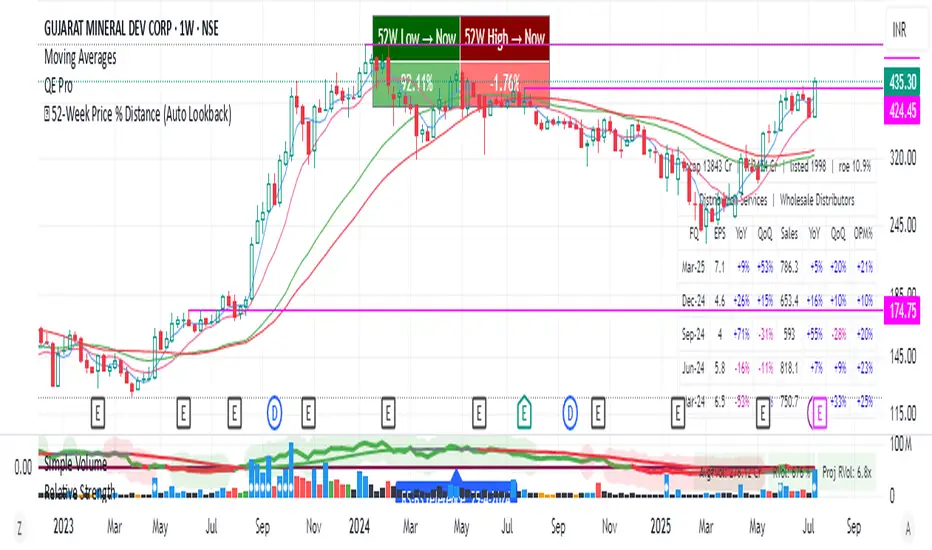
📊 52-Week Price % Distance (Advanced Table)This TradingView Pine Script displays a compact, informative table showing how far the current price is from the 52-week high and low, expressed as percentages.
Statistics
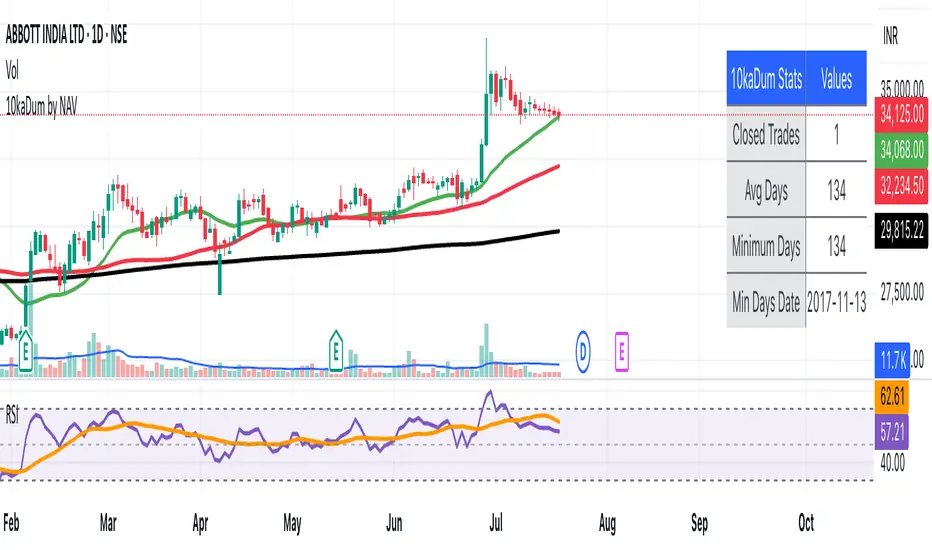
10kaDum by NAVHere's a comprehensive description for publishing your "10kaDum by NAV" script on TradingView:
---
# 🎯 10kaDum by NAV - Advanced SMA Alignment Trading System
**A comprehensive trading strategy that combines SMA alignment signals with intelligent dip-buying and automated profit-taking mechanisms.**
## 📊 Strategy Overview
The 10kaDum system identifies optimal entry and exit points using Simple Moving Average (SMA) alignment patterns, while providing additional opportunities through systematic dip buying and profit taking.
### Core Signals:
🟢 **MAIN BUY**: Triggers when Close < SMA20 < SMA50 < SMA200 (bearish alignment - potential reversal)
🟡 **10kaDum BUY**: Secondary buy signal when price drops 10% after main buy (dollar-cost averaging)
🟠 **10kaDum SELL**: Exit signal when price rises 10% from 10kaDum buy (quick profit taking)
🔴 **MAIN SELL**: Exit signal when Close > SMA20 > SMA50 > SMA200 (bullish alignment - trend reversal)
## 🔥 Key Features
### Smart Signal Management
- **One-time signals**: Each signal triggers only once until the opposite condition occurs
- **No signal spam**: Clean, actionable entries without repetitive alerts
- **Cycle-based logic**: Complete trading cycles from entry to exit
### Performance Analytics
- **Real-time statistics table** with configurable position and styling
- **Closed Trades**: Total number of completed 10kaDum cycles
- **Average Days**: Mean holding period for 10kaDum positions
- **Minimum Days**: Fastest trade completion time
- **Min Days Date**: When the fastest trade occurred
### Advanced Label System
- **Performance metrics**: Days held, gain percentage, and CAGR on exit signals
- **Calendar days calculation**: Accurate time-based performance (not just bars)
- **Anti-overlap positioning**: Smart label placement to avoid chart clutter
- **Fully customizable**: Colors, sizes, and text styling
### Professional Customization
- **Label colors**: Separate color controls for each signal type
- **Table styling**: Full control over fonts, colors, and positioning
- **Position controls**: Precise offset adjustments for optimal visibility
- **Alert system**: Built-in alerts for all signal types
## 📈 Trading Logic
**Entry Strategy:**
1. Wait for bearish SMA alignment (potential bottom)
2. Enter initial position on MAIN BUY
3. Add to position on 10% dips (10kaDum BUY)
**Exit Strategy:**
1. Take quick profits on 10kaDum positions (+10% gain)
2. Hold main position until bullish SMA alignment
3. Full exit on MAIN SELL signal
## 🎨 Visual Elements
- **SMA Lines**: 20, 50, and 200-period moving averages
- **Colored Labels**: Distinct visual signals for each action
- **Statistics Table**: Live performance tracking
- **Clean Design**: Minimal chart clutter with maximum information
## ⚡ Best Practices
- Use on daily or higher timeframes for best results
- Combine with volume analysis for confirmation
- Monitor the statistics table for strategy performance
- Adjust position sizes based on signal type
- Set alerts for hands-free trading
## 🔧 Customization Options
- **9 table positions** (top, middle, bottom × left, center, right)
- **5 font sizes** (tiny to huge)
- **Full color customization** for all elements
- **Adjustable label spacing** for different chart scales
- **Toggle statistics display** on/off
---
**Disclaimer**: This indicator is for educational purposes. Past performance doesn't guarantee future results. Always practice proper risk management and consider your financial situation before trading.
**Created by**: NAV
**Version**: 1.0
**Category**: Strategy / Trend Analysis
---
This description highlights the key features, provides clear usage instructions, and maintains a professional tone suitable for TradingView's marketplace.
AnnualizedReturnCalculatorLibrary "AnnualizedReturnCalculator"
TODO: add library description here
calculateAnnualizedReturn(isStartTime, enableLog)
Parameters:
isStartTime (bool) : 开始时间的BOOL值变量(用于标记策略开始时间)
enableLog (bool) : 是否输出日志
Returns:
返回持仓基准年化收益率、资金基准年化收益率、总收益、平均资金占用

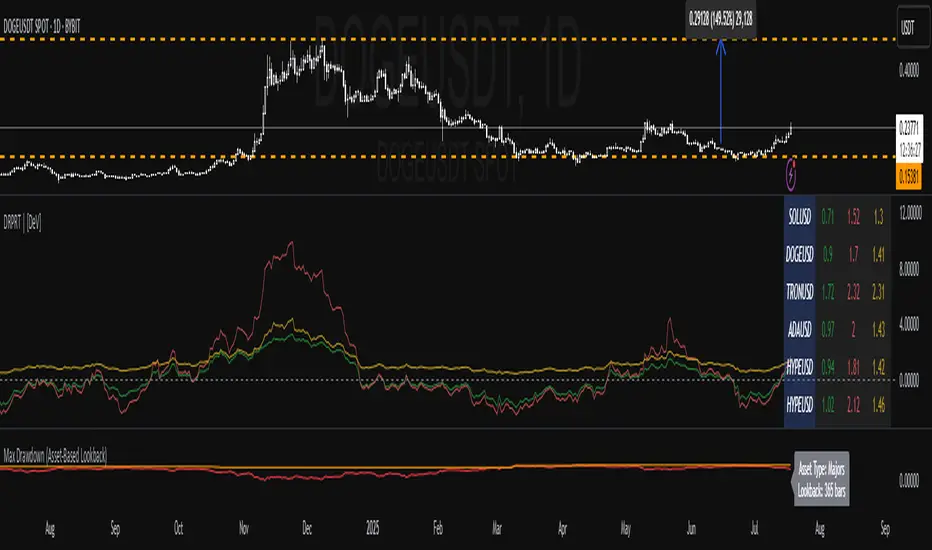
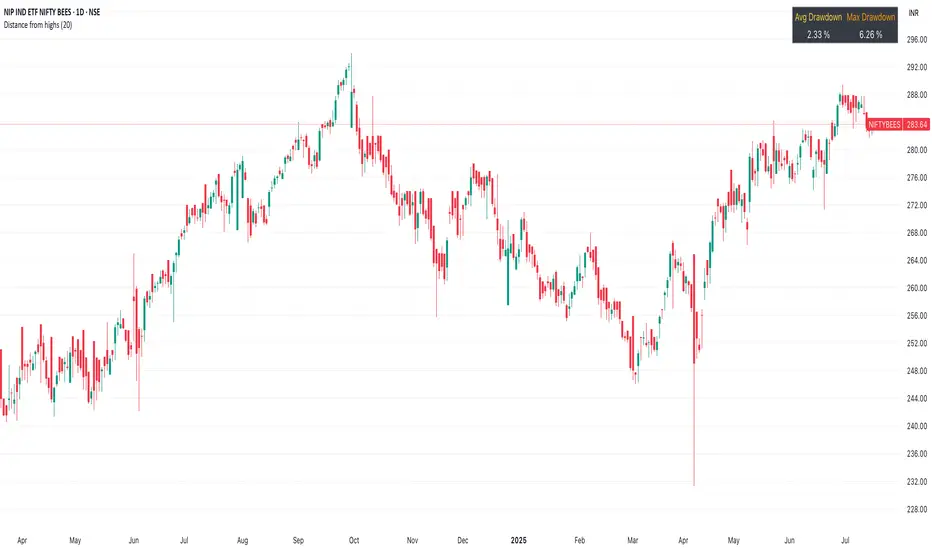
Max Drawdown (Asset-Based Lookback)Max Drawdown (Long-Term Trading)
🟦 Majors BTC, ETH, BNB, LTC 180 – 365
Captures full correction cycles and recovery patterns (6–12 months).
🟩 Altcoins SOL, ADA, DOT, LINK, AVAX 90 – 180
Alts move faster than majors; 3–6 months catches most large swings.
🟥 Meme coins DOGE, SHIB, PEPE, FLOKI 60 – 120
Volatile with quick trend reversals; 2–4 months captures parabolic runs + drawdowns.
📅 Chart Timeframe:
Use Daily (1D) timeframe for all these.
For extra macro insight, try Weekly (1W) with 52 bars (≈ 1 year).
Compare multiple assets using the same period to assess relative risk.
If you're building a long-term portfolio, combine this with:
200-day SMA or EMA for trend context.
Sharpe Ratio or Sortino Ratio if you're looking for risk-adjusted return metrics.
PCR tableOverview
This indicator displays a multi-period table of forward-looking price projections. It combines normalized directional momentum (Positive Change Ratio, PCR) with volatility (ATR) and presents a forecast for upcoming time intervals, adjusted for your local UTC offset.
Concepts & Calculations
Positive Change Ratio (PCR):
((total positive change)/(total change)-0.5)*2, producing a value between –100 and +100.
Synthetic ATR: Calculates average true range over the same lookbacks to capture volatility.
PCR × ATR: Forms a volatility-weighted directional forecast, indicating expected move magnitude.
Future Price Projection: Adds PCR × ATR value to current close to estimate future price at each lookahead interval.
Table Layout
There are 12 forecast horizons—1× to 12× the chart timeframe (e.g., minutes, hours, days). Each row displays:
1. Future Time: Timestamp of each projection (adjustable via UTC offset)
2. PCR: Directional bias per period (–1 to +1)
3. PCR × ATR: E xpected move magnitude
4. Future Price: Close + (PCR × ATR)
High and low PCR×ATR rows are highlighted green for minimum value in the price forecast (buy signal) or red for maximum value in the price forecast (sell signal).
How to Use
1. Set UTC offset to your time zone for accurate future timestamps.
2. View PCR to assess bullish (positive) or bearish (negative) momentum.
3. Use PCR × ATR to estimate move strength and direction.
4. Reference Future Price for potential levels over upcoming intervals, and for buy and sell signals.
Limitations & Disclaimers
* This model uses linear extrapolation based on recent price behavior. It does not guarantee future prices.
* It uses only current bar data and no lookahead logic—compliant with Pine Script rules.
* Designed for analytical insight, not as an automated signal or trade executor.
* Best used on standard bar/candle charts (avoid non-standard types like Heikin‑Ashi or Renko).

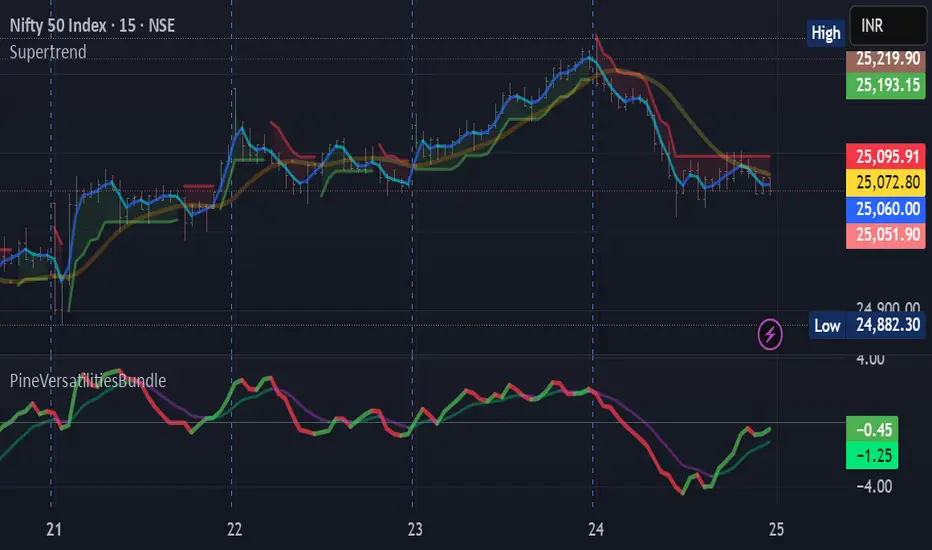
PineVersatilitiesBundleEnhanced the dynamic_MA function by adding five more MA types to the eight existing types.
Added neo_heikin_ashi_ohlc function for Customised or Standard Heikin-Ashi OHLC values tuple.
Library "PineVersatilitiesBundle"
Versatilities (aka, Versatile Utilities) Pack includes:
- Price Variants bundled in a Map,
- Smoothing Variants bundled in a Map,
- Standard and customised Heikin-Ashi values in a tuple,
- Visualisations that plot some indications in the pane and others, including candles/bars, on the chart.
price_variants(lb, hop, op, cl, fmean, hi, lo, mid, pvt, cmean)
Computes Several different averages using current and previous OHLC values
Parameters:
lb (int) : lookback distance for combining OHLC values from the past; optional input, default is 1
hop (int) : skip bars while looking back; optional input, default is 0
op (float) : open value; optional input, default is open
cl (float) : close value; optional input, default is close
fmean (float) : bar average; optional input, default is ohlc4
hi (float) : high value; optional input, default is high
lo (float) : low value; optional input, default is low
mid (float) : range middle; optional input, default is hl2
pvt (float) : active pivot; optional input, default is hlc3
cmean (float) : active average; optional input, default is hlcc4
Returns: Map of, rounded-to-mintick, combinations of single and two-bar OHLC averages
dynamic_MA(masrc, malen, almasgm, almaoff, almaflr, lsmaoff, volfctr)
Dynamically computes Eight different MAs and returns a Map containing Nine MAs
Parameters:
masrc (float) : source series to compute MA
malen (simple int) : lookback distance for MA
almasgm (simple float) : ALMA sigma; optional input, default is 5
almaoff (simple float) : ALMA offset; optional input, default is 0.5
almaflr (simple bool) : ALMA floor flag; optional input, default is false
lsmaoff (simple int) : LSMA offset; optional input, default is 0
volfctr (simple float) : T3/Tilson MA volume factor; optional input, default is 0.5
Returns: Map of, rounded-to-mintick, MAs - 'ALMA', 'DEMA', 'EMA', 'FRAMA', 'HMA', 'LSMA', 'RMA',
'SMA', 'SWMA', 'T3MA', 'TEMA', 'TRIMA', 'WMA', plus an 'ALL' for the average of all other MAs
neo_heikin_ashi_ohlc(customised, standard, op, cl, avbar, hi, lo, avrng, pivot, pvtcl)
Computes customised or standard Heikin Ashi candles/bars OHLC values
Parameters:
customised (bool) : toggle for computing customised Heikin Ashi OHLC; optional input, default is true; ignores standard setting
standard (bool) : toggle for computing standard Heikin Ashi OHLC; optional input, default is false
op (float) : open value; optional input, default is open
cl (float) : close value; optional input, default is close
avbar (float) : bar average; optional input, default is ohlc4
hi (float) : high value; optional input, default is high
lo (float) : low value; optional input, default is low
avrng (float) : range middle; optional input, default is hl2
pivot (float) : active pivot; optional input, default is hlc3
pvtcl (float) : active average; optional input, default is hlcc4
Returns: Tuple of, rounded-to-mintick, Customised or Standard Heikin-Ashi OHLC and its common averages
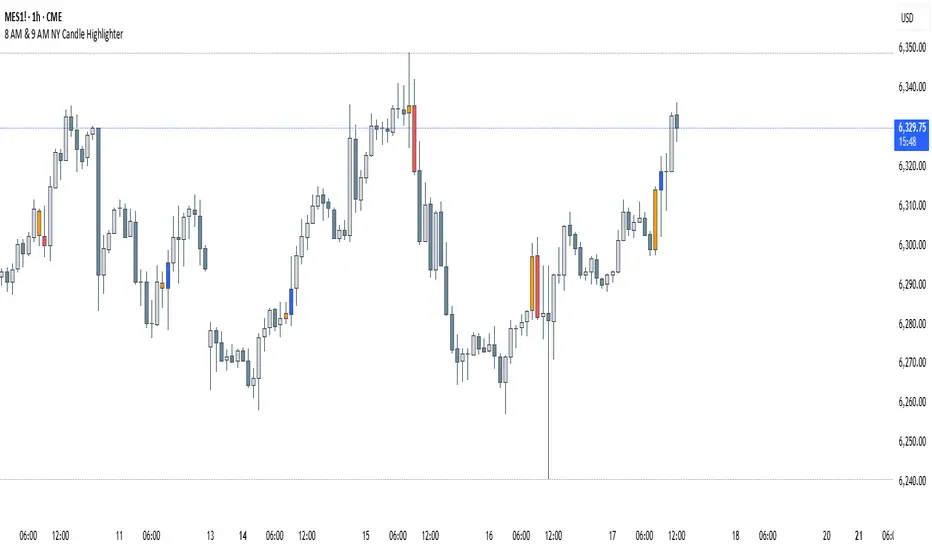
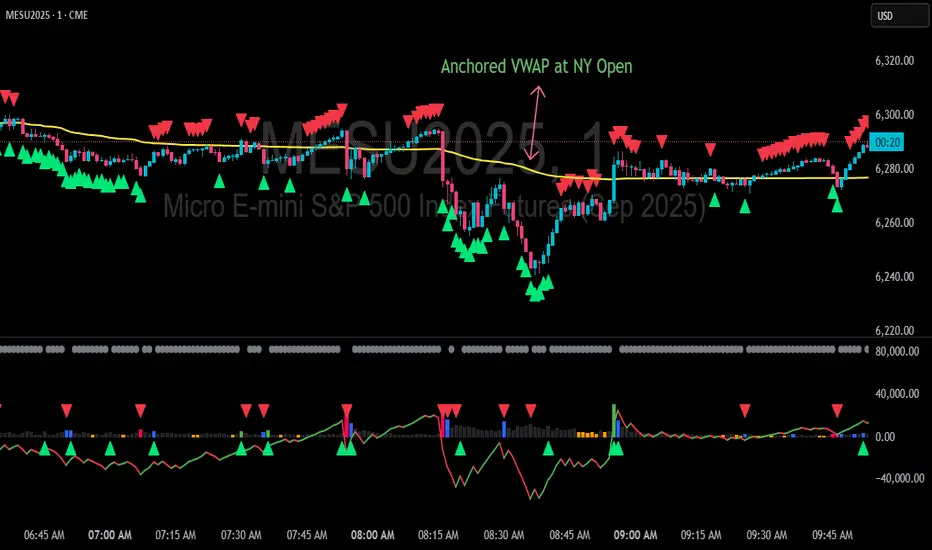
8 AM & 9 AM NY Candle HighlighterThis indicator helps me to know when the 9am NY candle has closed above or below the previous candle.
Orthogonal Projections to Latent Structures (O-PLS)Version 0.1
Orthogonal Projections to Latent Structures (O-PLS) Indicator for TradingView
This indicator, named "Orthogonal Projections to Latent Structures (O-PLS)", is designed to help traders understand the relevance or predictive power of various market variables on the future close price of the asset it's applied to. Unlike standard correlation coefficients that show a simple linear relationship, O-PLS aims to separate variables into "predictive" (relevant to Y) and "orthogonal" (irrelevant noise) components. This Pine Script indicator provides a simplified proxy of the relevance score derived from O-PLS principles.
Purpose of the Indicator
The primary purpose of this indicator is to identify which technical factors (such as price, volume, and other indicators) have the strongest relationship with the future price movement of the current trading instrument. By providing a "relevance score" for each input variable, it helps traders focus on the most influential data points, potentially leading to more informed trading decisions.
Inputs
The indicator offers the following user-definable inputs:
* **Lookback Period:** This integer input (default: 100, min: 10, max: 500) determines the number of past bars used to calculate the relevance scores for each variable. A longer lookback period considers more historical data, which can lead to smoother, less reactive scores but might miss recent shifts in variable importance.
* **External Asset Symbol:** This symbol input (default: `BINANCE:BTCUSDT`) allows you to specify an external asset (e.g., `BINANCE:ETHUSDT`, `NASDAQ:TSLA`) whose close price will be included in the analysis as an additional variable. This is useful for cross-market analysis to see how other assets influence the current chart.
* **Plot Visibility Checkboxes (e.g., "Plot: Open Price Relevance", "Plot: Volume Relevance", etc.):** These boolean checkboxes allow you to toggle the visibility of individual relevance score plots on the chart, helping to declutter the display and focus on specific variables.
Outputs
The indicator provides two main types of output:
Relevance Score Plots: These are lines plotted in a separate pane below the main price chart. Each line corresponds to a specific market variable (Open Price, Close Price, High Price, Low Price, Volume, various RSIs, SMAs, MFI, and the External Asset Close). The value of each line represents the calculated "relevance score" for that variable, typically scaled between 0 and 10. A higher score indicates a stronger predictive relationship with the future close price.
Sorted Relevance Table : A table displayed in the top-right corner of the chart provides a clear, sorted list of all analyzed variables and their corresponding relevance scores. The table is sorted in descending order of relevance, making it easy to identify the most influential factors at a glance. Each variable name in the table is colored according to its plot color, and the external asset's name is dynamically displayed without the "BINANCE:" prefix.
How to Use the Indicator
1. **Add to Chart:** Apply the "Orthogonal Projections to Latent Structures (O-PLS)" indicator to your desired trading chart (e.g., ETH/USDT).
2. **Adjust Inputs:**
* **Lookback Period:** Experiment with different lookback periods to see how the relevance scores change. A shorter period might highlight recent correlations, while a longer one might show more fundamental relationships.
* **External Asset Symbol:** If you trade BTC/USDT, you might add ETH/USDT or SPX as an external asset to see its influence.
3. **Analyze Relevance Scores:**
* **Plots:** Observe the individual relevance score plots over time. Are certain variables consistently high? Do scores change before significant price moves?
* **Table:** Refer to the sorted table on the latest confirmed bar to quickly identify the top-ranked variables.
4. **Incorporate into Strategy:** Use the insights from the relevance scores to:
* Prioritize certain indicators or price actions in your trading strategy. For example, if "Volume" has a high relevance score, it suggests volume confirmation is critical for future price moves.
* Understand the influence of inter-market relationships (via the External Asset Close).
How the Indicator Works
The indicator works by performing the following steps on each bar:
1. **Data Fetching:** It gathers historical data for various price components (open, high, low, close), volume, and calculated technical indicators (SMA, RSI, MFI) for the specified `lookback` period. It also fetches the close price of an `External Asset Symbol` .
2. **Standardization (Z-scoring):** All collected raw data series are standardized by converting them into Z-scores. This involves subtracting the mean of each series and dividing by its standard deviation . Standardization is crucial because it brings all variables to a common scale, preventing variables with larger absolute values from disproportionately influencing the correlation calculations.
3. **Correlation Calculation (Proxy for O-PLS Relevance):** The indicator then calculates a simplified form of correlation between each standardized input variable and the standardized future close price (Y variable) . This correlation is a proxy for the relevance that O-PLS would identify. A high absolute correlation indicates a strong linear relationship.
4. **Relevance Scaling:** The calculated correlation values are then scaled to a range of 0 to 10 to provide an easily interpretable "relevance score" .
5. **Output Display:** The relevance scores are presented both as time-series plots (allowing observation of changes over time) and in a real-time sorted table (for quick identification of top factors on the current bar) .
How it Differs from Full O-PLS
This indicator provides a *simplified proxy* of O-PLS principles rather than a full, mathematically rigorous O-PLS model. Here's why and how it differs:
* **Dimensionality Reduction:** A full O-PLS model would involve complex matrix factorization techniques to decompose the independent variables (X) into components that are predictive of Y and components that are orthogonal (unrelated) to Y but still describe X's variance. Pine Script's array capabilities and computational limits make direct implementation of these matrix operations challenging.
* **Orthogonal Components:** A true O-PLS model explicitly identifies and removes orthogonal components (noise) from the X data that are unrelated to Y. This indicator, in its simplified form, primarily focuses on the direct correlation (relevance) between each X variable and Y after standardization, without explicitly modeling and separating these orthogonal variations.
* **Predictive Model:** A full O-PLS model is ultimately a predictive model that can be used for regression (predicting Y). This indicator, however, focuses solely on **identifying the relevance/correlation of inputs to Y**, rather than building a predictive model for Y itself. It's more of an analytical tool for feature importance than a direct prediction engine.
* **Computational Intensity:** Full O-PLS involves Singular Value Decomposition (SVD) or Partial Least Squares (PLS) algorithms, which are computationally intensive. The indicator uses simpler statistical measures (mean, standard deviation, and direct correlation calculation over a lookback window) that are feasible within Pine Script's execution limits.
In essence, this Pine Script indicator serves as a practical tool for gaining insights into variable relevance, inspired by the spirit of O-PLS, but adapted for the constraints and common use cases of a TradingView environment.

Eliora Gold 1min (Heikin Ashi)Eliora -focused trading strategy designed for anything on the 1-minute timeframe using Heikin Ashi candles. This mode combines advanced market logic with structured risk management to deliver smooth, disciplined trade execution.
Key Features:
✅ Trend Confirmation – Aligns with dominant market direction for higher accuracy.
✅ ATR-Based Volatility Filter – Avoids high-risk conditions and chaotic price action.
✅ Candle Strength Logic – Filters weak setups, focusing on strong momentum.
✅ Balanced Risk/Reward – Calculates stop-loss and take-profit dynamically for consistent results.
✅ Cooldown & Overtrade Protection – Limits frequency to maintain trade quality.
This version of Eliora is built for scalpers and intraday traders seeking high-probability entries with graceful exits.

LiliALHUNTERSystem_v2📚 **Library: LiliALHUNTERSystem_v2**
This library provides a powerful target management system for Pine Script developers.
It includes advanced calculators for EMA, RMA, and Supertrend, and introduces a central `createTargets()` function to dynamically render target lines and labels based on long/short trade logic.
🛠️ **Main Features:**
– Dynamic horizontal & vertical target lines
– Dual target configuration (Target 1 & Target 2)
– Directional logic via `isLong1`, `isLong2`
– Integrated Supertrend validation
– Visual dashboard and label display
– Works seamlessly with custom indicators
🎯 **Purpose:**
The `LiliALHUNTERSystem_v2` Library enables Pine coders to manage and visualize targets consistently across all trading strategies and indicators. It simplifies target logic while maintaining visual clarity and modular usage.
⚠️ **Disclaimer:**
This script is intended for educational and analytical purposes only. It does not constitute financial advice.
Library "LiliALHUNTERSystem_v2"
ema_calc(len, source)
Parameters:
len (simple int)
source (float)
rma_calc(len, source)
Parameters:
len (simple int)
source (float)
supertrend_calc(length, factor)
Parameters:
length (simple int)
factor (float)
createTargets(config, state, source1A, source1B, source2A, source2B)
Parameters:
config (TargetConfig)
state (TargetState)
source1A (float)
source1B (float)
source2A (float)
source2B (float)
showDashboard(state, dashLoc, textSize)
Parameters:
state (TargetState)
dashLoc (string)
textSize (string)
TargetConfig
Fields:
enableTarget1 (series bool)
enableTarget2 (series bool)
isLong1 (series bool)
isLong2 (series bool)
target1Condition (series string)
target2Condition (series string)
target1Color (series color)
target2Color (series color)
target1Style (series string)
target2Style (series string)
distTarget1 (series float)
distTarget2 (series float)
distOptions1 (series string)
distOptions2 (series string)
showLabels (series bool)
showDash (series bool)
TargetState
Fields:
target1LineV (series line)
target1LineH (series line)
target2LineV (series line)
target2LineH (series line)
target1Lbl (series label)
target2Lbl (series label)
target1Active (series bool)
target2Active (series bool)
target1Value (series float)
target2Value (series float)
countTargets1 (series int)
countTgReached1 (series int)
countTargets2 (series int)
countTgReached2 (series int)

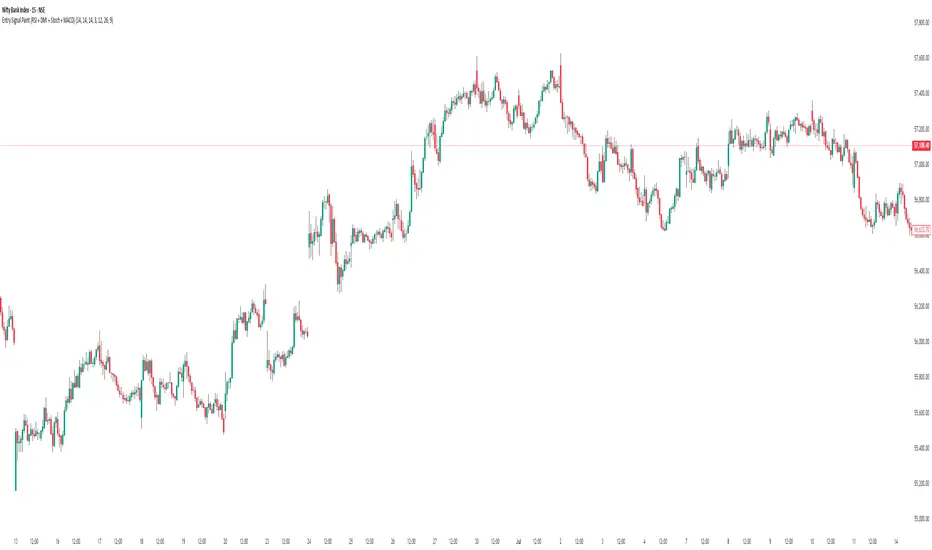
Entry Signal Paint (RSI + DMI + Stoch + MACD)RSI above 60
Stoch - cross overslod
DMI - Ungli
// === RSI Condition ===
rsi = ta.rsi(rsiSource, rsiPeriod)
rsiCondition = rsi > 60
// === ADX and DI Condition ===
adx = ta.adx(adxPeriod)
plusDI = ta.plus_di(adxPeriod)
minusDI = ta.minus_di(adxPeriod)
adxCondition = adx > 15 and plusDI > minusDI
// === Stochastic Condition ===
k = ta.stoch(close, high, low, stochK)
d = ta.sma(k, stochD)
stochOversoldCross = ta.crossover(k, d) and k < 20
ZScore Plot with Ranked TableVersion 0.1
ZScore Plot with Ranked Table — Overview
This indicator visualizes the rolling ZScores of up to 10 crypto assets, giving traders a normalized view of log return deviations over time. It's designed for volatility analysis, anomaly detection, and clustering of asset behavior.
🎯 Purpose
• Show how each asset's performance deviates from its historical mean
• Identify potential overbought/oversold conditions across assets
• Provide a ranked leaderboard to compare asset behavior instantly
⚙️ Inputs
• Lookback: Number of bars to calculate mean and standard deviation
• Asset 1–10: Choose up to 10 symbols (e.g. BTCUSDT, ETHUSDT)
📈 Outputs
• ZScore Lines: Each asset plotted on a normalized scale (mean = 0, SD = 1)
• End-of-Line Labels: Asset names displayed at latest bar
• Leaderboard Table: Ranked list (top-right) showing:
◦ Asset name (color-matched)
◦ Final ZScore (rounded to 3 decimals)
🧠 Use Cases
• Quantitative traders seeking cross-asset momentum snapshots
• Signal engineers tracking volatility clusters
• Risk managers monitoring outliers and systemic shifts

Z-Score Multi-Model ClusteringA price/volume clustering framework combining three market behavior models into a single indicator. Designed to help identify emerging trend strength, turning points, and volatility-driven entries or exits.
🔍 How It Works
This indicator classifies market states by comparing normalized price/volume behavior (via Z-Score) to different types of statistical or geometric "cluster centers." You can choose from three clustering approaches:
🧠 Clustering Models
1. Percentile (Z+CVD) – Trend Momentum Bias
Uses volume Z-Score + Cumulative Volume Delta (CVD).
Detects institutional pressure by clustering volume surges with directional delta.
Best for: Breakouts, momentum trades, volume-led reversals.
Cluster Colors:
🔹 Green triangle = Strong bullish confluence
🔻 Red triangle = Bearish divergence (bull trap risk)
⚪ Gray = Neutral/low conviction
2. Euclidean (Z+Slope) – Swing Mean-Reversion
Measures the angle of recent Z-score slope and compares it to directional cluster centers.
Helps detect early directional shifts or exhaustion.
Best for: Swing entries, pullback setups, exit timing
3. Hilbert Phase – Turn Detection via Signal Phase
Applies Hilbert Transform to the Z-Score, measuring the phase difference between trend and oscillator components.
Ideal for anticipating turns or detecting cyclical inflection points.
Useful for: Scalping, top/bottom spotting, volatility fades
✅ Features
Auto-updating cluster logic based on current data
Tooltips and clean user interface
Optional cluster bar coloring (can be toggled off)
Signal-only plotting keeps candlesticks readable
Clear entry/exit logic with triangle markers
Supports trend, swing, and oscillation-based systems
🛠️ Suggested Use Cases
Combine with VWAP, Session High/Low, or Liquidity Zones to confirm entry conditions.
Use Cluster 2 (strong bullish) on pullbacks to trend structure for add-on entries.
Use Cluster 1 in strong trends to watch for potential traps or exits.
Toggle models based on your strategy: e.g., Hilbert for scalping, Percentile for macro trend breaks.
🧪 Best Timeframes
Works across all markets and timeframes
For Percentile (Z+CVD), use intraday TF with 1m–5m CVD source
Hilbert and Euclidean preferred on 5m–1h for accurate slope/phase signals
⚠️ Notes
Clusters do not generate trade signals alone; use them in context with structure, VWAP, or trend filters.
Marker signals are filtered with a magnitude threshold to reduce noise.
Multi-Crypto Principal Component AnalysisVersion 0.2
## 📌 Multi-Crypto Principal Component Analysis (PCA) — Indicator Summary
### 🎯 Purpose
This indicator identifies **cryptocurrency assets that are behaving differently** from the rest of the market, using a simplified approach inspired by Principal Component Analysis (PCA). It’s designed to help traders spot **cross-market divergences**, detect outliers, and improve asset selection and correlation-based strategies.
### ⚙️ How It Works
The indicator analyzes the **log returns** of up to 7 user-defined assets over a configurable lookback period (default: 100 bars). It computes the **z-score** (standardized deviation) for each asset’s return series and compares it against the average behavior of the group.
If an asset’s behavior deviates significantly (beyond a threshold of 1.5 standard deviations), it’s flagged as an **outlier**.
- Each outlier is plotted as a **colored dot horizontally spaced** above the price bar
- Up to **3 dots per bar** are shown for visual clarity
This PCA-style detection works in real time, directly on the chart, and gives you a quick overview of which assets are breaking correlation.
### 🔧 Inputs
- 🕒 **Lookback Period**: Number of bars to analyze (default: 100)
- 🔢 **Assets 1–7**: Choose any 7 crypto symbols from any exchange
- 🎨 **Colors**: Predefined per asset (e.g. BTCUSDT = red, ETHUSDT = yellow)
- 📈 **Threshold**: Internal (1.5 std dev); adjustable in code if needed
### 📊 Outputs
- 🟢 Dots above candles representing assets that are acting as outliers
- 🧠 Real-time clustering insight based on statistical deviation
- 🧭 Spatially spaced dots to avoid visual overlap when multiple outliers appear
### ⚠️ Limitations
- This is a **PCA-inspired approximation**, not true matrix-based PCA
- It does **not compute principal components or eigenvectors**
- Sensitivity may vary with asset volatility or sparse trading data
- Real PCA requires external tools like Python or R for full dimensional analysis
This tool is ideal for traders who want real-time crypto correlation insights without needing external data science platforms. It’s lightweight, fast, and highly visual — and gives you a powerful lens into market dislocations across multiple assets.

80% Rule BacktestStrategy Overview: 80% Rule Backtest Tool
This strategy tester is designed to validate the classic 80% Rule setup within a defined ETH futures session. Signals are triggered when price reenters the prior day's value area and holds for a qualified duration — targeting the Point of Control (POC) for primary exits, while tracking full value area traversals for research purposes.
- 📅 Session Logic: Anchored to a true 22-hour ETH futures window (5PM–3PM Pacific), with global time zone support
- 🧠 Signal Confirmation: Price must reenter and hold inside value area for ≥ 45 minutes to validate entry
Note: Optimized for 15-minute charts — aligns exactly with traditional rule definition (3-bar hold)
- 🎯 Targets: Primary TP at POC; visual logs for full VAH/VAL reach
- 🔍 Manual Override Mode: Precise SVP-level control when auto logic isn’t preferred
- 🔧 Debug Mode: Single-bar diagnostic labels for development and forward testing
This tool supports both auto-calculated and manually anchored value areas, allowing traders to blend systematic backtesting with discretionary insight.
working on this tool to be used as a strategy tester

Multi-TF Z-Score IndicatorIndicator to find the Z score for the daily 4h, 1h, 15m and 5 min time frames with 20 previous samples.

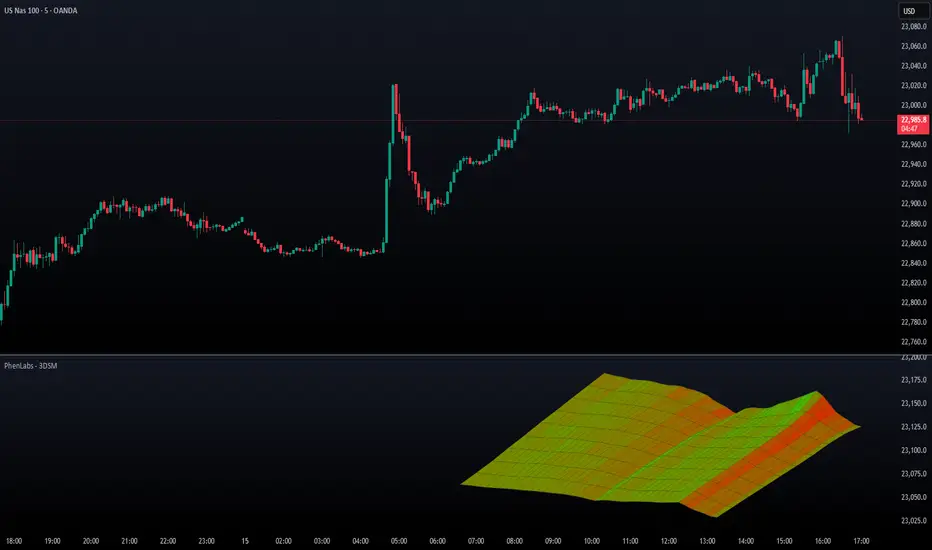
3D Surface Modeling [PhenLabs]📊 3D Surface Modeling
Version: PineScript™ v6
📌 Description
The 3D Surface Modeling indicator revolutionizes technical analysis by generating three-dimensional visualizations of multiple technical indicators across various timeframes. This advanced analytical tool processes and renders complex indicator data through a sophisticated matrix-based calculation system, creating an intuitive 3D surface representation of market dynamics.
The indicator employs array-based computations to simultaneously analyze multiple instances of selected technical indicators, mapping their behavior patterns across different temporal dimensions. This unique approach enables traders to identify complex market patterns and relationships that may be invisible in traditional 2D charts.
🚀 Points of Innovation
Matrix-Based Computation Engine: Processes up to 500 concurrent indicator calculations in real-time
Dynamic 3D Rendering System: Creates depth perception through sophisticated line arrays and color gradients
Multi-Indicator Integration: Seamlessly combines VWAP, Hurst, RSI, Stochastic, CCI, MFI, and Fractal Dimension analyses
Adaptive Scaling Algorithm: Automatically adjusts visualization parameters based on indicator type and market conditions
🔧 Core Components
Indicator Processing Module: Handles real-time calculation of multiple technical indicators using array-based mathematics
3D Visualization Engine: Converts indicator data into three-dimensional surfaces using line arrays and color mapping
Dynamic Scaling System: Implements custom normalization algorithms for different indicator types
Color Gradient Generator: Creates depth perception through programmatic color transitions
🔥 Key Features
Multi-Indicator Support: Comprehensive analysis across seven different technical indicators
Customizable Visualization: User-defined color schemes and line width parameters
Real-time Processing: Continuous calculation and rendering of 3D surfaces
Cross-Timeframe Analysis: Simultaneous visualization of indicator behavior across multiple periods
🎨 Visualization
Surface Plot: Three-dimensional representation using up to 500 lines with dynamic color gradients
Depth Indicators: Color intensity variations showing indicator value magnitude
Pattern Recognition: Visual identification of market structures across multiple timeframes
📖 Usage Guidelines
Indicator Selection
Type: VWAP, Hurst, RSI, Stochastic, CCI, MFI, Fractal Dimension
Default: VWAP
Starting Length: Minimum 5 periods
Default: 10
Step Size: Interval between calculations
Range: 1-10
Visualization Parameters
Color Scheme: Green, Red, Blue options
Line Width: 1-5 pixels
Surface Resolution: Up to 500 lines
✅ Best Use Cases
Multi-timeframe market analysis
Pattern recognition across different technical indicators
Trend strength assessment through 3D visualization
Market behavior study across multiple periods
⚠️ Limitations
High computational resource requirements
Maximum 500 line restriction
Requires substantial historical data
Complex visualization learning curve
🔬 How It Works
1. Data Processing:
Calculates selected indicator values across multiple timeframes
Stores results in multi-dimensional arrays
Applies custom scaling algorithms
2. Visualization Generation:
Creates line arrays for 3D surface representation
Applies color gradients based on value magnitude
Renders real-time updates to surface plot
3. Display Integration:
Synchronizes with chart timeframe
Updates surface plot dynamically
Maintains visual consistency across updates
🌟 Credits:
Inspired by LonesomeTheBlue (modified for multiple indicator types with scaling fixes and additional unique mappings)
💡 Note:
Optimal performance requires sufficient computing resources and historical data. Users should start with default settings and gradually adjust parameters based on their analysis requirements and system capabilities.
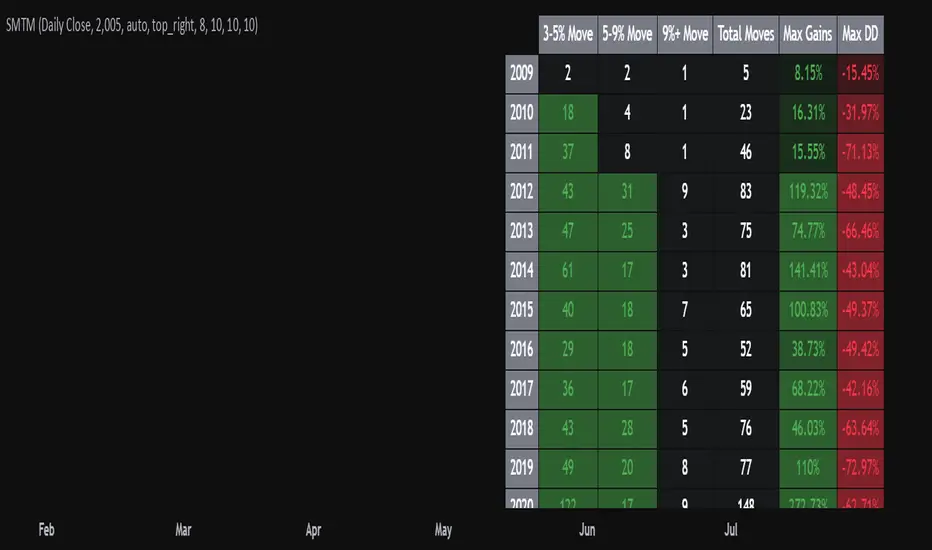
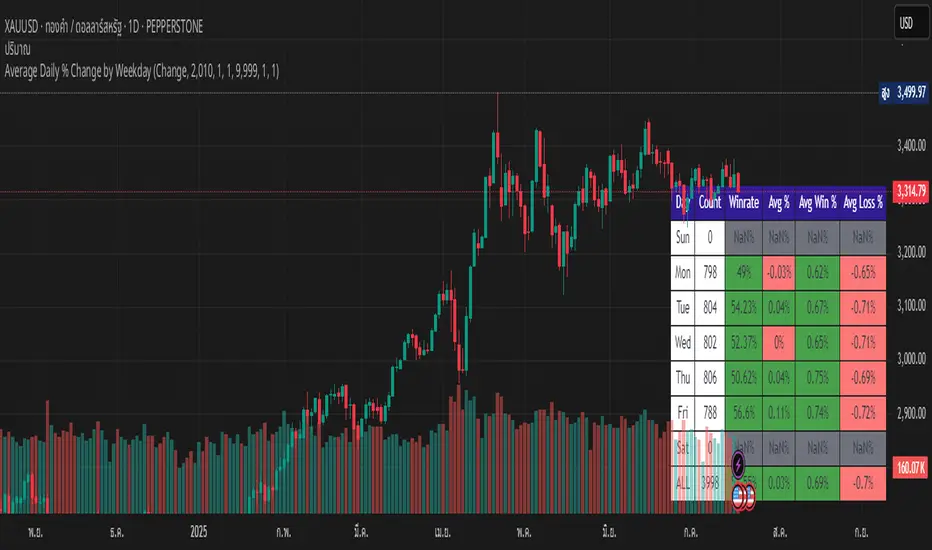
Average Daily % Change by Weekday📊 Average Daily % Change by Weekday
This script calculates and displays the average daily percentage change for each weekday (Monday through Sunday) based on historical price data. It helps traders analyze which days tend to be bullish or bearish over a selected backtest date range.
✅ Features:
Customizable date range (From Year/Month/Day to To Year/Month/Day)
Calculates average % change for each weekday (Mon–Sun)
Supports assets that trade 7 days (e.g., crypto)
Color-coded outputs (green = positive, red = negative)
Final results shown as a table in the bottom-right corner
Works only on the 1D timeframe (daily)
🧠 How it works:
For each day within the selected date range:
The script calculates the % change as: (Close - Open) / Open * 100
Then, it groups the data by weekday and averages the values
This gives you insight into how each day of the week behaves historically for the current asset.
⚠️ Notes:
This script only works on daily (1D) timeframes.
For most accurate results, use it on assets with long trading history (e.g., BTCUSD).
Designed for educational and statistical analysis purposes.
Correlation Coefficient with MA & BB中文版介紹
相關係數、移動平均線與布林帶指標 (Correlation Coefficient with MA & BB)
這個 Pine Script 指標是一款強大的工具,旨在幫助交易者和投資者深入分析兩個市場標的之間的關係強度與方向,並結合移動平均線 (MA) 和布林帶 (BB) 來進一步洞察這種關係的趨勢和波動性。
無論您是想尋找配對交易機會、管理投資組合風險,還是僅僅想更好地理解市場動態,這個指標都能提供有價值的見解。
指標特色與功能:
動態相關係數計算:
您可以選擇任何您想比較的股票、商品或加密貨幣代號(例如,預設為 GOOG)。
指標會自動計算當前圖表(主數據源,預設為收盤價)與您指定標的之間的相關係數。
相關係數值介於 -1 (完美負相關) 至 1 (完美正相關) 之間,0 表示無線性關係。
視覺化呈現相關係數線,並標示 1、0、-1 參考水平線,同時填充完美相關區間,讓您一目了然。
特別之處:程式碼中包含了 ticker.modify,確保比較標的數據考慮了股息調整或延長交易時段,使相關性分析更加精準。
相關係數的移動平均線 (MA):
為了平滑相關係數的短期波動,指標提供了多種移動平均線類型供您選擇,包括:SMA、EMA、WMA、SMMA。
您可以設定計算 MA 的週期長度(預設 20 週期)。
這條 MA 線有助於識別相關係數的長期趨勢,判斷兩者關係是趨於增強還是減弱。
相關係數的布林帶 (BB):
將布林帶應用於相關係數,以衡量其波動性和相對高低水平。
中軌與您選擇的移動平均線保持一致。
上軌和下軌則根據相關係數的標準差和您設定的 Z 值(預設 2.0 倍標準差)動態調整。
布林帶可以幫助您識別相關係數何時處於極端水平,可能預示著未來會回歸均值。
如何運用這個指標?
配對交易策略:當兩個通常高度相關的資產,其相關係數短期內顯著偏離平均水平(例如,一個資產價格上漲而另一個原地踏步),您可能可以考慮利用此「失衡」進行配對交易。
投資組合多元化:了解不同資產之間的相關性,有助於構建更穩健的投資組合,避免過度集中於同向變動的資產,有效分散風險。
市場趨勢洞察:透過觀察相關係數的趨勢和波動,您可以更好地理解不同市場板塊或資產類別之間的聯動性,為您的宏觀經濟分析提供數據支持。
請注意,相關性不等於因果性。使用此指標時,請結合您的整體交易策略、宏觀經濟分析以及其他技術指標進行綜合判斷。
English Version Introduction
Correlation Coefficient with Moving Average & Bollinger Bands Indicator (Correlation Coefficient with MA & BB)
This Pine Script indicator is a powerful tool designed to help traders and investors deeply analyze the strength and direction of the relationship between two market instruments. It integrates Moving Averages (MA) and Bollinger Bands (BB) to further insight into the trend and volatility of this relationship.
Whether you're looking for pair trading opportunities, managing portfolio risk, or simply aiming to better understand market dynamics, this indicator can provide valuable insights.
Indicator Features & Functionality:
Dynamic Correlation Coefficient Calculation:
You can select any symbol you wish to compare (e.g., default is GOOG), be it stocks, commodities, or cryptocurrencies.
The indicator automatically calculates the correlation coefficient between the current chart (main data source, default is close price) and your specified symbol.
Correlation values range from -1 (perfect negative correlation) to 1 (perfect positive correlation), with 0 indicating no linear relationship.
It visually plots the correlation line, marks 1, 0, -1 reference levels, and fills the perfect correlation zone for clear visualization.
Special Feature: The code includes ticker.modify, ensuring that the comparative symbol's data accounts for dividend adjustments or extended trading hours, leading to more precise correlation analysis.
Moving Average (MA) for Correlation:
To smooth out short-term fluctuations in the correlation coefficient, the indicator offers multiple MA types for you to choose from: SMA, EMA, WMA, SMMA.
You can set the length of the MA period (default 20 periods).
This MA line helps identify the long-term trend of the correlation coefficient, indicating whether the relationship between the two instruments is strengthening or weakening.
Bollinger Bands (BB) for Correlation:
Bollinger Bands are applied to the correlation coefficient itself to gauge its volatility and relative high/low levels.
The middle band aligns with your chosen Moving Average.
The upper and lower bands dynamically adjust based on the correlation coefficient's standard deviation and your set Z-score (default 2.0 standard deviations).
Bollinger Bands can help you identify when the correlation coefficient is at extreme levels, potentially signaling a future reversion to the mean.
How to Utilize This Indicator:
Pair Trading Strategies: When two typically highly correlated assets show a significant short-term deviation from their average correlation (e.g., one asset's price rises while the other stagnates), you might consider exploiting this "imbalance" for pair trading.
Portfolio Diversification: Understanding the correlation between different assets helps build a more robust investment portfolio, preventing over-concentration in co-moving assets and effectively diversifying risk.
Market Trend Insight: By observing the trend and volatility of the correlation coefficient, you can better understand the联动 (interconnectedness) between different market sectors or asset classes, providing data support for your macroeconomic analysis.
Please note that correlation does not imply causation. When using this indicator, combine it with your overall trading strategy, macroeconomic analysis, and other technical indicators for comprehensive decision-making.

Kase Convergence Divergence [BackQuant]Kase Convergence Divergence
The Kase Convergence Divergence is a sophisticated oscillator designed to measure directional market strength through the lens of volatility-adjusted log return structures. Inspired by Cynthia Kase’s work on statistical momentum and price projection ranges, this unique indicator offers a hybrid framework that merges signal processing, multi-length sweep logic, and adaptive smoothing techniques.
Unlike traditional momentum oscillators like MACD or RSI, which rely on static moving average differences, KCD introduces a dual-process system combining:
Kase-style statistical range projection (via log returns and volatility),
A sweeping loop of lookback lengths for robustness,
First and second derivative modes to capture both velocity and acceleration of price movement.
Core Logic & Computation
The KCD calculation is centered on two volatility-normalized transforms:
KSDI Up: Measures how far the current high has moved relative to a past low, normalized by return volatility.
KSDI Down: Measures how far the current low has moved relative to a past high, also normalized.
For every length in a user-defined sweep range (e.g., 25–35), both KSDI_up and KSDI_dn are computed, and their maximum values across the loop are retained. The difference between these two max values produces the raw signal:
KPO (Kase Projection Oscillator): Measures directional skew.
KCD (Kase Convergence Divergence): Defined as KPO – MA(KPO) — similar in spirit to MACD but structurally different.
Users can choose to visualize either the first derivative (KPO) , or the second derivative (KCD) , depending on market conditions or strategy style.
Key Features
✅ Multi-Length Sweep Logic: Improves signal reliability by aggregating statistical range projections across a set of lookbacks.
✅ Advanced Smoothing Modes: Supports DEMA, HMA, TEMA, LINREG, WMA and more for dynamic adaptation.
✅ Dual Derivative Modes: Choose between speed (first derivative) or smoothness (second derivative) to fit your trading regime.
✅ Color-Encoded Signal Bands: Heatmap-style oscillator coloring enhances visual feedback on trend strength.
✅ Candlestick Painting: Optional bar coloring makes it easy to spot trend shifts on the main chart.
✅ Adaptive Fill Zones: Green and red fills between the oscillator and zero line help distinguish bullish and bearish regimes at a glance.
Practical Applications
📈 Trend Confirmation: Use KCD as a secondary confirmation layer after breakout or pullback entries.
📉 Momentum Shifts: Crossover and crossunder of the zero line highlight potential regime changes.
📊 Strategy Filters: Incorporate into algos to avoid trendless or mean-reverting environments.
🧪 Derivative Switching: Flip between KPO and KCD modes depending on whether you want to measure acceleration or deceleration of price flow.
Alerts & Signals
Two built-in alerts help you catch regime shifts in real time:
Long Signal: Triggered when the selected oscillator crosses above zero.
Short Signal: Triggered when it crosses below zero.
These events can be used to generate entries, exits, or trend validation cues in multi-layer systems.
Conclusion
The Kase Convergence Divergence goes beyond traditional oscillators by offering a volatility-normalized, derivative-aware signal engine with enhanced visual dynamics. Its sweeping architecture and dynamic fill logic make it especially powerful for identifying trending environments, filtering chop, and adding statistical rigor to your trading toolkit.
Whether you’re a discretionary trader seeking precision, or a quant looking to model more robust return structures, KCD offers a creative yet analytically grounded solution.
