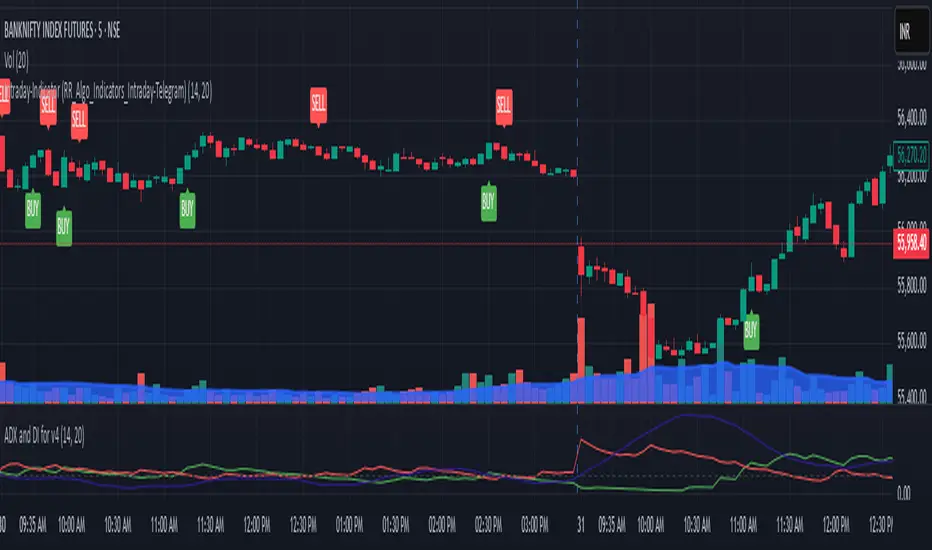
Buy/Sell Labels-RR_AlgoAI (Telegram-RR_Algo_Indicators_Intraday)This indicator uses the Trend Movement to identify shifts in market trend. When the positive movement crosses above the negative, it signals a potential bullish move and marks the chart with a "BUY" label along with a green trend line from the candle's low. Conversely, when Negative movement crosses above Positive Movement, it signals bearish potential, showing a "SELL" label and a red trend line from the candle's high. It also plots the smoothed difference between to show trend strength.
Stockanalysis
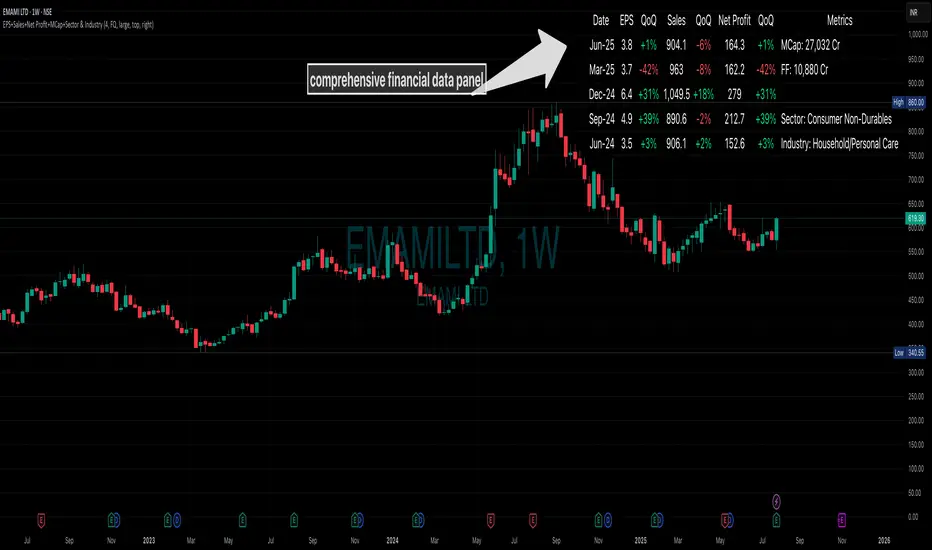
EPS+Sales+Net Profit+MCap+Sector & Industry📄 Full Description
This script displays a comprehensive financial data panel directly on your TradingView chart, helping long-term investors and swing traders make informed decisions based on fundamental trends. It consolidates key financial metrics and business classification data into a single, visually clear table.
🔍 Key Features:
🧾 Financial Metrics (Auto-Fetched via request.financial):
EPS (Earnings Per Share) – Displayed with trend direction (QoQ or YoY).
Sales / Revenue – In ₹ Crores (for Indian stocks), trend change also included.
Net Profit – Also in ₹ Crores, along with percentage change.
Market Cap – Automatically calculated using outstanding shares × price, shown in ₹ Cr.
Free Float Market Cap – Based on float shares × price, also in ₹ Cr.
🏷️ Sector & Industry Info:
Automatically identifies and displays the Sector and Industry of the stock using syminfo.sector and syminfo.industry.
Displayed inline with metrics, making it easy to know what business the stock belongs to.
📊 Table View:
Compact and responsive table shown on your chart.
Columns: Date | EPS | QoQ | Sales | QoQ | Net Profit | QoQ | Metrics
Metrics column dynamically shows:
Market Cap
Free Float
Sector (Row 4)
Industry (Row 5)
🌗 Appearance:
Supports Dark Mode and Mini Mode toggle.
You can also customize:
Number of data points (last 4+ quarters or years)
Table position and size
🎯 Use Case:
This script is ideal for:
Fundamental-focused traders who use EPS/Sales trends to identify momentum.
Swing traders who combine price action with fundamental tailwinds.
Portfolio builders who want to see sector/industry alignment quickly.
It works best with fundamentally sound stocks where earnings and profitability are a major factor in price movements.
✅ Important Notes:
Script uses request.financial which only works with supported symbols (mostly stocks).
Market Cap and Free Float are calculated in ₹ Crores.
All financial values are rounded and formatted for readability (e.g., 1,234 Cr).
🙏 Credits:
Developed and published by Sameer Thorappa
Built with a clean, minimalist approach for high readability and functionality.
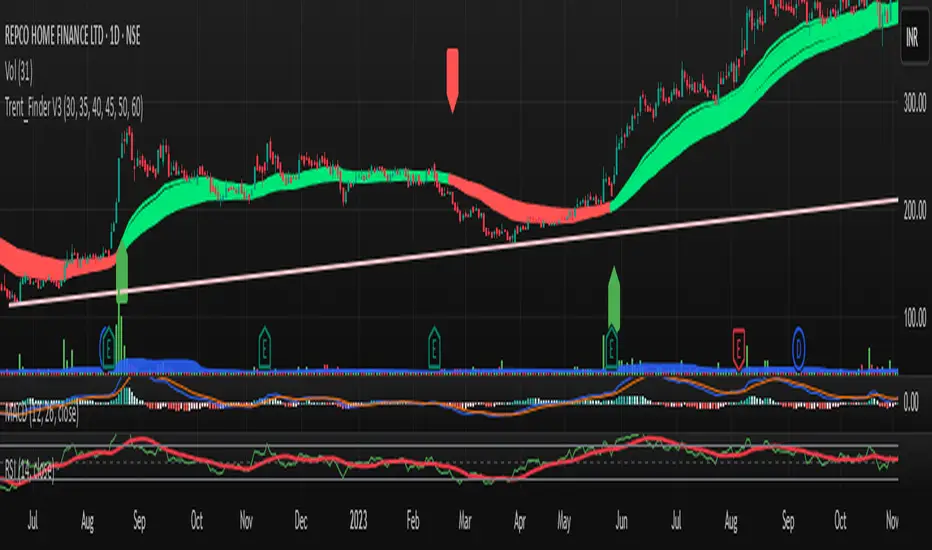
Trent_Finder V3EMA Inputs
It uses 6 EMAs with customizable lengths (defaults: 30, 35, 40, 45, 50, 60).
Trend Conditions
Bullish Trend: All EMAs are strictly ordered from smallest to largest, meaning short-term prices are leading long-term prices upward.
Bearish Trend: All EMAs are ordered from largest to smallest, meaning short-term prices are falling below long-term ones.
Neutral: EMAs are mixed and do not meet the above criteria.
Trend Tracking
The script remembers the current trend and only flips when a full trend reversal condition is confirmed.
Signals
A Buy Signal appears when a bearish or neutral trend changes to bullish.
A Sell Signal appears when a bullish or neutral trend flips to bearish.
Visual Aids
All 6 EMAs are plotted on the chart.
Green Lines = Bullish trend
Red Lines = Bearish trend
Gray Lines = No trend (neutral)
Buy/Sell markers appear at turning points.