Greer Free Cash Flow Yield✅ Title
Greer Free Cash Flow Yield (FCF%) — Long-Term Value Signal
📝 Description
The Greer Free Cash Flow Yield indicator is part of the Greer Financial Toolkit, designed to help long-term investors identify fundamentally strong and potentially undervalued companies.
📊 What It Does
Calculates Free Cash Flow Per Share (FY) from official financial reports
Divides by the current stock price to produce Free Cash Flow Yield %
Tracks a static average across all available financial years
Color-codes the yield line:
🟩 Green when above average (stronger value signal)
🟥 Red when below average (weaker value signal)
💼 Why It Matters
FCF Yield is a powerful metric that reveals how efficiently a company turns revenue into usable cash. This can be a better long-term value indicator than earnings yield or P/E ratios, especially in capital-intensive industries.
✅ Best used in combination with:
📘 Greer Value (fundamental growth score)
🟢 Greer BuyZone (technical buy zone detection)
🔍 Designed for:
Fundamental investors
Value screeners
Dividend and FCF-focused strategies
📌 This tool is for informational and educational use only. Always do your own research before investing.
Stockvaluation

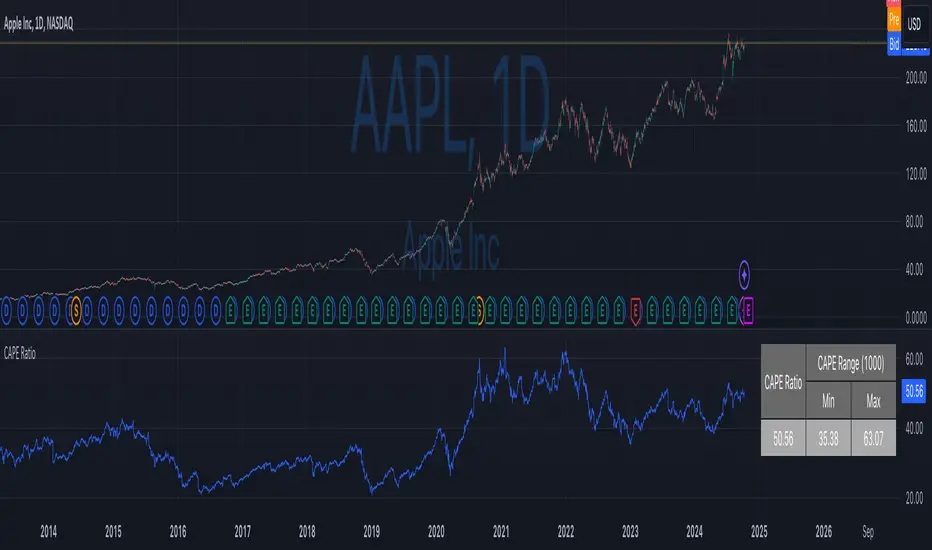
CAPE / Shiller PE RatioThe CAPE (Cyclically Adjusted Price-to-Earnings) or Shiller PE ratio is a popular valuation measure used by investors to assess whether a stock or index is over or undervalued relative to its historical earnings. Unlike the traditional P/E ratio, the CAPE ratio smooths earnings over ten years, adjusting for inflation and providing a more stable and long-term view of valuation.
This indicator lets you quickly calculate and visualize the CAPE ratio for any stock on TradingView, helping you make informed decisions about the sustainability of current price levels. With its clear presentation and intuitive setup, you can compare historical CAPE levels and identify potential opportunities for long-term investments or avoid overvalued markets.
Advantages of the CAPE Ratio:
Long-Term Focus : Smooth earnings over ten years, reducing the impact of short-term volatility.
Inflation-Adjusted : Provides a more precise, inflation-adjusted valuation measure over time.
Historical Comparison : Allows for benchmarking against long-term historical averages.
Market Sentiment Indicator : Can highlight overvalued or undervalued markets for long-term investors.
Reduces Noise : Filters out short-term earnings fluctuations, offering a more stable view.
Disadvantages of the CAPE Ratio:
Ignores Recent Earnings : Misses short-term earnings changes, which can affect current valuations.
Outdated Data : Relies on old earnings data that may not reflect recent company performance.
Less Effective for Growth Stocks : May undervalue high-growth stocks focused on future earnings.
Sector Limitations : Works best for broad markets, less so for fast-changing industries.
Debated Predictive Power : It’s unreliable for timing short-term market movements.
In short, the CAPE ratio is excellent for long-term valuation but has limitations for short-term or growth-focused investing.
Disclaimer
Please remember that past performance may not be indicative of future results.
Due to various factors, including changing market conditions, the strategy may no longer perform as well as in historical backtesting.
This post and the script don’t provide any financial advice.
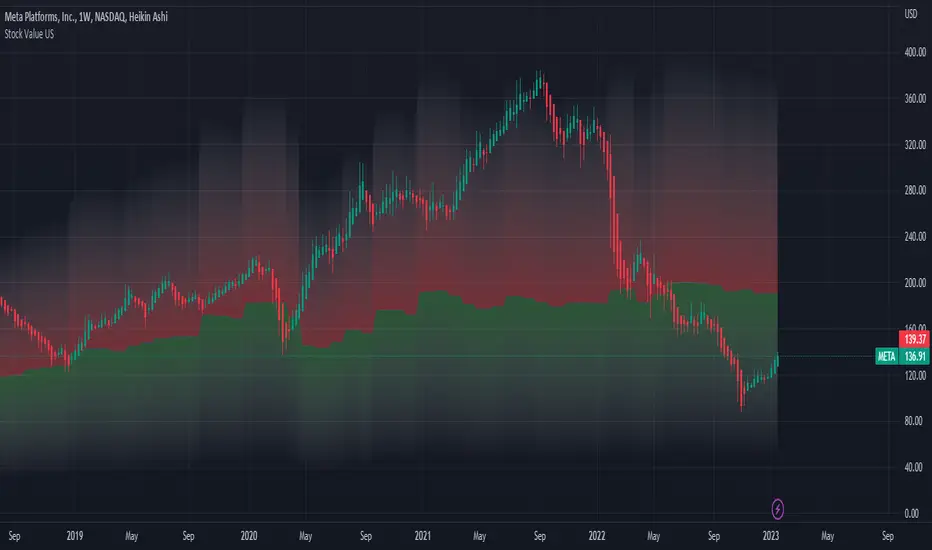
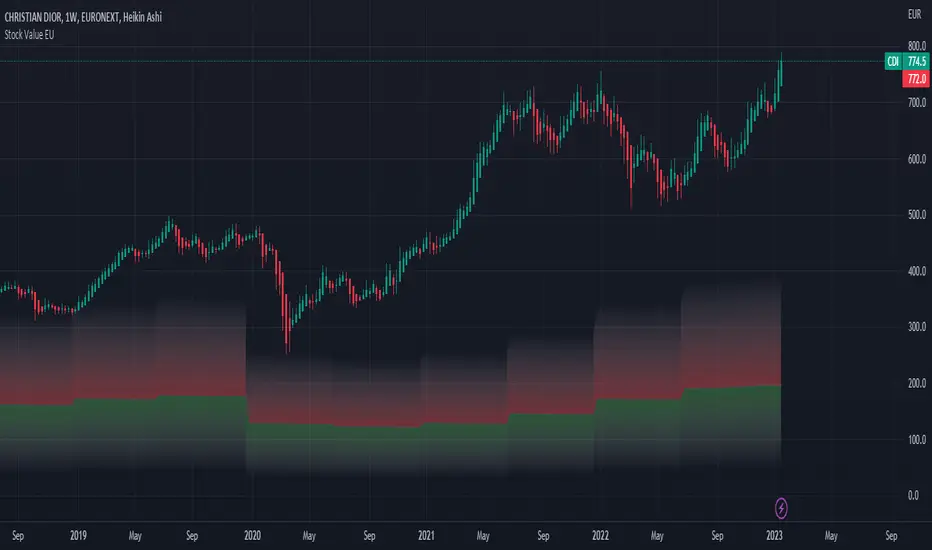
Stock Value EUThere are many method of measuring value of stock. However I'm proposing most basic stock valuation based on Book Value, Earnings , Dividends and Money Supply:
SV = (BVPS + EPS + DPS ) * ( M3 /M1)
BVPS = Book Value Per Share (Asset - Liability)
EPS = Earnings Per Share
DPS = Dividends Per Share
M3 = M3 Money Supply (Money Market)
M1 = M1 Money Supply (Base Money)
Fundamental value of a stock should be determine by it's BV which means total asset of a company if were liquidated today and use some of it's asset to pay of the debt. So technically BVPS is the intrinsic value of a stock. However the company is generating an earning which is profit and loss that should be added on top of the fundamental value of company, so thus EPS should be added on top of Book Value Per Share. Aside from earnings , the stock that you purchase give you dividends as your return so DPS also can be included on top of that. So all in all BVPS, EPS and DPS are the primary valuation of the stock. However most of the stock are traded way higher than their fundamental valuation. The main reason of this is the market dynamics which is driven by central banks printing of base money supply M0. The banking credit system then lend out this money to money markets as loan so that peoples can invest and by the company stock. This money supply extension of credit is known as money market M2 which drive the stock inflated price. The ratio between M2 and M0 are the money multiplier effect that drives the stock price higher than it's valuation. So the Stock Value should be the total number of BVPS + EPS + DPS times the M2 money multiplier as shown by this indicator.
If the stock are traded above their SV value, that means it's an overpriced bubble
If the stock are traded below their SV value, that means it's an underpriced burst
This indicator is only applicable for EU based stock chart, because we use EU money supply to do the money multiplier calculation. For other country stocks take a look our other indicator:
- Stock Value EU - applicable for European stocks
- Stock Value CN - applicable for Chinese stocks
- Valuation Rainbow - applicable for all countries
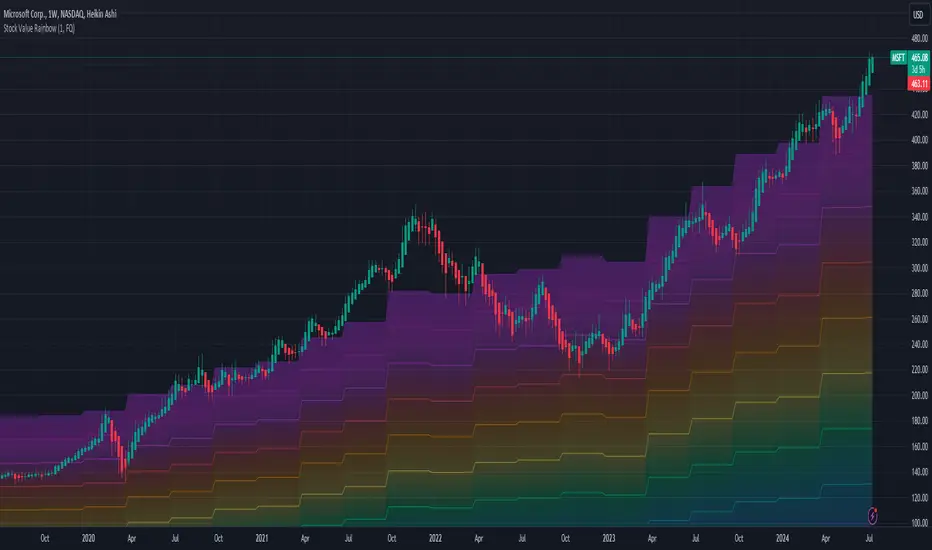
Valuation RainbowValuation Rainbow
© danny_peanuts
Stock value based on Book Value, Earnings, Dividends and Money Multiplier
SV = (BVPS + EPS + DPS) * MM
BVPS = Book Value Per Share
EPS = Earnings Per Share
DPS = Dividends Per Share
MM = Money Multiplier - Integer Number from 1,2,3, ... ,7
There are multiple ways of valuing the stock. Book value is traditionally used as the basic valuation since it's calculate the total asset value minus the liabilities of any company. There are valuation based on multiplication of book value, there are valuation based on multiplication of earnings, and valuation based on multiplication of dividends. Here I'm proposing valuation based on all of these combined. So this indicator is measuring stock value based on multiplication of book value plus earning plus dividend per share. Since the money supply could have an multiplication effect so does the stock value could have a multiplication effect. Also notes that some blue chips stock tends to value higher than startup stock due to money is not equally distributed. So for simplicity I will use simple integer number to represent this multiplication effect as rainbow color plots, thus it can be applied to any stock at any given countries. The higher the stock price on valuation bands the most expensive it is and the lower the price on valuation bands the cheaper it is.
Stock Value - How Much Stock Should Worth?Stock Value
© danny_peanuts
There are many method of measuring value of stock. However I'm proposing most basic stock valuation based on Book Value, Earnings, Dividends and Money Supply:
SV = (BVPS + EPS + DPS) * (M2/M0)
BVPS = Book Value Per Share (Asset - Liability)
EPS = Earnings Per Share
DPS = Dividends Per Share
M2 = M2 Money Supply (Money Market)
M0 = M0 Money Supply (Base Money)
Fundamental value of a stock should be determine by it's BV which means total asset of a company if were liquidated today and use some of it's asset to pay of the debt. So technically BVPS is the intrinsic value of a stock. However the company is generating an earning which is profit and loss that should be added on top of the fundamental value of company, so thus EPS should be added on top of Book Value Per Share. Aside from earnings, the stock that you purchase give you dividends as your return so DPS also can be included on top of that. So all in all BVPS, EPS and DPS are the primary valuation of the stock. However most of the stock are traded way higher than their fundamental valuation. The main reason of this is the market dynamics which is driven by central banks printing of base money supply M0. The banking credit system then lend out this money to money markets as loan so that peoples can invest and by the company stock. This money supply extension of credit is known as money market M2 which drive the stock inflated price. The ratio between M2 and M0 are the money multiplier effect that drives the stock price higher than it's valuation. So the Stock Value should be the total number of BVPS + EPS + DPS times the M2 money multiplier as shown by this indicator.
If the stock are traded above their SV value, that means it's an overpriced bubble
If the stock are traded below their SV value, that means it's an underpriced burst