Amazing Crossover System - 100+ pips per day!I got the main concept for this system on another site. While I have made one important change, I must stress that the heart of this system was created by someone else! We must give credit where credit is due!
Y'all know baby pips. @ForexPhantom published about this system and did both back and forward test around 10 years ago.
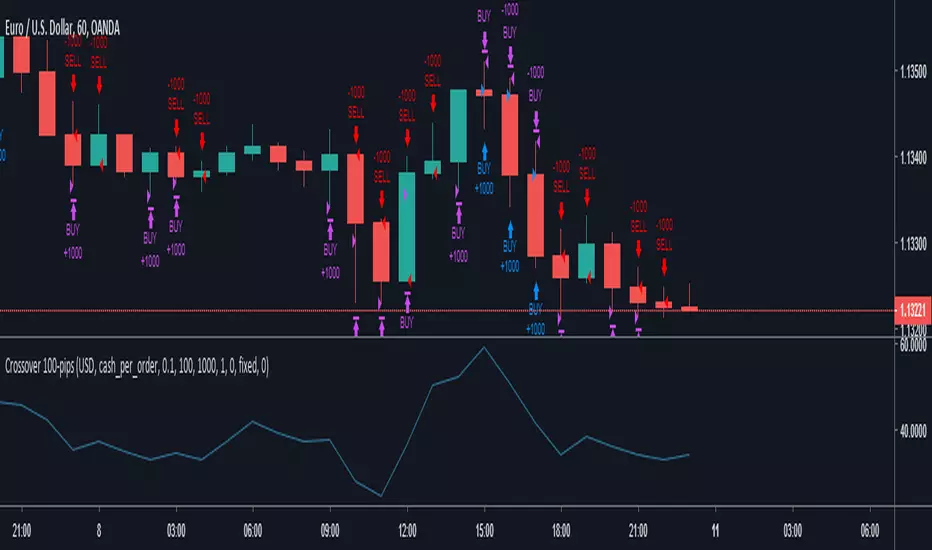
I found it on the sit and now I put it to code to see how it performs. I assume 10 points spread for every trade. I use Renesource or AxiTrader to get the low spreads.
There are 2 mods, the single trades and constant trading on the direction.
Main concept
Indicators
5 EMA -- YELLOW
10 EMA -- RED
RSI (10 - Apply to Median Price: HL/2) -- One level at 50.
TIME FRAME
1 Hour Only (very important!)
PAIRS
Virtually any pair seems to work as this is strictly technical analysis.
I recommend sticking to the main currencies and avoiding cross currencies (just his preference).
WHEN TO ENTER A TRADE
Enter LONG when the Yellow EMA crosses the Red EMA from underneath.
RSI must be approaching 50 from the BOTTOM and cross 50 to warrant entry.
Enter SHORT when the Yellow EMA crosses the Red EMA from the top.
RSI must be approaching 50 from the TOP and cross 50 to warrant entry.
I've attached a picture which demonstrates all these conditions.
That's it!
f.bpcdn.co
Targets
Mayer Multiple v2.0 - Klahr ThresholdThis is a simple update to the Mayer Multiple script by Unbound , which charts an indicator created by Trace Mayer and popularized by Preston Pysh.
The original post identified any price below 2.4x the 100-day MA as the BTC buy threshold. While the logic there is historically sound, it does not account for the fact that the BTC trend is parabolic in nature. With that in mind, I've attempted to update the 2.4x multiple to react based on the moving average of the Mayer Multiple itself. To do so, I simply found the number that, when added to the MM moving average, historically hit the 2.4x multiple during periods of low volatility. This turns out to be 1.17.
The green line represents the Klahr Threshold (is it obnoxious if I call it that? I've always wanted an indicator named after me). As you can see from the above chart, it hovers around 2.4x in late 2012 to early 2013, rises above it until mid 2014, and then stays below until 2016. It then stays almost exactly at 2.4x until April 2017, when it rises significantly above it for the first time since July 2014. The convergence in late 2012 and 2016-2017 is what leads me to believe that this should be the basis for the updated threshold.
It's entirely possible that there's a more robust method of calculating a reactive threshold (or a different number that should be added to the multiple's MA), but I think this is a good first step in refining the multiple to withstand the test of time.
