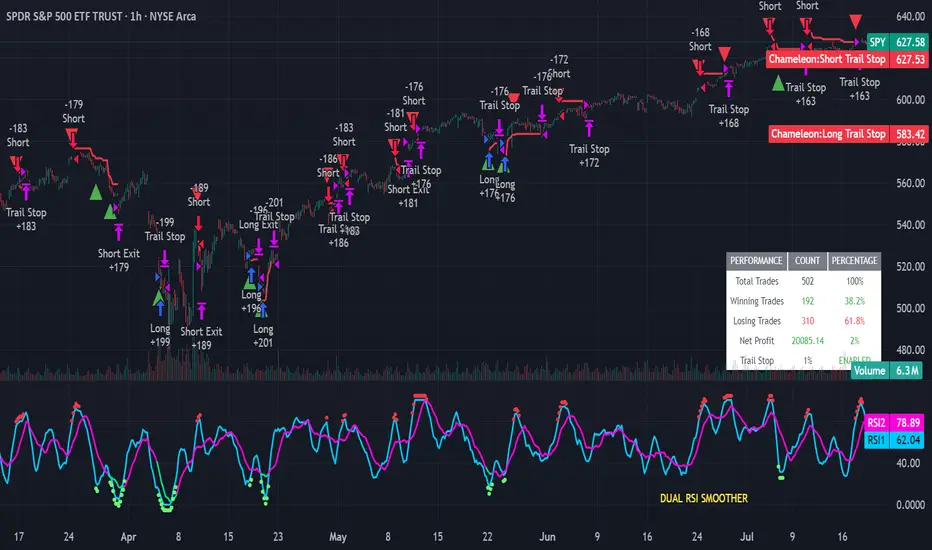
Strategy Chameleon [theUltimator5]Have you ever looked at an indicator and wondered to yourself "Is this indicator actually profitable?" Well now you can test it out for yourself with the Strategy Chameleon!
Strategy Chameleon is a versatile, signal-agnostic trading strategy designed to adapt to any external indicator or trading system. Like a chameleon changes colors to match its environment, this strategy adapts to match any buy/sell signals you provide, making it the ultimate backtesting and automation tool for traders who want to test multiple strategies without rewriting code.
🎯 Key Features
1) Connects ANY external indicator's buy/sell signals
Works with RSI, MACD, moving averages, custom indicators, or any Pine Script output
Simply connect your indicator's signal output to the strategy inputs
2) Multiple Stop Loss Types:
Percentage-based stops
ATR (Average True Range) dynamic stops
Fixed point stops
3) Advanced Trailing Stop System:
Percentage trailing
ATR-based trailing
Fixed point trailing
4) Flexible Take Profit Options:
Risk:Reward ratio targeting
Percentage-based profits
ATR-based profits
Fixed point profits
5) Trading Direction Control
Long Only - Bull market strategies
Short Only - Bear market strategies
Both - Full market strategies
6) Time-Based Filtering
Optional trading session restrictions
Customize active trading hours
Perfect for day trading strategies
📈 How It Works
Signal Detection: The strategy monitors your connected buy/sell signals
Entry Logic: Executes trades when signals trigger during valid time periods
Risk Management: Automatically applies your chosen stop loss and take profit levels
Trailing System: Dynamically adjusts stops to lock in profits
Performance Tracking: Real-time statistics table showing win rate and performance
⚙️ Setup Instructions
0) Add indicator you want to test, then add the Strategy to your chart
Connect Your Signals:
imgur.com
Go to strategy settings → Signal Sources
1) Set "Buy Signal Source" to your indicator's buy output
2) Set "Sell Signal Source" to your indicator's sell output
3) Choose table position - This simply changes the table location on the screen
4) Set trading direction preference - Buy only? Sell only? Both directions?
imgur.com
5) Set your preferred stop loss type and level
You can set the stop loss to be either percentage based or ATR and fully configurable.
6) Enable trailing stops if desired
imgur.com
7) Configure take profit settings
8) Toggle time filter to only consider specific time windows or trading sessions.
🚀 Use Cases
Test various indicators to determine feasibility and/or profitability.
Compare different signal sources quickly
Validate trading ideas with consistent risk management
Portfolio Management
Apply uniform risk management across different strategies
Standardize stop loss and take profit rules
Monitor performance consistently
Automation Ready
Built-in alert conditions for automated trading
Compatible with trading bots and webhooks
Easy integration with external systems
⚠️ Important Notes
This strategy requires external signals to function
Default settings use 10% of equity per trade
Pyramiding is disabled (one position at a time)
Strategy calculates on bar close, not every tick
🔗 Integration Examples
Works perfectly with:
RSI strategies (connect RSI > 70 for sells, RSI < 30 for buys)
Moving average crossovers
MACD signal line crosses
Bollinger Band strategies
Custom oscillators and indicators
Multi-timeframe strategies
📋 Default Settings
Position Size: 10% of equity
Stop Loss: 2% percentage-based
Trailing Stop: 1.5% percentage-based (enabled)
Take Profit: Disabled (optional)
Trade Direction: Both long and short
Time Filter: Disabled
Theultimator5
The Butterfly [theUltimator5]This is a technical analysis tool designed to automatically detect and visualize Butterfly harmonic patterns based on recent market pivot structures. This indicator uses a unique plotting and detection algorithm to find and display valid Butterfly patterns on the chart.
The indicator works in real-time and historically by identifying major swing highs and lows (pivots) based on a user-defined ZigZag length. It then evaluates whether the most recent price structure conforms to the ideal proportions of a bullish or bearish Butterfly pattern. If the ratios between price legs XA, AB, BC, and projected CD meet defined tolerances, the pattern is plotted on the chart along with a projected D point for potential reversal.
Key Features:
Automatic Pivot Detection: The script analyzes recent price action to construct a ZigZag pattern, identifying swing points as potential X, A, B, and C coordinates.
Butterfly Pattern Validation: The pattern is validated against traditional Fibonacci ratios:
--AB should be approximately 78.6% of XA.
--BC must lie between 38.2% and 88.6% of AB.
--CD is projected as a multiple of BC, with user control over the ratio (e.g., 1.618–2.24).
Bullish and Bearish Recognition: The pattern logic detects both bullish and bearish Butterflies, automatically adjusting plotting direction and color themes.
Custom Ratio Tolerance: Users can define how strictly the AB/XA and BC/AB legs must adhere to ideal ratios, using a percentage-based tolerance slider.
Fallback Detection Logic: If a new pattern is not identified in recent bars, the script performs a backward search on the last four pivots to find the most recent valid pattern.
Force Mode: A toggle allows users to force the drawing of a Butterfly pattern on the most recent pivot structure, regardless of whether the ideal Fibonacci rules are satisfied.
Dynamic Visualization:
--Clear labeling of X, A, B, C, and D points.
--Colored connecting lines and filled triangles to visualize structure.
--Optional table displaying key Fibonacci ratios and how close each leg is to ideal values.
Inputs:
Length: Controls the sensitivity of the ZigZag pivots. Smaller values result in more frequent pivots.
Tolerance (%): Adjustable threshold for acceptable deviation in AB/XA and BC/AB ratios.
CD Length Multiplier: Projects point D by multiplying the BC leg using a value between 1.618 and 2.24.
Force New Pattern: Overrides validation checks to display a Butterfly structure on recent pivots regardless of ratio accuracy.
Show Table: Enables a table showing calculated ratios and deviations from the ideal.

Auto Fractal [theUltimator5]This indicator is what I call the Auto Fractal. It is a unique algorithm that looks back in time, finds a segment on the chart that closest matches the recent price action, then projects the price forwards. It effectively finds chart patterns and shows you what the price did the last time the same/similar chart pattern was observed.
Creating an algorithm to match abstract curves to other abstract curves and provide a confidence score was the fundamental problem that needed to be solved in order to create this indicator, which curve matches with surprising accuracy.
The most effective method to "curve match" that I found is the Pearson Coefficient, set by a segment length and a lookback period. After the highest coefficient curve is located, the curve then gets scaled and offset to match the current price.
The past segment is drawn over the current price (orange line), giving a visualization of the two curves and how closely they match each other. The indicator then projects the price forwards in time based on the price action of the chart from the historical segment (dashed fuchsia line).
A bounding box also gets drawn around the historical segment to give you a clear visual of where the price is getting pulled from for proper analysis and ease of use.
The Pearson Coefficient % is shown in a table in the top right-hand corner of the chart and can be toggled off if desired. The values range from -100% (perfectly inverse correlation) to +100% (perfectly correlated) with 0 meaning no correlation whatsoever. The closer to +100% the value is, the better the segment match.
As with most/all of my indicators, user interface and simplicity was at the top of my priority list. I designed this to be easily readable and intuitive to both novice and veteran traders, without cluttering the chart.
Note:
This indicator is extremely heavy in terms of memory usage due to nested for loops, and takes several seconds to initially load the chart overlay. If the lookback period is increased too high (>600) then the indicator may time out and fail to load anything. If nothing loads on the chart, try reducing the lookback length and wait up to 10 seconds for lines to appear.

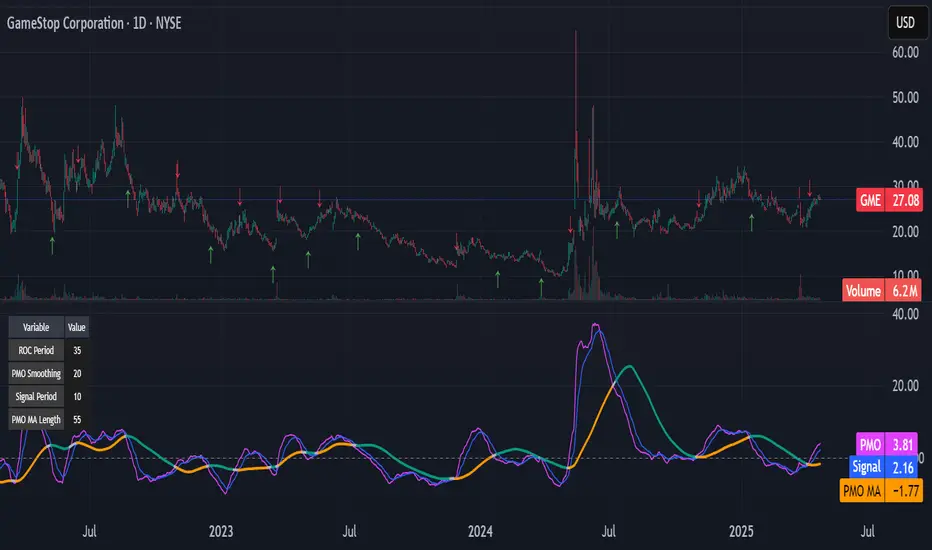
Kitty PMO [theUltimator5]Kitty PMO is a momentum analysis tool designed to visually track and interpret the Price Momentum Oscillator (PMO) — with stylistic influence inspired by the charting approach made popular by “theRoaringKitty.” It aims to offer clear, actionable momentum signals directly overlaid on the chart without clutter or ambiguity, making it ideal for traders who prioritize simplicity and signal clarity.
At its core, the indicator calculates the PMO by applying a custom recursive smoothing function to the rate of change (ROC) of price. This smoothed momentum measure is then:
Amplified by a scaling factor (×10),
Further smoothed using user-defined parameters,
Compared against a signal line (EMA of PMO),
And tracked with a secondary moving average (PMO MA) to capture medium-term trend inflections.
While the PMO and its associated signal lines can optionally be plotted, the indicator primarily emphasizes crossovers between the PMO MA and the other two components. When the PMO MA crosses above both the PMO and signal line, a green upward arrow (↑) is plotted below the price. When it crosses below both, a red downward arrow (↓) appears above the price — making it easy to spot potential turning points in momentum.
Additionally, a floating info table can be toggled on to display all current user-defined parameters in a clean, resizable format. This makes the script ideal not just for technical execution but also for real-time strategy tuning and tracking across multiple timeframes.
The script includes optional alerts so you can be notified the moment a key crossover signal is triggered, without needing to keep your eyes glued to the screen.