Auto Channel [SciQua]Auto Channel
Purpose
Auto Channel finds the single best parallel price channel from recent price action and keeps it updated in real time. It uses ZigZag pivots to build candidate channels, scores each candidate for quality, then plots the winner. When price closes outside the channel, the script flags a breakout and can fire alerts.
How it works
1. ZigZag pivots
The script uses TradingView’s TradingView/ZigZag/7 library to generate a stream of swing highs and lows based on a percentage reversal threshold and a leg depth. These pivots are the only points the channel logic evaluates, which keeps the search fast and focused on structure rather than noise.
2. Channel candidates
From the most recent pivots, the script forms all combinations of two swing highs and two swing lows.
It computes a slope for the high line and a slope for the low line and requires that they be nearly parallel within a user-defined tolerance.
3. Quality scoring and selection
For every valid candidate, the script checks the recent pivot segments against the trial channel and computes:
Inside ratio: fraction of tested pivots that sit fully inside the channel after applying the tolerance buffer.
Violation sum: total magnitude of the breaches for any pivots outside the channel.
Current width: distance between upper and lower lines at the current bar.
The “best” channel is chosen by:
1. highest inside ratio
2. then widest current width
3. then smallest violation sum
4. Plot and projection
The upper and lower lines are anchored to the chosen pivot pairs and extend to the left. The script also projects each line to the current bar to compute the live upper and lower channel prices. Those levels drive the breakout checks and alerts.
5. Breakouts and alerts
A breakout is detected when the bar closes above the projected upper line or closes below the projected lower line, after applying the tolerance buffer. Triangle markers highlight fresh breakouts, and you can enable alert conditions to automate notification or strategy handoff.
Inputs:
ZigZag
Price deviation for reversals (%)
Default 0.2. Larger values produce fewer, larger swings. Smaller values produce more, smaller swings.
Pivot legs
Default 2. Controls the lookback depth ZigZag uses to confirm pivots.
ZigZag Color
Visual only.
Tip: If you are not seeing a stable channel, increase the ZigZag percentage to reduce minor swings.
Channel search
Number of recent pivots to consider
Default 12. Higher values search more history and try more channel combinations. Lower values make the search faster and more reactive.
Max slope difference for parallel
Default 0.0005. Maximum allowed difference between the upper and lower line slopes. Smaller values enforce stricter parallelism.
Max price tolerance outside channel
Default 0.0. A buffer added to the channel boundaries during validation and breakout checks. Use this to ignore tiny wicks that poke the lines.
Minimum inside to outside pivots ratio for valid channel (0.00–1.00)
Default 1.00. Require that at least this fraction of checked pivots lie inside the channel. For a more permissive fit, try 0.60 to 0.85.
Styling
Upper Line Color
Lower Line Color
Breakout Above Color
Breakout Below Color
Plots and visuals
Upper channel line
Lower channel line
Triangle markers on the bar that first confirms a close outside the channel, above or below.
Lines extend left from their pivot anchors. Projection to the current bar is used internally to test for breakouts and to set alerts.
Alerts
The script defines two alert conditions:
Close Above Channel
Triggers when the bar closes above the projected upper line plus tolerance.
Close Below Channel
Triggers when the bar closes below the projected lower line minus tolerance.
Practical usage
Trend channels
In a steady trend, a high inside ratio with a moderate width often highlights the dominant channel. Consider trend entries near the lower line in an uptrend or near the upper line in a downtrend, with exits or stops beyond the opposite boundary.
Breakout trades
Combine the channel breakout alert with volume or a separate momentum filter. The tolerance input helps avoid false triggers from small wicks.
Tuning for timeframe and symbol
• Faster markets or lower timeframes usually benefit from a larger ZigZag percentage and a smaller pivot count.
• Slower markets or higher timeframes can use more pivots and a tighter slope difference to enforce cleaner geometry.
Notes and limitations
Channels are derived from ZigZag pivots. If your ZigZag settings change, the detected channel will also change.
The script plots only the single best channel at any time to keep the chart clean.
Breakout markers appear on confirmed bars. For historical bars, markers appear only where a breakout would have been confirmed at that time.
Lines extend left from their anchors. The script projects the lines internally to the current bar for checks and alerts.
License and attribution
License
Creative Commons Attribution-NonCommercial 4.0 International (CC BY-NC 4.0).
Open source for educational and personal use only. Commercial use requires written permission.
Attribution
© 2025 SciQua — Joshua Danford
Libraries
Uses TradingView/ZigZag/7.
Changelog
v1.0
Initial release. Automatic parallel channel detection from ZigZag pivots, quality scoring, live plotting, and close-based breakout alerts.
FAQ
Why do I not see any channel sometimes?
There may not be a valid pair of highs and lows that pass the slope, inside ratio, and tolerance checks. Loosen the constraints by increasing Max slope difference, lowering Minimum inside ratio, or increasing the ZigZag percentage.
The channel looks too narrow or too wide?
Adjust Number of recent pivots and Minimum inside ratio. A higher inside ratio tends to favor cleaner, sometimes wider channels. A lower ratio may admit narrower, more reactive channels.
How can I reduce false breakout alerts?
Increase Max price tolerance outside channel to ignore small wicks. Add a volume or momentum confirmation in your personal alert workflow.
Thank you for using Auto Channel . Feedback and improvements are welcome.
Trend Analysis

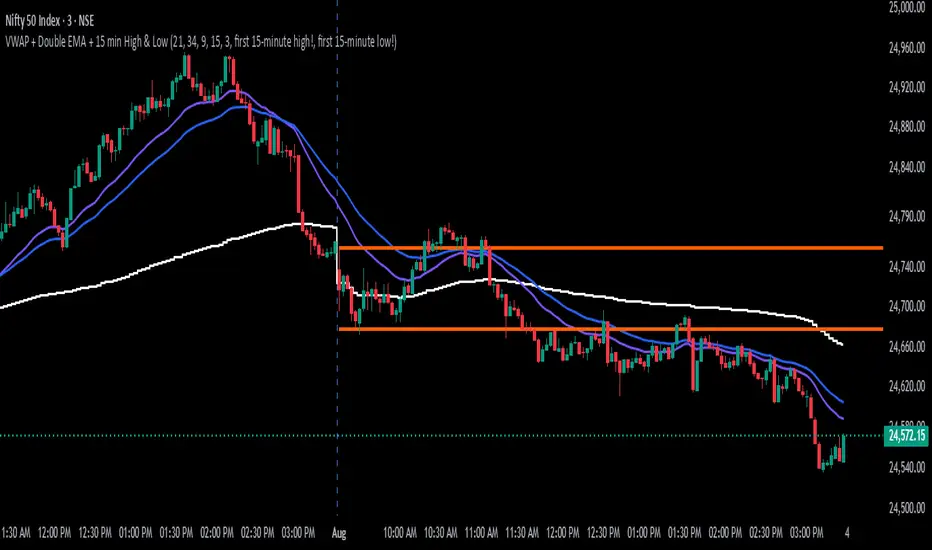
Intraday SmartVWAP + Double EMA + 15 min High & Low
The indicator is for intraday, shows the below.
1. VWAP
2. EMA's
3. First 15 mins High and Low
Recommended time frame is 3 minutes.
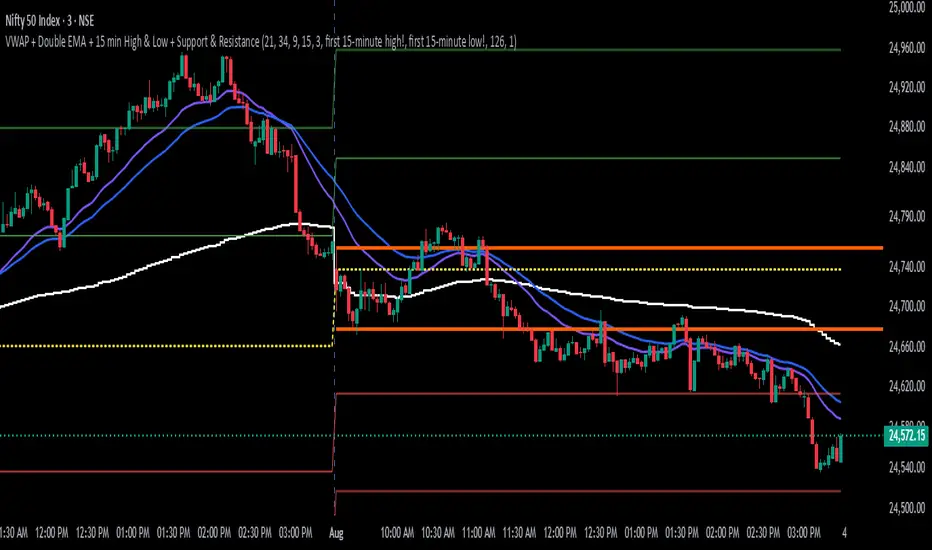
Intraday Smart PlusIntraday Smart Plus
The indicator is for intraday day, shows the below.
1. VWAP
2. Day Open Line
3. First 15 minutes High and Low
4. Support and Resistance Lines
Recommended time frame is 3 minutes
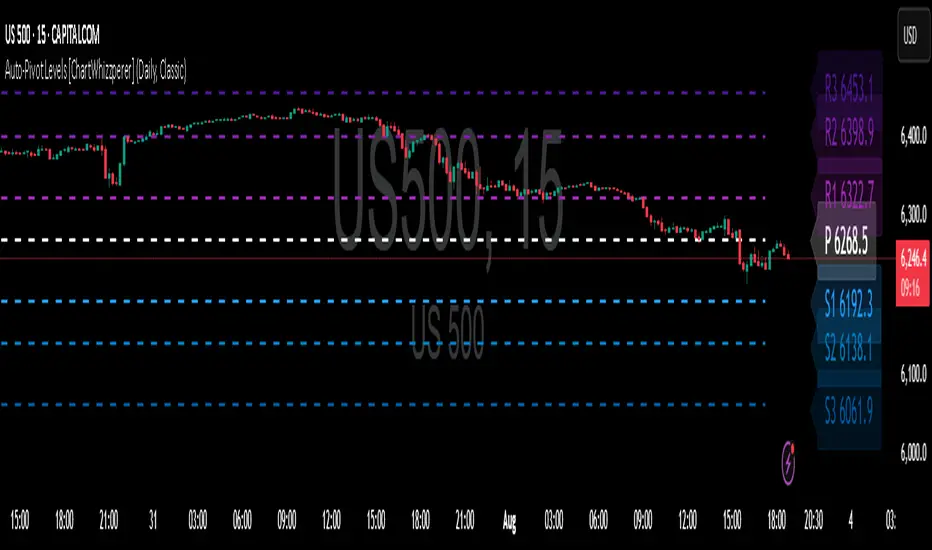
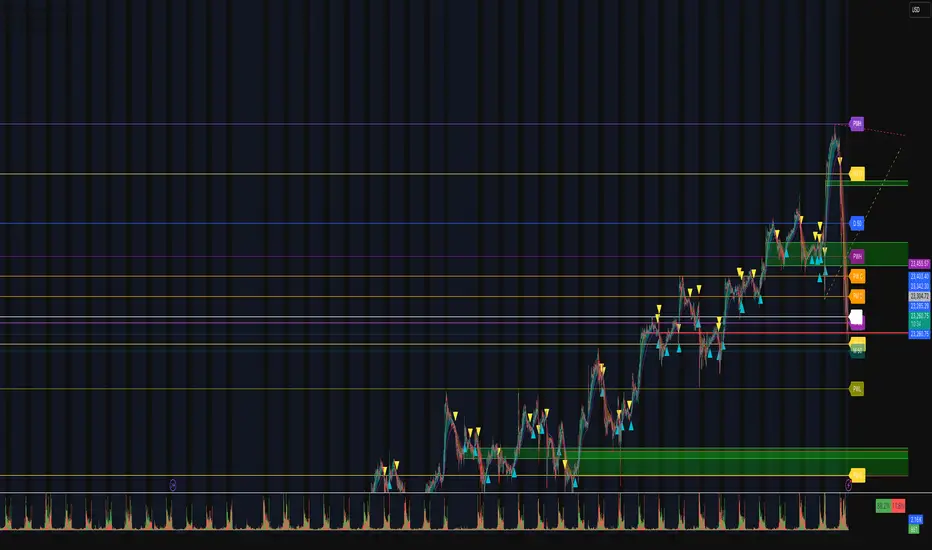
Auto-Pivot Levels with Alerts and 4 methods [ChartWhizzperer]🚀 Auto-Pivot Levels – Dynamic Edition
Now with
Live Mode,
4 Pivot Methods
PineConnector-Ready Alerts!
Free, Open Source, Pine Script v6-compliant.
🟢 NEW: Live Mode (Ultra-Dynamic, Repainting) – Switchable in UI!
Instantly switch between Classic (session-based, repaint-free) and Live (rolling window, real-time, repainting) using the simple checkbox in the settings!
Live Mode recalculates all pivots on every tick/bar, using the current high/low/close for the chosen session (daily, weekly, monthly).
Perfect for:
Scalping and high-frequency trading
Real-time bot/automation setups (PineConnector-ready)
Fast-moving or breakout markets
Classic Mode: For traditional, stable levels based on confirmed session data – ideal for backtesting and trading history.
📊 Four Calculation Methods (Choose What Fits YOU):
1️⃣ Classic
Standard pivot calculation.
Based on previous session’s High, Low, Close.
Simple, proven, and suitable for any asset.
2️⃣ Fibonacci
Projects levels using Fibonacci ratios of the prior session’s range.
Great for traders who want to align pivots with fib retracements and extensions.
3️⃣ Camarilla
Uses unique multipliers for support/resistance, focusing on mean reversion and volatility.
Popular among futures and forex day traders.
4️⃣ Woodie
Puts extra weight on previous Close for more responsive pivots.
Often used in trending or choppy conditions.
Switch methods anytime in the UI – the script recalculates instantly and keeps your chart clean!
🔔 Level-Specific Alerts – PineConnector Ready!
Dedicated alert for EVERY level and direction (Up/Down):
Pivot (P), R1, R2, R3, S1, S2, S3
No configuration hassle:
All alerts are pre-defined in the TradingView Alert Panel.
Machine-readable message format:
PIVOT=R1 DIR=UP SYMBOL={{ticker}} PRICE={{close}}
Direct plug-and-play with PineConnector, webhooks, Discord, Telegram, bots, and other automation tools.
Never miss a breakout, reversal, or key support/resistance touch.
🛠 Powerful Customization & Performance
Session selection: Daily, Weekly, Monthly (choose what suits your trading style).
Show/hide any level (Pivot, R1–R3, S1–S3) for minimal chart clutter.
Color selection for each level to match your theme or highlight key pivots.
Auto-cleanup: Old lines and labels are cleared on every recalculation or session change for maximum performance and visual clarity.
Zero runtime errors: Strict Pine Script v6 practices for stability.
💡 How To Use – Quick Start
Add the indicator to your TradingView chart.
Pick your calculation method (Classic, Fibonacci, Camarilla, Woodie).
Set session type (Daily, Weekly, Monthly).
Switch between Classic and Live Mode with a single click in settings.
Customize your levels (on/off, colors).
Open the Alert Panel, select any pre-configured alert (e.g. "R2 Cross Down"), and go live!
Connect with PineConnector or any webhook system instantly using the pre-formatted alert messages.
🤖 Who Is It For?
Active scalpers & bot traders: Live Mode + PineConnector-ready alerts = instant, automated reactions.
Swing and position traders: Use Classic Mode for stable, repaint-free levels.
Strategy developers: Seamless integration into automated and manual trading workflows.
🏷 License & Community
Open Source, Non-Commercial:
Free for personal & educational use under CC BY-NC-SA 4.0.
Feedback, bug reports & ideas:
Drop a comment, or contact me for feature requests.
Trade smart. Trade dynamic. Unlock the true power of pivots – with ChartWhizzperer !
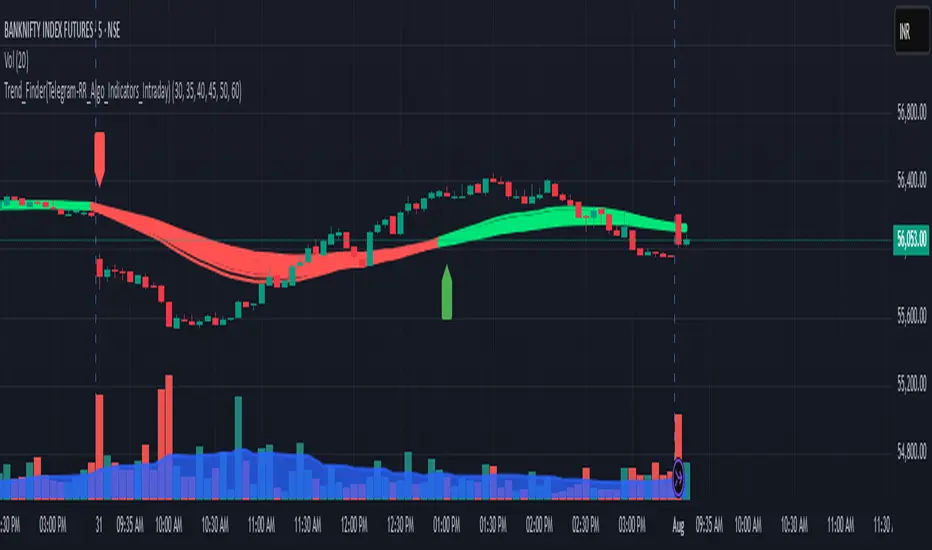
Trend_Finder(Telegram-RR_Algo_Indicators_Intraday)EMA Inputs
It uses 6 EMAs with customizable lengths (defaults: 30, 35, 40, 45, 50, 60).
Trend Conditions
Bullish Trend: All EMAs are strictly ordered from smallest to largest, meaning short-term prices are leading long-term prices upward.
Bearish Trend: All EMAs are ordered from largest to smallest, meaning short-term prices are falling below long-term ones.
Neutral: EMAs are mixed and do not meet the above criteria.
Trend Tracking
The script remembers the current trend and only flips when a full trend reversal condition is confirmed.
Auto AVWAP (Anchored-VWAP) with Breakout ScreenerAuto AVWAP (Anchored-VWAP) with Breakout Screener. fINAL VERSION

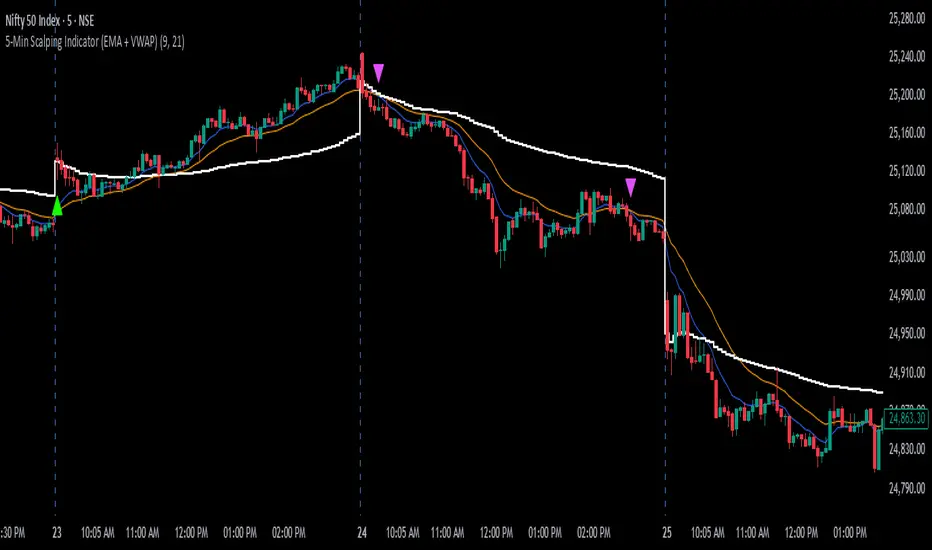
5-Min Scalping Indicator (EMA + VWAP)5-Min Scalping Indicator (EMA + VWAP)
Strategy Logic (for 5-min timeframe):
Long Entry: Price above VWAP, EMA Fast crosses above EMA Slow.
Short Entry: Price below VWAP, EMA Fast crosses below EMA Slow.
Exit: On opposite EMA cross or trailing stop (optional for strategy).
How to Use:
Apply this on a 5-minute chart.
Look for buy signals when:
Fast EMA crosses above Slow EMA.
Price is above VWAP.
Look for sell signals when:
Fast EMA crosses below Slow EMA.
Price is below VWAP.
Combine with price action or volume confirmation for best results.
TFO + ADX with Histogram & SignalTrend Flow Oscillator (TFO + ADX) – Histogram + Signal
This version of the original TFO+ADX introduces a MACD-style histogram and signal line overlay for clearer momentum and trend visualization.
The Trend Flow Oscillator (TFO+ADX) blends two powerful volume-based tools — the Money Flow Index (MFI) and Chaikin Money Flow (CMF) — along with a normalized Average Directional Index (ADX). The result is a comprehensive momentum and trend strength tool that offers a more precise read on when markets are gaining or losing conviction.
⸻
How It Works
1.Money Flow Index (MFI)
• Measures volume-weighted buying/selling pressure using price and volume.
• Scaled between –1 and +1 for visual clarity.
2.Chaikin Money Flow (CMF)
• Evaluates volume distribution over time — institutional buying (accumulation) or selling (distribution).
• Also scaled between –1 and +1.
3.TFO Composite Line
• Combines MFI and CMF into a single flow reading.
• A signal line (EMA) tracks the trend of this flow.
• A histogram plots the difference between the TFO and its signal, giving clear signals on shifts in momentum.
4.Normalized ADX Overlay
• Shows trend strength on the same scale (–1 to +1).
• ADX > 0 indicates strong trending conditions.
• ADX < 0 signals weak or consolidating conditions.
⸻
Visual Interpretation
1. Histogram Bars
• Green: TFO is above the signal line → bullish momentum accelerating
• Red: TFO is below the signal line → bearish momentum building
• Bar height represents the strength of the momentum shift
2. Signal Line
• Tracks the smoothed trend of the TFO composite
• Histogram crossing above or below zero reflects momentum crossover and can act as entry or exit signals
3. TFO Raw Line (Optional)
• Still available for reference alongside the histogram
• Shows the unsmoothed blended money flow direction (MFI + CMF)
4. Extreme Zones
• Background shading appears when TFO exceeds ±1.0
• Helps highlight areas of stretched or unsustainable momentum, useful for spotting potential reversals or exhaustion

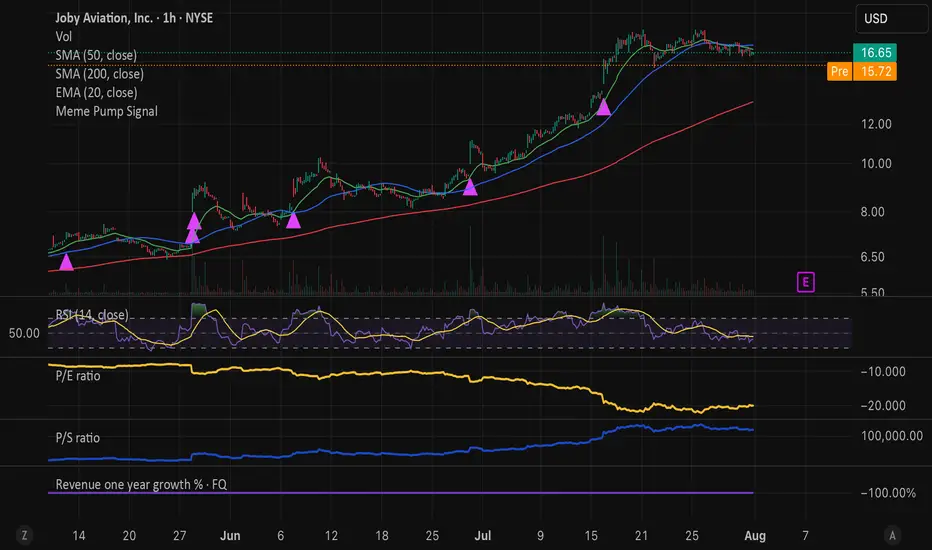
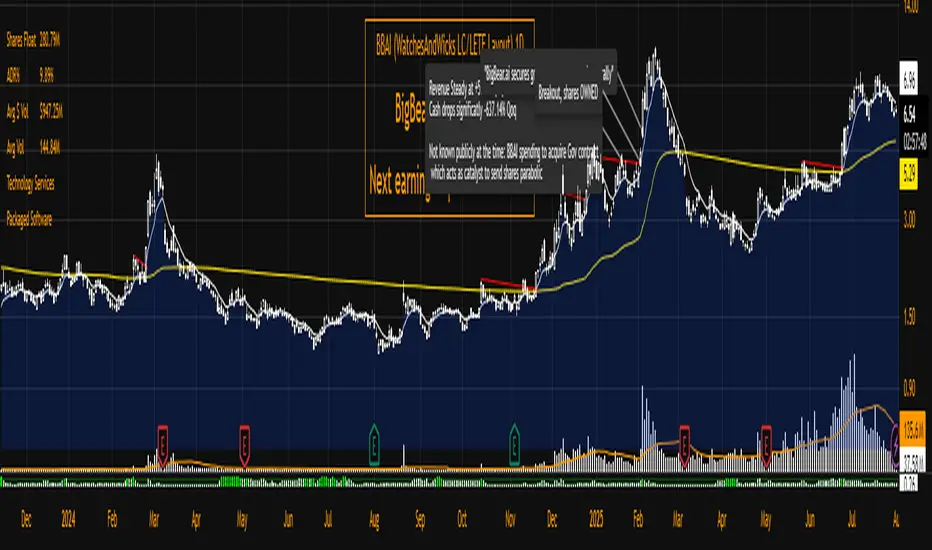
Wx2 Treasure Box – Institutional Entry🧩 Indicator Overview: Wx2 Treasure Box – Institutional Entry
Designed to detect Institutional Bars (IBs) and visualize high-probability entry zones, this script helps traders align with potential smart-money activity.
Institutional Bars are defined as Entry of Smart Money
⚙️ How It Works
20-period and 200-period Simple Moving Averages are plotted to show short‑ and long‑term trend direction.
On identification of an IB:
A label “IB” is placed above the bar.
A rectangular box is drawn around its high–low range, extending several bars to the right to mark the trade zone
Trade Signals & Setup Guidelines
Buy Entry:
Trigger: Price breaks above the box.
Stop Loss (SL): Set just below the box bottom.
Sell Entry:
Trigger: Price piercing below the box.
SL: Placed above the box top.
Risk-to-Reward Ratio (RRR):
Target RRR of 1:2 is recommended
Best Execution Zone:
Treasure Box is the best with 20SMA+200 SMA+Price in it.
📽️ Video Link
You’ve linked a YouTube video for explanation:
Watch Here

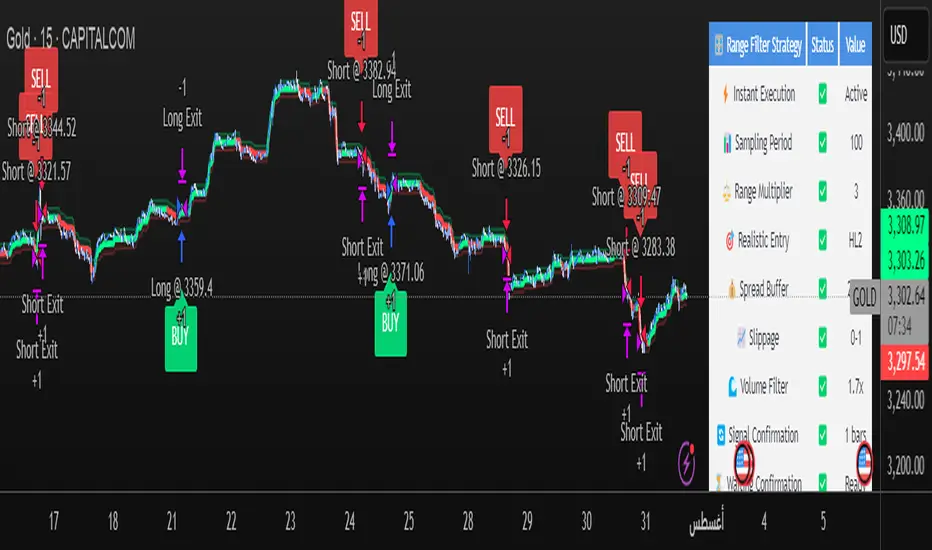
Range Filter Strategy [Real Backtest]Range Filter Strategy - Real Backtesting
# Overview
Advanced Range Filter strategy designed for realistic backtesting with precise execution timing and comprehensive risk management. Built specifically for cryptocurrency markets with customizable parameters for different assets and timeframes.
Core Algorithm
Range Filter Technology:
- Smooth Average Range calculation using dual EMA filtering
- Dynamic range-based price filtering to identify trend direction
- Anti-noise filtering system to reduce false signals
- Directional momentum tracking with upward/downward counters
Key Features
Real-Time Execution (No Delay)
- Process orders on tick: Immediate execution without waiting for bar close
- Bar magnifier integration for intrabar precision
- Calculate on every tick for maximum responsiveness
- Standard OHLC bypass for enhanced accuracy
Realistic Price Simulation
- HL2 entry pricing (High+Low)/2 for realistic fills
- Configurable spread buffer simulation
- Random slippage generation (0 to max slippage)
- Market liquidity validation before entry
Advanced Signal Filtering
- Volume-based filtering with customizable ratio
- Optional signal confirmation system (1-3 bars)
- Anti-repetition logic to prevent duplicate signals
- Daily trade limit controls
Risk Management
- Fixed Risk:Reward ratios with precise point calculation
- Automatic stop loss and take profit execution
- Position size management
- Maximum daily trades limitation
Alert System
- Real-time alerts synchronized with strategy execution
- Multiple alert types: Setup, Entry, Exit, Status
- Customizable message formatting with price/time inclusion
- TradingView alert panel integration
Default Parameters
Optimized for BTC 5-minute charts:
- Sampling Period: 100
- Range Multiplier: 3.0
- Risk: 50 points
- Reward: 100 points (1:2 R:R)
- Spread Buffer: 2.0 points
- Max Slippage: 1.0 points
Signal Logic
Long Entry Conditions:
- Price above Range Filter line
- Upward momentum confirmed
- Volume requirements met (if enabled)
- Confirmation period completed (if enabled)
- Daily trade limit not exceeded
Short Entry Conditions:
- Price below Range Filter line
- Downward momentum confirmed
- Volume requirements met (if enabled)
- Confirmation period completed (if enabled)
- Daily trade limit not exceeded
Visual Elements
- Range Filter line with directional coloring
- Upper and lower target bands
- Entry signal markers
- Risk/Reward ratio boxes
- Real-time settings dashboard
Customization Options
Market Adaptation:
- Adjust Sampling Period for different timeframes
- Modify Range Multiplier for various volatility levels
- Configure spread/slippage for different brokers
- Set appropriate R:R ratios for trading style
Filtering Controls:
- Enable/disable volume filtering
- Adjust confirmation requirements
- Set daily trade limits
- Customize alert preferences
Performance Features
- Realistic backtesting results aligned with live trading
- Elimination of look-ahead bias
- Proper order execution simulation
- Comprehensive trade statistics
Alert Configuration
Alert Types Available:
- Entry signals with complete trade information
- Setup alerts for early preparation
- Exit notifications for position management
- Filter direction changes for market context
Message Format:
Symbol - Action | Price: XX.XX | Stop: XX.XX | Target: XX.XX | Time: HH:MM
Usage Recommendations
Optimal Settings:
- Bitcoin/Major Crypto: Default parameters
- Forex: Reduce sampling period to 50-70, multiplier to 2.0-2.5
- Stocks: Reduce sampling period to 30-50, multiplier to 1.0-1.8
- Gold: Sampling period 60-80, multiplier 1.5-2.0
TradingView Configuration:
- Recalculate: "On every tick"
- Orders: "Use bar magnifier"
- Data: Real-time feed recommended
Risk Disclaimer
This strategy is designed for educational and analytical purposes. Past performance does not guarantee future results. Always test thoroughly on paper trading before live implementation. Consider market conditions, broker execution, and personal risk tolerance when using any automated trading system.
Best Settings Found for Gold 15-Minute Timeframe
After extensive testing and optimization, these are the most effective settings I've discovered for trading Gold (XAUUSD) on the 15-minute timeframe:
Core Filter Settings:
Sampling Period: 100
Range Multiplier: 3.0
Professional Execution Engine:
Realistic Entry: Enabled (HL2)
Spread Buffer: 2 points
Dynamic Slippage: Enabled with max 1 point
Volume Filter: Enabled at 1.7x ratio
Signal Confirmation: Enabled with 1 bar confirmation
Risk Management:
Stop Loss: 50 points
Take Profit: 100 points (2:1 Risk-Reward)
Max Trades Per Day: 5
These settings provide an excellent balance between signal accuracy and realistic market execution. The volume filter at 1.7x ensures we only trade during periods of sufficient market activity, while the 1-bar confirmation helps filter out false signals. The spread buffer and slippage settings account for real trading costs, making backtest results more realistic and achievable in live trading.
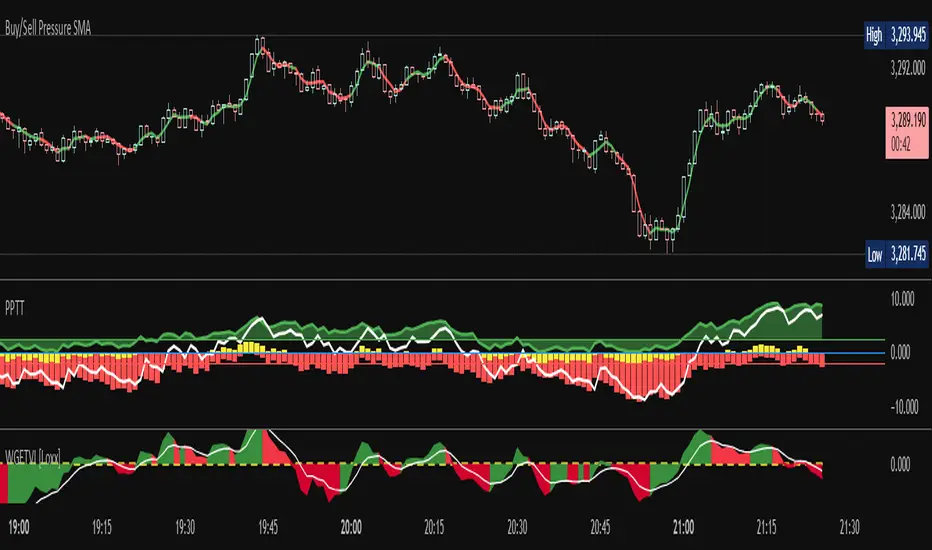
Buy/Sell Demand Pressure SMAThis indicator shows when competing buying and selling pressure has changed.
When bullish buying offsets bearish transaction volume, the indicator turns green. When bearish selling pressure offsets bullish buying volume the indicator is red.
Can be used as a normal SMA or to confirm buy/sell signals of other indicators.
Works best at the start of trades...and not exits but if set properly, it is a good indicator of when a trend has reversed.
~ jb tuttle
Opaline Color ChangeONLY USE for serious full time trading strategy, or running away from Military/City.
Multi Kernel Regression with Alert.

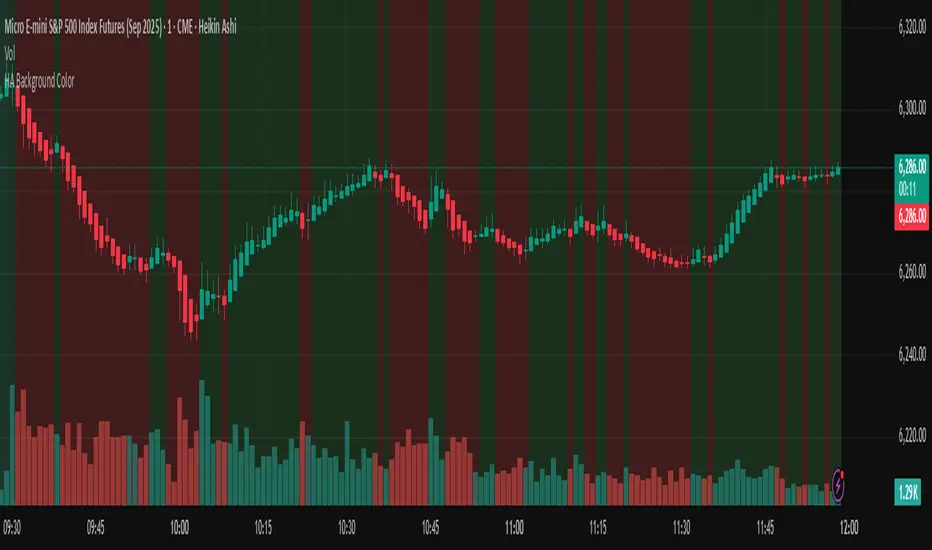
HA Background ColorThis indicator colors the entire chart background based on the current Heikin Ashi candle direction:
🟩 Green background = Bullish Heikin Ashi candle
🟥 Red background = Bearish Heikin Ashi candle
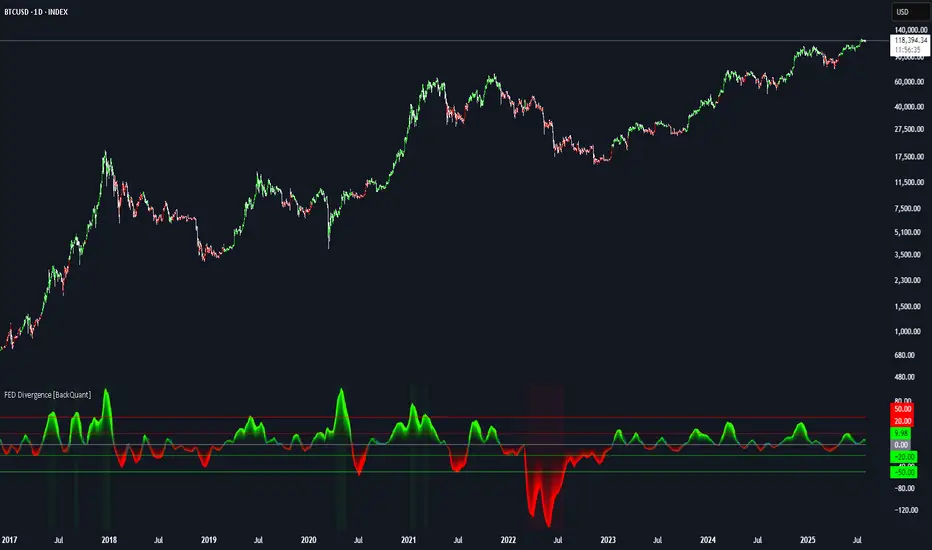
FEDFUNDS Rate Divergence Oscillator [BackQuant]FEDFUNDS Rate Divergence Oscillator
1. Concept and Rationale
The United States Federal Funds Rate is the anchor around which global dollar liquidity and risk-free yield expectations revolve. When the Fed hikes, borrowing costs rise, liquidity tightens and most risk assets encounter head-winds. When it cuts, liquidity expands, speculative appetite often recovers. Bitcoin, a 24-hour permissionless asset sometimes described as “digital gold with venture-capital-like convexity,” is particularly sensitive to macro-liquidity swings.
The FED Divergence Oscillator quantifies the behavioural gap between short-term monetary policy (proxied by the effective Fed Funds Rate) and Bitcoin’s own percentage price change. By converting each series into identical rate-of-change units, subtracting them, then optionally smoothing the result, the script produces a single bounded-yet-dynamic line that tells you, at a glance, whether Bitcoin is outperforming or underperforming the policy backdrop—and by how much.
2. Data Pipeline
• Fed Funds Rate – Pulled directly from the FRED database via the ticker “FRED:FEDFUNDS,” sampled at daily frequency to synchronise with crypto closes.
• Bitcoin Price – By default the script forces a daily timeframe so that both series share time alignment, although you can disable that and plot the oscillator on intraday charts if you prefer.
• User Source Flexibility – The BTC series is not hard-wired; you can select any exchange-specific symbol or even swap BTC for another crypto or risk asset whose interaction with the Fed rate you wish to study.
3. Math under the Hood
(1) Rate of Change (ROC) – Both the Fed rate and BTC close are converted to percent return over a user-chosen lookback (default 30 bars). This means a cut from 5.25 percent to 5.00 percent feeds in as –4.76 percent, while a climb from 25 000 to 30 000 USD in BTC over the same window converts to +20 percent.
(2) Divergence Construction – The script subtracts the Fed ROC from the BTC ROC. Positive values show BTC appreciating faster than policy is tightening (or falling slower than the rate is cutting); negative values show the opposite.
(3) Optional Smoothing – Macro series are noisy. Toggle “Apply Smoothing” to calm the line with your preferred moving-average flavour: SMA, EMA, DEMA, TEMA, RMA, WMA or Hull. The default EMA-25 removes day-to-day whips while keeping turning points alive.
(4) Dynamic Colour Mapping – Rather than using a single hue, the oscillator line employs a gradient where deep greens represent strong bullish divergence and dark reds flag sharp bearish divergence. This heat-map approach lets you gauge intensity without squinting at numbers.
(5) Threshold Grid – Five horizontal guides create a structured regime map:
• Lower Extreme (–50 pct) and Upper Extreme (+50 pct) identify panic capitulations and euphoria blow-offs.
• Oversold (–20 pct) and Overbought (+20 pct) act as early warning alarms.
• Zero Line demarcates neutral alignment.
4. Chart Furniture and User Interface
• Oscillator fill with a secondary DEMA-30 “shader” offers depth perception: fat ribbons often precede high-volatility macro shifts.
• Optional bar-colouring paints candles green when the oscillator is above zero and red below, handy for visual correlation.
• Background tints when the line breaches extreme zones, making macro inflection weeks pop out in the replay bar.
• Everything—line width, thresholds, colours—can be customised so the indicator blends into any template.
5. Interpretation Guide
Macro Liquidity Pulse
• When the oscillator spends weeks above +20 while the Fed is still raising rates, Bitcoin is signalling liquidity tolerance or an anticipatory pivot view. That condition often marks the embryonic phase of major bull cycles (e.g., March 2020 rebound).
• Sustained prints below –20 while the Fed is already dovish indicate risk aversion or idiosyncratic crypto stress—think exchange scandals or broad flight to safety.
Regime Transition Signals
• Bullish cross through zero after a long sub-zero stint shows Bitcoin regaining upward escape velocity versus policy.
• Bearish cross under zero during a hiking cycle tells you monetary tightening has finally started to bite.
Momentum Exhaustion and Mean-Reversion
• Touches of +50 (or –50) come rarely; they are statistically stretched events. Fade strategies either taking profits or hedging have historically enjoyed positive expectancy.
• Inside-bar candlestick patterns or lower-timeframe bearish engulfings simultaneously with an extreme overbought print make high-probability short scalp setups, especially near weekly resistance. The same logic mirrors for oversold.
Pair Trading / Relative Value
• Combine the oscillator with spreads like BTC versus Nasdaq 100. When both the FED Divergence oscillator and the BTC–NDQ relative-strength line roll south together, the cross-asset confirmation amplifies conviction in a mean-reversion short.
• Swap BTC for miners, altcoins or high-beta equities to test who is the divergence leader.
Event-Driven Tactics
• FOMC days: plot the oscillator on an hourly chart (disable ‘Force Daily TF’). Watch for micro-structural spikes that resolve in the first hour after the statement; rapid flips across zero can front-run post-FOMC swings.
• CPI and NFP prints: extremes reached into the release often mean positioning is one-sided. A reversion toward neutral in the first 24 hours is common.
6. Alerts Suite
Pre-bundled conditions let you automate workflows:
• Bullish / Bearish zero crosses – queue spot or futures entries.
• Standard OB / OS – notify for first contact with actionable zones.
• Extreme OB / OS – prime time to review hedges, take profits or build contrarian swing positions.
7. Parameter Playground
• Shorten ROC Lookback to 14 for tactical traders; lengthen to 90 for macro investors.
• Raise extreme thresholds (for example ±80) when plotting on altcoins that exhibit higher volatility than BTC.
• Try HMA smoothing for responsive yet smooth curves on intraday charts.
• Colour-blind users can easily swap bull and bear palette selections for preferred contrasts.
8. Limitations and Best Practices
• The Fed Funds series is step-wise; it only changes on meeting days. Rapid BTC oscillations in between may dominate the calculation. Keep that perspective when interpreting very high-frequency signals.
• Divergence does not equal causation. Crypto-native catalysts (ETF approvals, hack headlines) can overwhelm macro links temporarily.
• Use in conjunction with classical confirmation tools—order-flow footprints, market-profile ledges, or simple price action to avoid “pure-indicator” traps.
9. Final Thoughts
The FEDFUNDS Rate Divergence Oscillator distills an entire macro narrative monetary policy versus risk sentiment into a single colourful heartbeat. It will not magically predict every pivot, yet it excels at framing market context, spotting stretches and timing regime changes. Treat it as a strategic compass rather than a tactical sniper scope, combine it with sound risk management and multi-factor confirmation, and you will possess a robust edge anchored in the world’s most influential interest-rate benchmark.
Trade consciously, stay adaptive, and let the policy-price tension guide your roadmap.
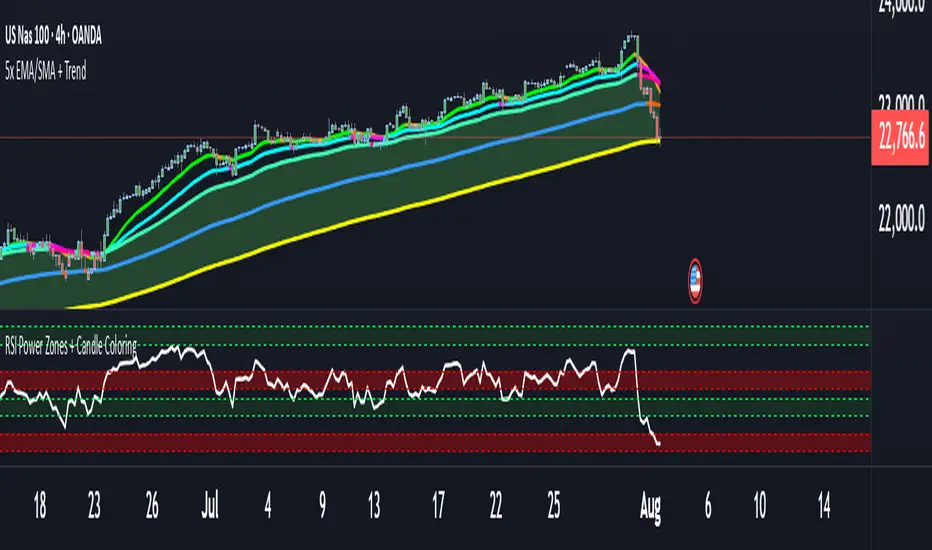
RSI Power Zones + Candle ColoringOk , So here is the newly revised PowerZones
With CAndle Coloring Showing you what the PowerZones Show you if it is in a bullish upTrend
or if the trend is currently in a downtrend
Along with my newly created indicator5x EMA/SMA Trend Indicator with the Cloud that coincides with new RSI PowerZones Indictor showing you the candles colored if it is bullish or Bearish Currently
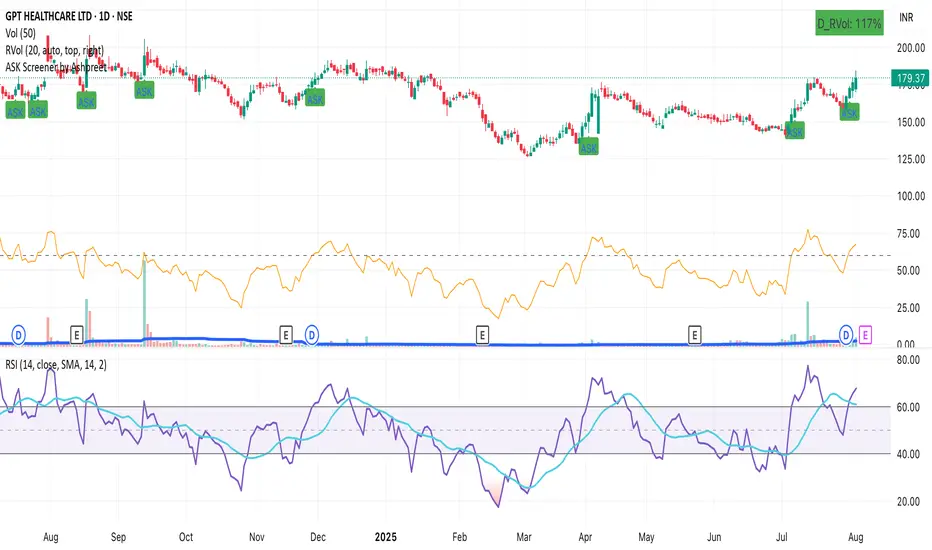
ASK Screener by AshpreetThe ASK Indicator is a custom-built breakout and trend continuation system designed for swing traders seeking high-probability entries with strong risk-reward ratios. Built using a combination of moving averages, momentum filters, volume confirmation, and price structure, this indicator helps identify stocks poised for explosive moves.
It uses three key moving averages: the 44-period SMA (medium trend), 20-period DEMA (short-term strength, custom-coded), and 50-period WEMA (institutional trendline). Trades are only triggered when the price is above 50 WEMA, and the 20 DEMA is above the 44 SMA.
Momentum is confirmed using RSI(14) within a healthy zone of 40–60, ensuring the stock is not overbought or oversold. To focus on breakout candidates, the stock must be trading within 10% of its 52-week high, and the weekly candle range must be under 10%, signaling compression before expansion.
A valid ASK Signal occurs when these conditions are met along with a breakout above the previous day’s high and volume exceeding 1.5× the 20-day average. Once triggered, the indicator auto-plots the stop-loss (1× ATR) and two profit targets: 1:2 (TP1) and 1:4 (TP2).
Additionally, the system detects a narrow range setup, where the last 3 daily candles are inside the previous 3-day range — a powerful consolidation signal. Alerts for both ASK entries and narrow ranges are included.
This system is ideal for positional and short-term swing traders who want to combine structure, momentum, and volume in one powerful tool.
Momentum Commitment Delta (MCD)What it is
M C D fuses five micro-structure clues into one 0-to-1 score that says, “how hard are traders actually leaning on this move?”
1. Body-Delta Momentum – average net candle body direction.
2. Volume Commitment – up-volume ÷ down-volume over the same window.
3. Wick Compression – shrinking upper/lower wicks = clean conviction.
4. Candle Sequencing – rewards orderly, staircase-style body growth.
5. Pin Ratio – where the close pins inside each candle’s range.
The five factors are multiplied, then auto-normalized so extremes always land near 0 / 1 on any symbol or timeframe.
I recommend tweaking the settings to fit your edge, the pre-loaded settings may not be suitable for most traders. The MCD works on all timeframes as well :)
⸻
How to read basic signals
• Fresh cross above 0.70 → often the birth of a real breakout.
• Cluster of > 0.70 bars → “commitment lock,” pull-backs usually shallow.
• Price makes new high while M C D doesn’t → beware...
• Cross back below 0.30 after a run → momentum is out of fuel.
⸻
Because M C D is multiplicative, it’s hard to hit the extremes—so when the bars light lime green, the print is usually telling the truth.
I personally use the MCD to identify the peak of a high-conviction range, NOT a breakout. If a bar prints over 0.70 (green) and then a range forms off of the bar which exceeded 0.70, the breakout has a high chance to be explosive, regardless of what MCD reads at the breakout inflection point.
Play around with it, im sure there are plenty of other patterns.
Disclaimer: The Momentum Commitment Delta (MCD) indicator is provided strictly for educational and informational purposes. It does not constitute financial or investment advice, nor is it a recommendation to buy or sell any security. Trading involves substantial risk, and you should always perform your own due diligence and consult a qualified financial professional before making any trading decisions. Past performance is not indicative of future results.
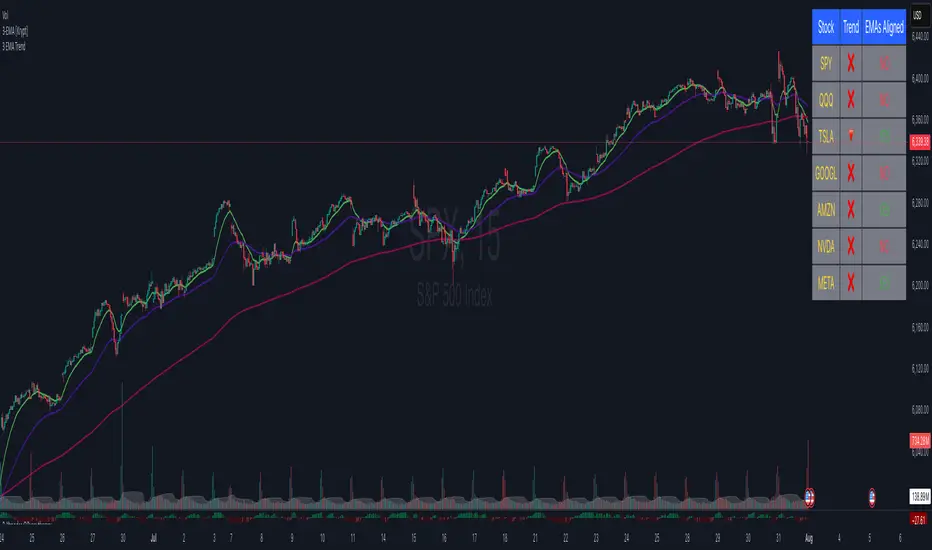
3 EMA cross overThis Pine Script displays the 3 EMA trend status for a list of popular stocks in a dynamic table. It calculates and monitors 13 EMA, 48 EMA, and 200 EMA for each ticker to detect bullish or bearish alignment.
Best Use:
Use this script to quickly scan market trends across multiple stocks and identify potential trade opportunities based on EMA alignment.
Dual Supertrend tohungmc tikDual Supertrend is an advanced trend-following indicator that combines two Supertrend strategies — a Large Supertrend and a Small Supertrend — to provide you with more precise entry and exit signals.
This indicator plots two Supertrend lines:
Large Supertrend (Blue and Orange): A broader trend that reacts slower to price movements.
Small Supertrend (Green and Red): A faster trend that responds quicker to market changes.
Key Features:
Customizable ATR Periods and Multipliers for both Large and Small Supertrends.
Buy/Sell Signals: When the Small Supertrend trend changes, and it's aligned with the Large Supertrend, you get reliable buy and sell signals.
Highlighting: The background can be highlighted in green or red, depending on whether the Large Supertrend is in an uptrend or downtrend.
Alerts: Alerts can be set for buy/sell signals or when the trend direction changes.
Use Case:
This indicator is designed for traders looking to follow both long-term and short-term trends. By combining the slower Large Supertrend with the faster Small Supertrend, it gives a more comprehensive view of market trends and better entry/exit points.
Indicator Inputs:
ATR Periods and Multipliers: Control how sensitive the Supertrend reacts to market changes.
Highlighting: Enable/Disable background highlighting.
Buy/Sell Signals: Option to show buy/sell signals based on trend direction changes.

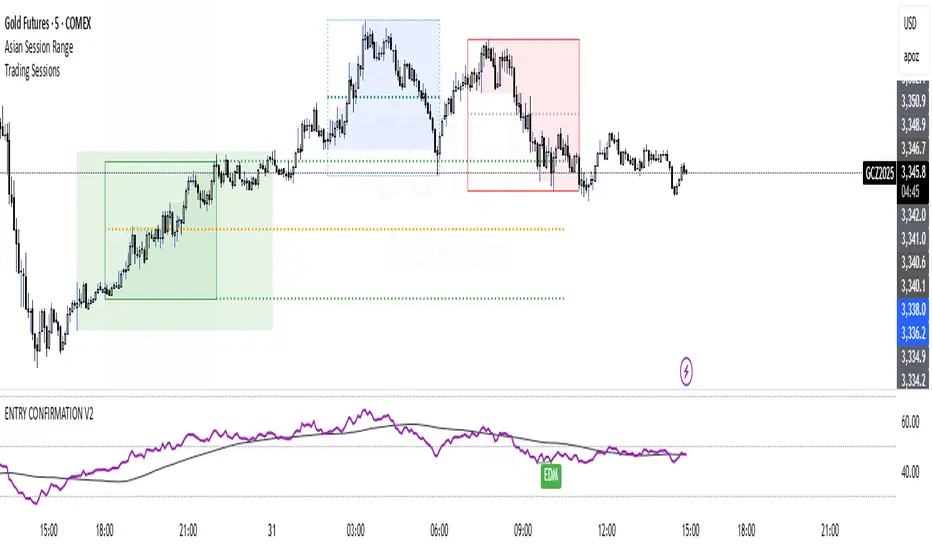
ENTRY CONFIRMATION V2An indicator from candle man. Helps determine whether supply and demand zone are truly supply or demand.
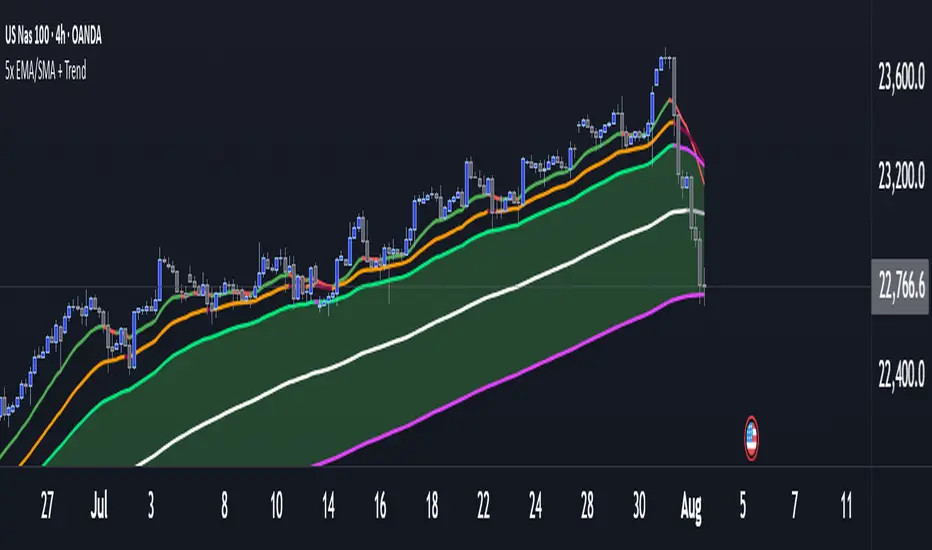
Multi 5x EMA/SMA Colored + EMA Trend Cloud- Ok so these are the settings to the ema's
15
30
50
115
200
Remember these ema's change color depending if the market is bullish or bearish, so choose what colors you want to see bullish and what colors you want to see Bearish
You can also toggle them on or off if you want.
- These are the setting to the trend cloud so you know if the market is bullish or Bearish
50
200
200
Toggle off all plots and only have plots background on