Smart MTF S/R Levels[BullByte]
Smart MTF S/R Levels
Introduction & Motivation
Support and Resistance (S/R) levels are the backbone of technical analysis. However, most traders face two major challenges:
Manual S/R Marking: Drawing S/R levels by hand is time-consuming, subjective, and often inconsistent.
Multi-Timeframe Blind Spots: Key S/R levels from higher or lower timeframes are often missed, leading to surprise reversals or missed opportunities.
Smart MTF S/R Levels was created to solve these problems. It is a fully automated, multi-timeframe, multi-method S/R detection and visualization tool, designed to give traders a complete, objective, and actionable view of the market’s most important price zones.
What Makes This Indicator Unique?
Multi-Timeframe Analysis: Simultaneously analyzes up to three user-selected timeframes, ensuring you never miss a critical S/R level from any timeframe.
Multi-Method Confluence: Integrates several respected S/R detection methods—Swings, Pivots, Fibonacci, Order Blocks, and Volume Profile—into a single, unified system.
Zone Clustering: Automatically merges nearby levels into “zones” to reduce clutter and highlight areas of true market consensus.
Confluence Scoring: Each zone is scored by the number of methods and timeframes in agreement, helping you instantly spot the most significant S/R areas.
Reaction Counting: Tracks how many times price has recently interacted with each zone, providing a real-world measure of its importance.
Customizable Dashboard: A real-time, on-chart table summarizes all key S/R zones, their origins, confluence, and proximity to price.
Smart Alerts: Get notified when price approaches high-confluence zones, so you never miss a critical trading opportunity.
Why Should a Trader Use This?
Objectivity: Removes subjectivity from S/R analysis by using algorithmic detection and clustering.
Efficiency: Saves hours of manual charting and reduces analysis fatigue.
Comprehensiveness: Ensures you are always aware of the most relevant S/R zones, regardless of your trading timeframe.
Actionability: The dashboard and alerts make it easy to act on the most important levels, improving trade timing and risk management.
Adaptability: Works for all asset classes (stocks, forex, crypto, futures) and all trading styles (scalping, swing, position).
The Gap This Indicator Fills
Most S/R indicators focus on a single method or timeframe, leading to incomplete analysis. Manual S/R marking is error-prone and inconsistent. This indicator fills the gap by:
Automating S/R detection across multiple timeframes and methods
Objectively scoring and ranking zones by confluence and reaction
Presenting all this information in a clear, actionable dashboard
How Does It Work? (Technical Logic)
1. Level Detection
For each selected timeframe, the script detects S/R levels using:
SW (Swing High/Low): Recent price pivots where reversals occurred.
Pivot: Classic floor trader pivots (P, S1, R1).
Fib (Fibonacci): Key retracement levels (0.236, 0.382, 0.5, 0.618, 0.786) over the last 50 bars.
Bull OB / Bear OB: Institutional price zones based on bullish/bearish engulfing patterns.
VWAP / POC: Volume Weighted Average Price and Point of Control over the last 50 bars.
2. Level Clustering
Levels within a user-defined % distance are merged into a single “zone.”
Each zone records which methods and timeframes contributed to it.
3. Confluence & Reaction Scoring
Confluence: The number of unique methods/timeframes in agreement for a zone.
Reactions: The number of times price has touched or reversed at the zone in the recent past (user-defined lookback).
4. Filtering & Sorting
Only zones within a user-defined % of the current price are shown (to focus on actionable areas).
Zones can be sorted by confluence, reaction count, or proximity to price.
5. Visualization
Zones: Shaded boxes on the chart (green for support, red for resistance, blue for mixed).
Lines: Mark the exact level of each zone.
Labels: Show level, methods by timeframe (e.g., 15m (3 SW), 30m (1 VWAP)), and (if applicable) Fibonacci ratios.
Dashboard Table: Lists all nearby zones with full details.
6. Alerts
Optional alerts trigger when price approaches a zone with confluence above a user-set threshold.
Inputs & Customization (Explained for All Users)
Show Timeframe 1/2/3: Enable/disable analysis for each timeframe (e.g., 15m, 30m, 1h).
Show Swings/Pivots/Fibonacci/Order Blocks/Volume Profile: Select which S/R methods to include.
Show levels within X% of price: Only display zones near the current price (default: 3%).
How many swing highs/lows to show: Number of recent swings to include (default: 3).
Cluster levels within X%: Merge levels close together into a single zone (default: 0.25%).
Show Top N Zones: Limit the number of zones displayed (default: 8).
Bars to check for reactions: How far back to count price reactions (default: 100).
Sort Zones By: Choose how to rank zones in the dashboard (Confluence, Reactions, Distance).
Alert if Confluence >=: Set the minimum confluence score for alerts (default: 3).
Zone Box Width/Line Length/Label Offset: Control the appearance of zones and labels.
Dashboard Size/Location: Customize the dashboard table.
How to Read the Output
Shaded Boxes: Represent S/R zones. The color indicates type (green = support, red = resistance, blue = mixed).
Lines: Mark the precise level of each zone.
Labels: Show the level, methods by timeframe (e.g., 15m (3 SW), 30m (1 VWAP)), and (if applicable) Fibonacci ratios.
Dashboard Table: Columns include:
Level: Price of the zone
Methods (by TF): Which S/R methods and how many, per timeframe (see abbreviation key below)
Type: Support, Resistance, or Mixed
Confl.: Confluence score (higher = more significant)
React.: Number of recent price reactions
Dist %: Distance from current price (in %)
Abbreviations Used
SW = Swing High/Low (recent price pivots where reversals occurred)
Fib = Fibonacci Level (key retracement levels such as 0.236, 0.382, 0.5, 0.618, 0.786)
VWAP = Volume Weighted Average Price (price level weighted by volume)
POC = Point of Control (price level with the highest traded volume)
Bull OB = Bullish Order Block (institutional support zone from bullish price action)
Bear OB = Bearish Order Block (institutional resistance zone from bearish price action)
Pivot = Pivot Point (classic floor trader pivots: P, S1, R1)
These abbreviations appear in the dashboard and chart labels for clarity.
Example: How to Read the Dashboard and Labels (from the chart above)
Suppose you are trading BTCUSDT on a 15-minute chart. The dashboard at the top right shows several S/R zones, each with a breakdown of which timeframes and methods contributed to their detection:
Resistance zone at 119257.11:
The dashboard shows:
5m (1 SW), 15m (2 SW), 1h (3 SW)
This means the level 119257.11 was identified as a resistance zone by one swing high (SW) on the 5-minute timeframe, two swing highs on the 15-minute timeframe, and three swing highs on the 1-hour timeframe. The confluence score is 6 (total number of method/timeframe hits), and there has been 1 recent price reaction at this level. This suggests 119257.11 is a strong resistance zone, confirmed by multiple swing highs across all selected timeframes.
Mixed zone at 118767.97:
The dashboard shows:
5m (2 SW), 15m (2 SW)
This means the level 118767.97 was identified by two swing points on both the 5-minute and 15-minute timeframes. The confluence score is 4, and there have been 19 recent price reactions at this level, indicating it is a highly reactive zone.
Support zone at 117411.35:
The dashboard shows:
5m (2 SW), 1h (2 SW)
This means the level 117411.35 was identified as a support zone by two swing lows on the 5-minute timeframe and two swing lows on the 1-hour timeframe. The confluence score is 4, and there have been 2 recent price reactions at this level.
Mixed zone at 118291.45:
The dashboard shows:
15m (1 SW, 1 VWAP), 5m (1 VWAP), 1h (1 VWAP)
This means the level 118291.45 was identified by a swing and VWAP on the 15-minute timeframe, and by VWAP on both the 5-minute and 1-hour timeframes. The confluence score is 4, and there have been 12 recent price reactions at this level.
Support zone at 117103.10:
The dashboard shows:
15m (1 SW), 1h (1 SW)
This means the level 117103.10 was identified by a single swing low on both the 15-minute and 1-hour timeframes. The confluence score is 2, and there have been no recent price reactions at this level.
Resistance zone at 117899.33:
The dashboard shows:
5m (1 SW)
This means the level 117899.33 was identified by a single swing high on the 5-minute timeframe. The confluence score is 1, and there have been no recent price reactions at this level.
How to use this:
Zones with higher confluence (more methods and timeframes in agreement) and more recent reactions are generally more significant. For example, the resistance at 119257.11 is much stronger than the resistance at 117899.33, and the mixed zone at 118767.97 has shown the most recent price reactions, making it a key area to watch for potential reversals or breakouts.
Tip:
“SW” stands for Swing High/Low, and “VWAP” stands for Volume Weighted Average Price.
The format 15m (2 SW) means two swing points were detected on the 15-minute timeframe.
Best Practices & Recommendations
Use with Other Tools: This indicator is most powerful when combined with your own price action analysis and risk management.
Adjust Settings: Experiment with timeframes, clustering, and methods to suit your trading style and the asset’s volatility.
Watch for High Confluence: Zones with higher confluence and more reactions are generally more significant.
Limitations
No Future Prediction: The indicator does not predict future price movement; it highlights areas where price is statistically more likely to react.
Not a Standalone System: Should be used as part of a broader trading plan.
Historical Data: Reaction counts are based on historical price action and may not always repeat.
Disclaimer
This indicator is a technical analysis tool and does not constitute financial advice or a recommendation to buy or sell any asset. Trading involves risk, and past performance is not indicative of future results. Always use proper risk management and consult a financial advisor if needed.
Trend Analysis

Impulse Alert - Demand (Buy) [Fixed]🔵 Impulse Alert – Demand (Buy)
This indicator is designed to detect high-probability Demand Zones based on impulsive bullish price action, helping traders get alerted only when it matters most.
🧠 Core Logic:
Scans the chart for 2 consecutive bullish impulsive candles with significant range (body size)
Also captures single large bullish impulse candles that often mark institutional buying
Marks the origin of the move as a potential Demand Zone
Sends alerts when such bullish setups form, allowing you to monitor charts passively
⚙️ Features:
✅ Alerts on impulsive move formations
✅ Detects both 2-candle and single-candle impulses
✅ Custom zone detection logic based on pip size and momentum
✅ Cleaner & smarter: removes distractions and avoids false signals
📌 Best Used For:
Smart Money / Supply & Demand traders
Identifying potential institutional buy zones
Executing trades with HTF confluence
Traders who want to get alerted without screen-watching
🔁 Suggested Strategy:
Set HTF directional bias (H1, H4, D1)
Use this indicator on LTF (1M–15M) for impulsive bullish entries
Wait for price to return to the marked zone for low-risk entries
💡 Pro Tip: Combine with your Supply Zone (Sell) indicator to track both sides of market structure and increase R:R
👤 Created by: Rohit Jadhav | YT/Insta/X - @GrowthByTrading
📬 Want updates, enhancements, or personal versions? Leave feedback or reach out through profile!
3-Bar Reversal and Engulfing3-bar reversal and engulfing candle signals, and a trendline filter.
It should be used to identify consolidation breakouts in a trending market.

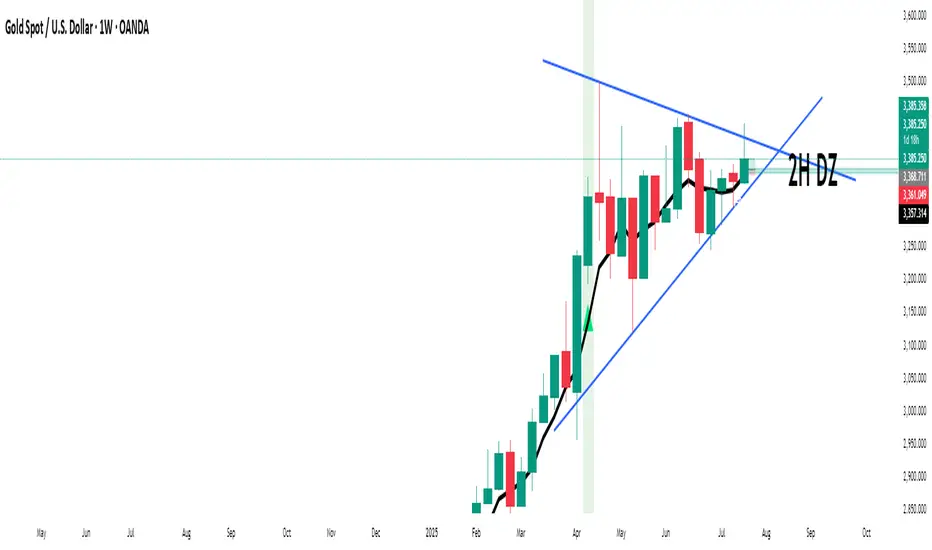
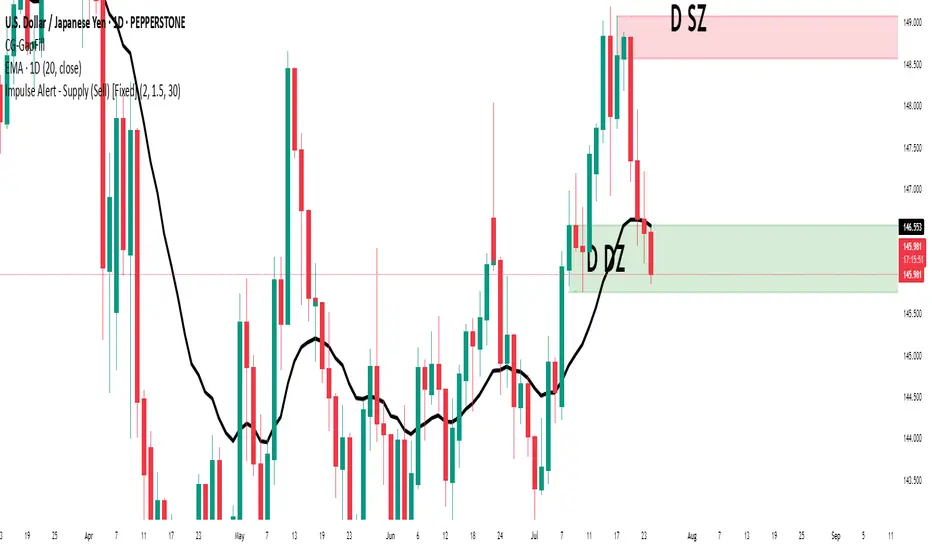
Impulse Alert - Supply (Sell) [Fixed]🟥 Supply Zone (Sell) – Institutional Order Block Detector
This custom indicator automatically detects valid Supply Zones (Sell Zones) based on Smart Money Concepts and institutional trading behavior.
🔍 How It Works:
Identifies strong bearish impulsive moves after price forms a potential Order Block
Valid supply zones are plotted after:
A valid rally–base–drop or drop–base–drop structure
A shift in structure or clear imbalance is detected
The zone is created from the last bullish candle before a strong bearish engulfing move
Zones remain on chart until price revisits and reacts
📊 Use Case:
Ideal for traders using Smart Money Concepts (SMC), Supply & Demand, or ICT-inspired strategies
Perfect for scalping, day trading, or swing setups
Designed for confluence with HTF bias and LTF execution
⚙️ Features:
Supply Zone auto-plotting
Customizable zone color and opacity
Alerts when price returns to the zone (retest entry opportunity)
🧠 Tip for Best Use:
Use in confluence with:
HTF Supply zones (manual or other indicator)
Market Structure breaks
Fair Value Gaps or Imbalance zones
Strong impulsive moves from HTF to LTF
🔁 Future Additions (Coming Soon):
Demand Zone detection
Zone strength rating system
Refined zone filters (volume, candle size, etc.)
Alerts for mitigation or invalidation
📌 Created by: Rohit Jadhav | Real-time market trader | YT/Insta - @GrowthByTrading
💬 Feedback? Drop a comment or connect via profile for updates and tutorials!
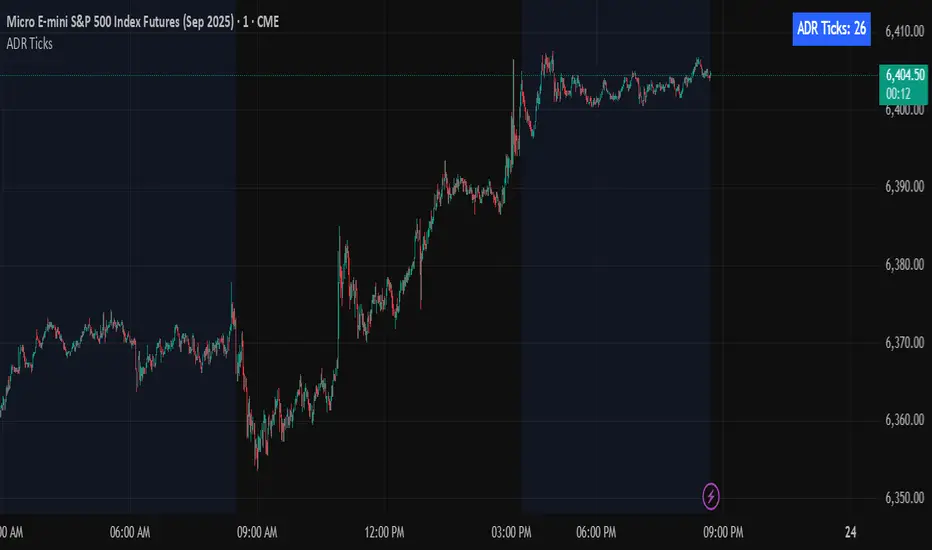
Average Daily Range in TicksPurpose: The ADR Ticks Indicator calculates and displays the average daily price range of a financial instrument, expressed in ticks, over a user-specified number of days. It provides traders with a measure of average daily volatility, which can be used for position sizing, setting stop-loss/take-profit levels, or assessing market activity.
Calculation: Computes the average daily range by taking the difference between the daily high and low prices, averaging this range over a customizable number of days, and converting the result into ticks (using the instrument's minimum tick size).
Customization: Includes a user input to adjust the number of days for the average calculation and a toggle to show/hide the ADR Ticks value in the table.
Risk Management: Helps traders estimate typical daily price movement to set appropriate stop-loss or take-profit levels.
Market Analysis: Offers insight into average daily volatility, useful for day traders or swing traders assessing whether a market is trending or ranging.
Technical Notes:
The indicator uses barstate.islast to update the table only on the last bar, reducing computational load and preventing overlap.
The script handles different chart timeframes by pulling daily data via request.security, making it robust across various instruments and timeframes.
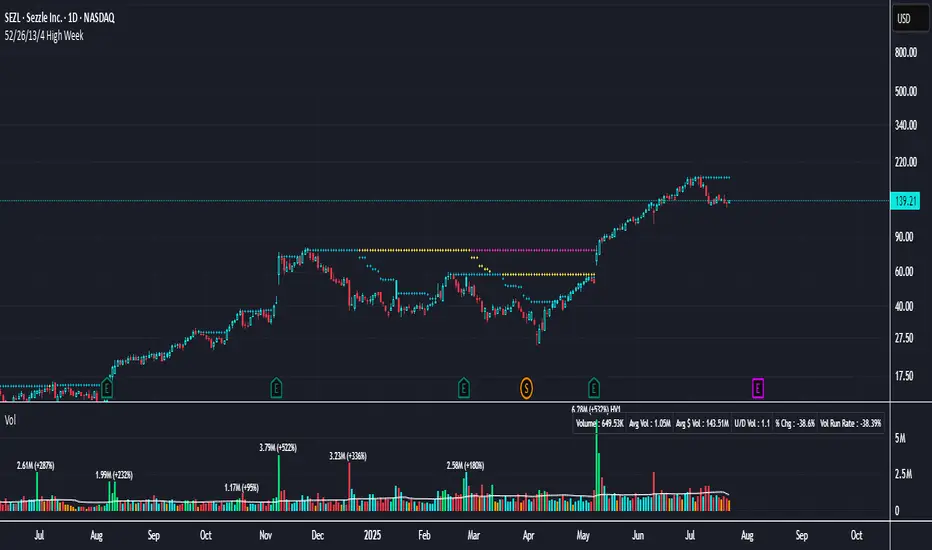
52/26/13/4 High WeekThis is a tool to identify the 52-week high of a candlestick for use in breakout strategies. It can be used in conjunction with Pocket Pivot and EMA or Volume.
It is ideal for studying price behavior and trend following.
Indicator TesterIndicator Tester
Designed to evaluate and backtest a composite trading signal based on multiple technical indicators across volatility, volume, momentum, and moving average categories. It is suitable for assets like Bitcoin, on all timeframes.
Key Features:
Indicator Selection: Allows users to enable/disable indicators such as CCI, Bollinger Bands, RVI, MFI, VZO, EFI, KVO, VPT, COPP, RSI, StochRSI, MOM, TRIX, SMI, MA Cross, RTI, and Simple MA, with customizable parameters.
Customizable Inputs:
Individual indicator settings (e.g., lengths, thresholds).
Flip threshold to adjust the signal activation point.
Backtest settings including custom start date, signal type (Long & Short, Long Only, Short Only), and fees.
Table positions for performance and settings display.
Visualization:
Plots an equity curve (orange for positive signals, white otherwise) and a buy-and-hold equity curve (blue).
Displays a performance table comparing indicator equity, drawdown, standard deviation, Sharpe, Sortino, and Omega ratios with buy-and-hold metrics.
A settings table shows backtest start date, fees, number of indicators used, and flip threshold.
Usage:
Enables traders to test and optimize a strategy by combining selected indicators, with performance metrics calculated from the equity curve.
The equity curve and backtest tables help compare the strategy against a buy-and-hold approach.
Ideal for overlay on a 1-day chart to analyze historical performance, as depicted in the Bitcoin/USD chart.

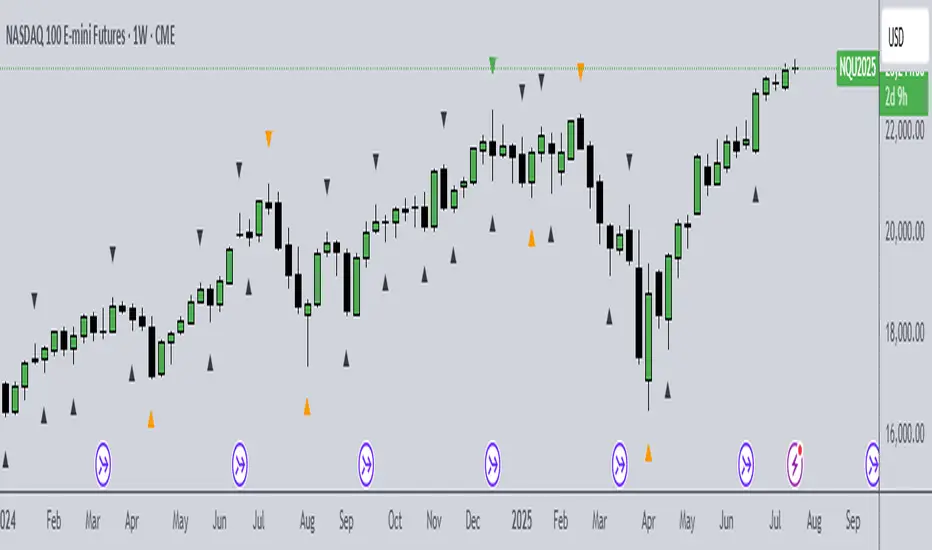
Trend Range Detector (Zeiierman)█ Overview
Trend Range Detector (Zeiierman) is a market structure tool that identifies and tracks periods of price compression by forming adaptive range boxes based on volatility and price movement. When prices remain stable within a defined band, the script dynamically draws a range box; when prices break out of that structure, the box highlights the breakout in real-time.
By combining a volatility-based envelope with a custom weighted centerline, this tool filters out noise and isolates truly stable zones — providing a clean framework for traders who focus on accumulation, distribution, breakout anticipation, and reversion opportunities.
Whether you're range trading, spotting trend consolidations, or looking for volatility contractions before major moves, the Trend Range Detector gives you a mathematically adaptive, visually intuitive structure that maps the heartbeat of the market.
█ How It Works
⚪ Range Formation Engine
The core of this indicator revolves around two conditions:
Distance Filter: The maximum distance between all recent closes and a dynamic centerline must remain within a volatility envelope.
Volatility Envelope: Based on an ATR(2000) multiplied by a user-defined factor to account for broader market volatility trends.
If both conditions are satisfied over the most recent length bars, a range box is drawn to visually anchor the zone.
⚪ Dynamic Breakout Coloring
When price breaks out of the top or bottom of the active range box, the box color shifts in real-time:
Blue Boxes represent areas where price has remained within a defined volatility envelope over a sustained number of bars. These zones reflect stable, low-volatility periods, often associated with consolidation, equilibrium, or market indecision.
Green Boxes for bullish breakouts.
Red Boxes for bearish breakdowns.
This allows traders to visually spot transitions from consolidation to expansion phases without relying on lagging signals.
█ Why Use a Weighted Close Instead of SMA?
A standard Simple Moving Average (SMA) treats all past closes equally, which works well in theory, but not in dynamic, fast-shifting markets. In this script, we replace the traditional SMA with a speed-weighted average that reflects how aggressively the market has moved bar-to-bar.
⚪ Here's why it matters:
Bars with higher momentum (larger price differences between closes) are given more weight.
Slow, sideways candles (typical in noise or low volume) contribute less to the calculated centerline.
This method creates a more accurate snapshot of market behavior, especially during volatile phases. As a result, the indicator adapts to market conditions more effectively, helping traders identify real consolidation zones, not just average lines distorted by flat bars or noise.
█ How to Use
⚪ Range Detection
Boxes form only when price remains consistently close to the speed-weighted mean.
Helps identify sideways zones, consolidations, and low-volatility structures where price is “charging up.”
⚪ Breakout Confirmation
Once price exits the top or bottom boundary, the box immediately highlights the direction of the break.
Use this signal in conjunction with your own momentum, volume, or trend filters for higher-confidence trades.
█ Settings
Minimum Range Length: Number of candles required for a valid range to form.
Range Width Multiplier: Adjusts the envelope around the weighted average using ATR(2000).
Highlight Box Breaks: Enables real-time coloring of breakouts and breakdowns for immediate visual feedback.
-----------------
Disclaimer
The content provided in my scripts, indicators, ideas, algorithms, and systems is for educational and informational purposes only. It does not constitute financial advice, investment recommendations, or a solicitation to buy or sell any financial instruments. I will not accept liability for any loss or damage, including without limitation any loss of profit, which may arise directly or indirectly from the use of or reliance on such information.
All investments involve risk, and the past performance of a security, industry, sector, market, financial product, trading strategy, backtest, or individual's trading does not guarantee future results or returns. Investors are fully responsible for any investment decisions they make. Such decisions should be based solely on an evaluation of their financial circumstances, investment objectives, risk tolerance, and liquidity needs.

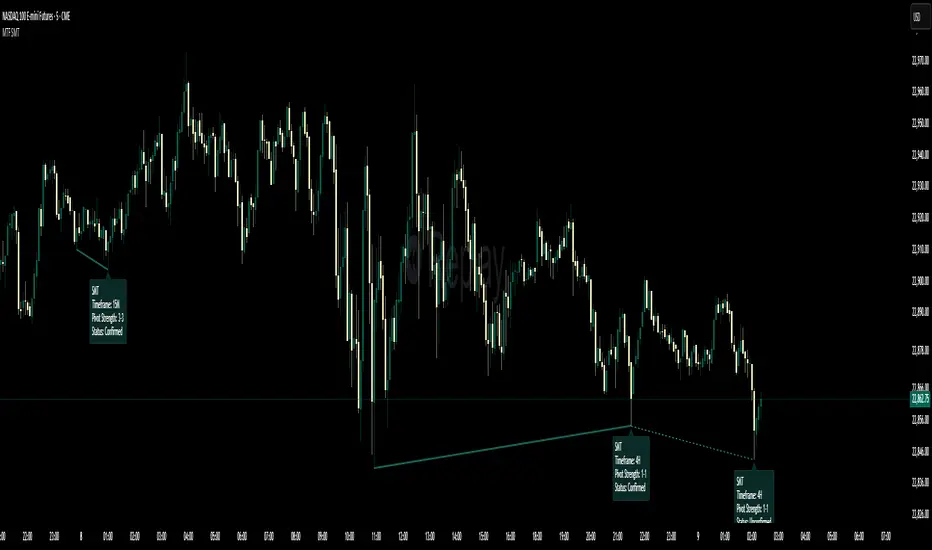
Multi-Timeframe SMTSummery
The Multi-Timeframe SMT indicator is designed to identify and visualize Higher Timeframe (HTF) data on a Lower Timeframe (LTF) chart, allowing traders to see the broader market context without changing their current chart's resolution. It accurately draws pivots and SMT divergences from higher timeframes on the corresponding candles of your current lower timeframe chart.
Its core features include:
Multi-Timeframe Analysis: Configure and monitor pivots on up to four independent timeframes, from intraday to monthly.
Customizable Pivot Detection: Define the strength of pivots by adjusting the number of bars to the left and right.
SMT Divergence: Automatically identifies bullish and bearish SMT divergences by comparing the price action of the main chart symbol with a chosen correlated asset.
Early SMT Detection: A unique feature that monitors a lower "detection timeframe" to provide early warnings of potential SMT setups before they're confirmed on the main timeframe. Note that this early detection is only shown on timeframes equal to or lower than the "Detection timeframe" you have set.
Visual Cues & Alerts: Clear on-chart labels, lines, and fully customizable alerts notify you of confirmed pivots and SMT divergences, ensuring you don't miss key opportunities.
Important Nuance Regarding Pivot Label Display
Due to a self-imposed limit within this script's drawing management logic, the indicator might quickly reach its drawing capacity if you enable pivot crosses for multiple timeframes simultaneously. When this internal drawing limit is exceeded, the script is designed to automatically remove the oldest drawings to make space for new ones.
Therefore, to ensure optimal performance and visibility of the most recent and relevant pivots, it's highly recommended to only enable the "Show Pivot Crosses" option for one timeframe at a time. If you wish to view pivots for a different timeframe, simply disable the pivot crosses for the currently active timeframe and then enable them for your desired one. This approach prevents the rapid cycling and disappearance of pivot labels, providing a clearer and more stable visual experience.
In-Depth Explanation of the Logic
This script is built on two primary concepts: pivot points and Smart Money Technique (SMT) divergence. It systematically collects historical data on multiple timeframes, identifies pivots, and then compares them between two assets to find divergences.
Pivot Point Identification
A pivot is a turning point in the market. A pivot high is a candle that has a higher high than the candles to its immediate left and right. Conversely, a pivot low is a candle with a lower low than its neighbors.
How it Works in the Script:
The script tracks the highest high and lowest low for each period of the selected timeframe (e.g., for each 4-hour candle). When a new high-timeframe candle closes, it stores that high/low value and its bar index in an array. The checkForPivot() function then checks if a recently stored high or low qualifies as a pivot.
Key Inputs:
Left Strength (leftBars1): The number of candles to the left that must have a lower high (for a pivot high) or higher low (for a pivot low).
Right Strength (rightBars1): The number of candles to the right that must meet the same criteria.
For example, with Left Strength and Right Strength both set to 3, a pivot high is only confirmed when its high is greater than the highs of the 3 previous high-timeframe candles and the 3 subsequent high-timeframe candles. Increasing these values will identify more significant, longer-term pivots.
Smart Money Technique (SMT) Divergence
SMT Divergence is a concept popularized by The Inner Circle Trader (ICT). It occurs when two closely correlated assets fail to move in sync. For instance, if Asset A makes a higher high but Asset B fails to do so and instead makes a lower high, this creates a bearish SMT divergence. It suggests that the "smart money" may not be supporting the move in Asset A, signaling a potential reversal.
Bearish SMT: Main asset makes a higher high, while the correlated asset makes a lower high. This is a potential sell signal.
Bullish SMT: Main asset makes a lower low, while the correlated asset makes a higher low. This is a potential buy signal.
How it Works in the Script:
Data Request: For each timeframe, the script uses the request.security() function to fetch the high and low data for both the main chart symbol (syminfo.tickerid) and the chosen Comparison Asset.
Pivot Comparison: When a new pivot is confirmed on the main asset, the script checks if a corresponding pivot also formed on the comparison asset at the same time.
Divergence Check: It then compares the direction of the pivots. For a bearish SMT, it checks if the main asset's new pivot high is higher than its previous pivot high, while the comparison asset's new pivot high is lower than its previous one. The logic is reversed for bullish SMT.
Visualization: If a divergence is found, the script draws a red (bearish) or green (bullish) line connecting the two pivots on your chart and places an "SMT" label.
Early SMT Detection
This is a proactive feature designed to give you a heads-up. Waiting for a 4-hour or daily pivot to form can take a long time. The early detection system looks for SMT divergences on a much smaller, user-defined Detection timeframe (e.g., 15-minute).
How it Works in the Script:
Awaiting Setup: After a primary pivot (Pivot A) is formed on the main timeframe (e.g., a Daily pivot high), the script begins monitoring.
Intraday Monitoring: It then watches the Detection timeframe (e.g., 15-minute) for smaller intraday pivots.
Potential Divergence: It looks for an intraday pivot that forms a divergence against the primary Pivot A.
Watchline & Alert: When this "potential" divergence occurs, the script draws a dashed white line and triggers a "Potential SMT" alert. This isn't a confirmed SMT on the main timeframe yet, but it's a powerful early warning that one may be forming.
Drawing & Object Management
To keep the chart clean and prevent performance issues, the script manages its drawings (lines and labels) efficiently. It stores them in arrays and uses a drawing limit to automatically delete the oldest drawings as new ones are created, ensuring your TradingView remains responsive.
How to Use the Indicator
Configuration
Enable Timeframes: Use the checkboxes (Enable Timeframe 1, Enable Timeframe 2, etc.) to activate the timeframes you want to monitor. It's often best to start with one or two to keep the chart clean.
Select Timeframes: Choose the higher timeframes you want to analyze (e.g., 240 for 4-hour, D for Daily, W for Weekly).
Set Pivot Strength: The default of 3 for Left/Right strength is a good starting point. Increase it to find more significant market structure points or decrease it for more frequent, shorter-term pivots.
Configure SMT:
Check Enable SMT for the timeframes where you want to detect divergence.
Enter a Comparison Asset . This is crucial. Ensure the assets are correlated.
To use the early warning system, check Enable early SMT detection and select an appropriate Detection timeframe (e.g., 15 or 60 minutes for a Daily analysis).
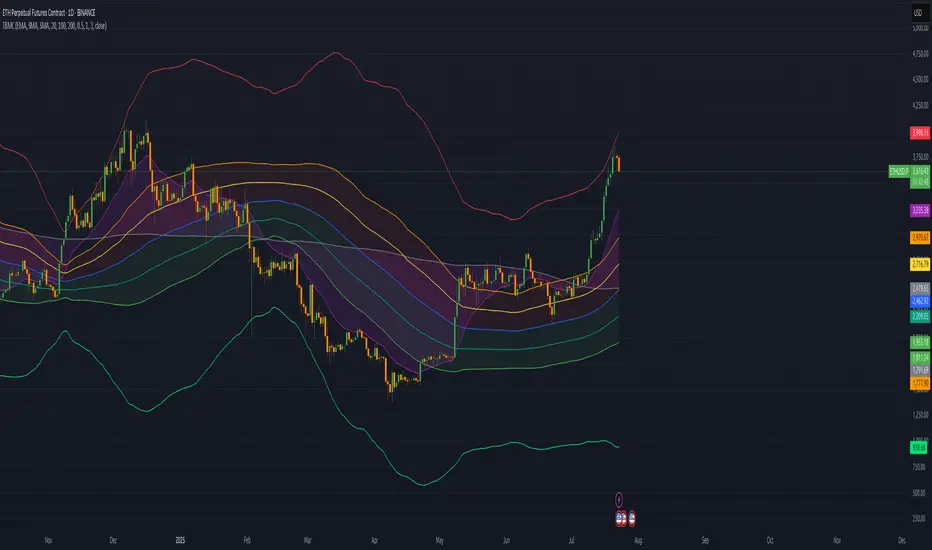
Triple Banded Momentum CloudTriple Banded Momentum Cloud (TBMC) is an advanced, customizable momentum indicator that blends multiple moving averages with layered volatility zones. It builds on the DBMC framework by allowing full control over the type and length of three distinct moving averages: signal, trend, and base.
Signal MA tracks short-term price momentum.
Trend MA anchors the core standard deviation bands.
Base MA provides long-term market context.
Three volatility bands (A/B/C) adapt dynamically to market conditions using user-defined standard deviation multipliers.
Momentum Cloud shades between signal and base for a directional read.
This tool is highly adaptable — suitable for trend-following, mean reversion, or volatility breakout strategies. Customization is key: choose MA types (SMA, EMA, RMA, etc.) to match your trading context.
MCPZ - Meme Coin Price Z-Score [Da_Prof]Meme Coin Price Z-score (MCPZ). Investor preference for meme coin trading may signal irrational exuberance in the crypto market. If a large spike in meme coin price is observed, a top may be near. Similarly, if a long price depression is observed, versus historical prices, that generally corresponds to investor apathy, leading to higher prices. The MEME.C symbol allows us to evaluate the sentiment of meme coin traders. Paired with the Meme Coin Volume (MCV) and Meme Coin Gains (MCG) indicators, the MCPZ helps to identify tops and bottoms in the overall meme coin market. The MCPZ indicator helps identify potential mania phases, which may signal nearing of a top and apathy phases, which may signal nearing a bottom. A moving average of the Z-score is used to smooth the data and help visualize changes in trend. In back testing, I found a 10-day sma of the MCPZ works well to signal tops and bottoms when extreme values of this indicator are reached. The MCPZ seems to spend a large amount of time near the low trigger line and short periods fast increase into mania phases.
Meme coins were not traded heavily prior to 2020, but the indicator still picks a couple of tops prior to 2020. Be aware that the meme coin space also increased massively in 2020, so mania phases may not spike quite as high moving forward and the indicator may need adjusting to catch tops. It is recommended to pair this indicator with the MCG and MCV indicators to create an overall picture.
The indicator grabs data from the MEME.C symbol on the daily such that it can be viewed on other symbols.
Use this indicator at your own risk. I make no claims as to its accuracy in forecasting future trend changes of memes or any other asset.
Hope this is helpful to you.
--Da_Prof

% / ATR Buy, Target, Stop + Overlay & P/L% / ATR Buy, Target, Stop + Overlay & P/L
This tool combines volatility‑based and fixed‑percentage trade planning into a single, on‑chart overlay—with built‑in profit‑and‑loss estimates. Toggle between ATR or percentage modes, plot your Buy, Target and Stop levels, and see the dollar gain or loss for a specified position size—all in one interactive table and chart display.
NOTE: To activate plotted lines, price labels, P/L rows and table values, enter a Buy Price greater than zero.
What It Does
Mode Toggle: Choose between “ATR” (volatility‑based) or “%” (fixed‑percentage) calculations.
Buy Price Input: Manually enter your entry price.
ATR Mode:
Target = Buy + (ATR × Target Multiplier)
Stop = Buy − (ATR × Stop Multiplier)
Percentage Mode:
Target = Buy × (1 + Target % / 100)
Stop = Buy × (1 – Stop % / 100)
P/L Estimates: Specify a dollar amount to “invest” at your Buy price, and the script calculates:
Gain ($): Profit if Target is hit
Loss ($): Cost if Stop is hit
Visual Overlay: Draws horizontal lines for Buy, Target and Stop, with optional price labels on the chart scale.
Interactive Table: Displays Buy, Target, Stop, ATR/timeframe info (in ATR mode), percentages (in % mode), and P/L rows.
Customization Options
Line Settings:
Choose color, style (solid/dashed/dotted), and width for Buy, Target, Stop lines.
Extend lines rightward only or in both directions.
Table Settings:
Position the table (top/bottom × left/right).
Toggle individual rows: Buy Price; Target (multiplier or %); Stop (multiplier or %); Target ATR %; Stop ATR %; ATR Time Frame; ATR Value; Gain ($); Loss ($).
Customize text colors for each row and background transparency.
General Inputs:
ATR length and optional ATR timeframe override (e.g. use daily ATR on an intraday chart).
Target/Stop multipliers or percentages.
Dollar Amount for P/L calculations.
How to Use It for Trading
Plan Your Entry: Enter your intended Buy Price and position size (dollar amount).
Select Mode: Toggle between ATR or % mode depending on whether you prefer volatility‑based or fixed offsets.
Assess R:R and P/L: Instantly see your Target, Stop levels, and potential profit or loss in dollars.
Visual Reference: Lines and price labels update in real time as you tweak inputs—ideal for live trading, backtesting or trade journaling.
Ideal For
Traders who want both volatility‑based and percentage‑based exit options in one tool
Those who need on‑chart P/L estimates based on position size
Swing and intraday traders focused on objective, rule‑based trade management
Anyone who uses ATR for adaptive stops/targets or fixed percentages for simpler exits
🧠 Aggressive RSI + EMA Strategy with TP/SL⚙️ How It Works
RSI-Based Entries:
Buys when RSI is below 40 (oversold) and trend is up (fast EMA > slow EMA).
Sells when RSI is above 60 (overbought) and trend is down (fast EMA < slow EMA).
Trend Filter:
Uses two EMAs (short/long) to filter signals and avoid trading against momentum.
Risk Management:
Default Take Profit: +1%
Default Stop Loss: -0.5%
This creates a 2:1 reward-to-risk setup.
📊 Backtest Settings
Initial Capital: $10,000
Order Size: 10% of equity per trade (adjustable)
Commission: 0.04% per trade (Binance spot-style)
Slippage: 2 ticks
Tested on: BTC/USDT – 15min timeframe (suitable for high-frequency scalping)
Trade Sample: (Adjust this based on your actual results.)
🔔 Features
Built-in alerts for buy/sell signals
Visual chart plots for entry/exit, RSI, EMAs
Customizable inputs for RSI thresholds, TP/SL %, EMA lengths
💡 Why It’s Unique
Unlike many RSI systems that trade blindly at 70/30 levels, this strategy adds a trend filter to boost signal quality.
The tight TP/SL configuration is tailored for scalpers and intraday momentum traders who prefer quick, consistent trades over long holds.

Market Structure🏗️ Market Structure Indicator for TradingView (Pine Script v6)
Overview:
The Market Structure indicator is a robust tool for identifying swing highs and swing lows across multiple structural levels:
🟤 Short-Term Swings
🟠 Intermediate-Term Swings
🟢 Long-Term Swings
It helps traders visually interpret market structure by detecting confirmed pivot points and promoting them through a hierarchical system. This provides a clear picture of trend direction, breakouts, and reversals.
⚙️ Features and Functionality:
✅ Multi-level Swing Detection:
The indicator promotes confirmed swing points from short-term to intermediate and long-term levels using a structured algorithm.
✅ Full Customization:
Toggle visibility of each swing level independently.
Choose custom colors for short, intermediate, and long-term swings.
✅ Transparent and Commented Logic:
The code contains well-structured functions for identifying and confirming swing highs and lows.
Label arrays are used for precise control over swing detection and display.
✅ Detailed and Open Source Code:
Every function is thoroughly explained with inline comments.
Designed to be easy to understand, modify, and extend — perfect for learning or integrating into more advanced systems.
📜 Open and Documented Source Code
The script is entirely open-source, written in Pine Script v6, and includes full documentation inside the code itself. Key sections include:
🔧 Input settings and visual configuration
🧠 Swing detection and confirmation methods
🔁 Promotion logic between structure levels
📈 Real-time label drawing on each bar
Everything is fully accessible and explained — no obfuscation, no hidden logic.
Momentum BandsMomentum Bands indicator-->technical tool that measures the rate of price change and surrounds this momentum with adaptive bands to highlight overbought and oversold zones. Unlike Bollinger Bands, which track price, these bands track momentum itself, offering a unique view of market strength and exhaustion points. At its core, it features a blue momentum line that calculates the rate of change over a set period, an upper red band marking dynamic resistance created by adding standard deviations to the momentum average, a lower green band marking dynamic support by subtracting standard deviations, and a gray middle line representing the average of momentum as a central anchor. When the momentum line touches or moves beyond the upper red band, it often signals that the market may be overbought and a pullback or reversal could follow; traders might lock in profits or watch for short setups. Conversely, when it drops below the lower green band, it can suggest an oversold market primed for a bounce, prompting traders to look for buying opportunities. If momentum remains between the bands, it typically indicates balanced conditions where waiting for stronger signals at the extremes is wise. The indicator can be used in contrarian strategies—buying near the lower band and selling near the upper—or in trend-following setups by waiting for momentum to return toward the centerline before entering trades. For stronger confirmation, traders often combine it with volume spikes, support and resistance analysis, or other trend tools, and it’s useful to check multiple timeframes to spot consistent patterns. Recommended settings vary: short-term traders might use a 7–10 period momentum with 14-period bands; medium-term traders might keep the default 14-period momentum and 20-period bands; while long-term analysis might use 21-period momentum and 50-period bands. Visually, background colors help spot extremes: red for strong overbought, green for strong oversold, and no color for normal markets, alongside reference lines at 70, 30, and 0 to guide traditional overbought, oversold, and neutral zones. Typical bullish signals include momentum rebounding from the lower band, crossing back above the middle after being oversold, or showing divergence where price makes new lows but momentum doesn’t. Bearish signals might appear when momentum hits the upper band and weakens, drops below the middle after being overbought, or price makes new highs while momentum fails to follow. The indicator tends to work best in mean-reverting or sideways markets rather than strong trends, where overbought and oversold conditions tend to repeat.

EMA/MA Unified with Pivot S/RTitle: Moving Average Combined with Pivot Point Support and Resistance Strategy
Description: This indicator combines two powerful trading concepts: 1. Moving Average Crossover; 2. Pivot Point Support and Resistance. It provides traders with a versatile tool.
Features:
Moving Average Crossover: Use moving average groups to identify trend trends. Contains multiple EMAs and one SMA to highlight short-term, medium-term and long-term market trends.
Detection of Golden Cross and Dead Cross: to predict market trends.
Support and Resistance: Dynamically identify key support and resistance levels based on pivot points. Configurable lookback period for left and right pivot points to suit different trading styles and time frames. Fast right pivot point option captures recent market volatility and optimizes support and resistance areas.
Customization:
Traders can adjust the length of the moving average according to their trading strategy. The support and resistance display can be toggled to get a clearer chart as needed.
Trend Analysis:
When EMA240S crosses EMA1440, a weak golden cross (X symbol) is drawn, suggesting that the main trend may turn to a bullish trend; when EMA720 crosses EMA1440, a strong golden cross (upward triangle) is drawn, suggesting that the main trend is likely to turn to a bullish trend.
When EMA240S crosses EMA1440, a weak death cross (X symbol) is drawn, suggesting that the main trend may turn to a bearish trend; when EMA720 crosses EMA1440, a strong death cross (downward triangle) is drawn, suggesting that the main trend is likely to turn to a bearish trend.
Visualization:
Moving averages are displayed in different color to depict the strength and direction of the trend.
Support and resistance levels are drawn in different color, enhancing the visual appeal and readability of key price levels.
This comprehensive indicator is designed for traders who seek to combine the accuracy of support and resistance analysis with the trend-following ability of moving average crossovers, providing a powerful basis for making informed trading decisions.
——————————————————————————————————————————————————————————
标题:
移动平均线结合轴枢点支阻位策略
描述:
该指标融合了两个强大的交易概念:1. 移动平均线交叉;2. 轴枢点支撑压力位。为交易者提供了一个多功能工具。
特点:
移动平均线交叉: 利用均线组识别趋势走势。包含多条EMA和一条SMA,以突出显示短期、中期和长期的市场趋势。
检测金叉和死叉:以预示市场趋势。
支撑位和阻力位: 基于枢轴点动态识别关键支撑位和阻力位。 可配置左右枢轴点的回溯期,以适应不同的交易风格和时间框架。 快速右轴点选项可捕捉近期市场波动并优化支撑位和阻力位区域。
自定义:
交易者可以根据自己的交易策略调整移动平均线的长度。 支撑位和阻力位显示可以切换,以便根据需要获得更清晰的图表。
趋势研判:
当EMA240S上穿EMA1440时,绘制弱金叉(X符号),暗示主趋势可能转为多头趋势;当EMA720上穿EMA1440时,绘制强金叉(向上三角),暗示主趋势大概率转为多头。
当EMA240S下穿EMA1440时,绘制弱死叉(X符号),暗示主趋势可能转为空头趋势;当EMA720下穿EMA1440时,绘制强死叉(向下三角),暗示主趋势大概率转为空头。
可视化:
移动平均线以不同的颜色显示,以描绘趋势的强度和方向。
支撑位和阻力位以不同的颜色绘制,增强了关键价格水平的视觉吸引力和可读性。
这款综合指标专为寻求将支撑位和阻力位分析的精准性与移动平均线交叉的趋势跟踪能力相结合的交易者而设计,为做出明智的交易决策提供了一个强大的判断依据。

MB Notes + ATR + EMA 5/10/20This custom indicator combines essential trading tools in a single overlay:
✅ MB Notes Panel (Top-Right):
A static display for manual input values labeled E-MB, V-MB, and C-MB. Ideal for tracking personal bias, setups, or trade context directly on the chart. Inputs are fully editable.
✅ ATR Table (Bottom-Right):
Automatically displays 14-period Average True Range on the 30-minute and 1-hour timeframes. Helps assess short-term volatility and manage stop-loss or position sizing more effectively.
✅ EMA Overlay:
Plots Exponential Moving Averages for periods 5, 10, and 20. These dynamic support/resistance levels help traders identify short-term trend direction and momentum shifts.
📌 Designed for intraday and swing traders who want a clean, customizable, and multi-purpose utility indicator.

1H LONG Setup CheckerThis TradingView script identifies high-probability long setups on the 1-hour chart by evaluating five key technical conditions: price above the 200 MA, a higher low structure, RSI above 50 and rising, a bullish MACD crossover, and a breakout above recent resistance. When at least four of these are met, it signals a potential long opportunity with a visual label and background highlight. This tool is useful for traders seeking objective, rule-based entries in trending markets like SOL/USDC and PEPE/USDC.

EMA BUY/SELLEMA
Buy/sell using ema cross over for making trading simple.
you even have the option to change the EMAs when needed
EMA Buy/SellBuy /Sell using EMA Crossover.
this gives early signal foy both buying and selling and one can use this to take the trades
Normalized Price Line with Adjustable Slope‑EMAThis anchored, normalized chart lets you see true percentage moves and swing pivots at a glance—removing guesswork about entry and exit levels. The noise‑filtered, slope‑colored EMAs then highlight only meaningful trend shifts, so you act on real momentum rather than every price twitch.
By anchoring price to a single starting bar, the indicator turns absolute price into a scale‑free “performance” line, where a value of 1.25 means price is up 25% since the anchor, and 0.80 means it’s down 20%. Overlaying that with a midpoint “shelf” line shows key swing levels where price has historically bounced or broken through. When your normalized price crosses above or below this reclaim level, you get an immediate read on whether a swing recovery or breakdown is occurring.
Layered on top are dynamically colored EMAs: a custom “Slope EMA” that changes color based on its recent slope, and classic 83‑ and 200‑period EMAs on the normalized series. The Slope EMA filters out noise by only turning your chosen up, down, or flat colors when its acceleration truly shifts. Meanwhile, crossovers of the faster 83‑EMA over the slower 200‑EMA give you traditional trend‑following confirmation. Together, these elements blend relative performance, structural support, and trend strength into one view—helping you spot higher‑probability entries and stay aligned with market momentum.
Intended for advanced users because user options are nuanced. For example, this indicator plots relative performance rather than raw price, you’ll want to toggle between linear and logarithmic scales (via the “Log” button on the y‑axis) and use the “Anchor” button to lock in your starting reference. That way, every move is shown in the same “language” of percentage moves, ensuring you’re comparing apples to apples across timeframes.

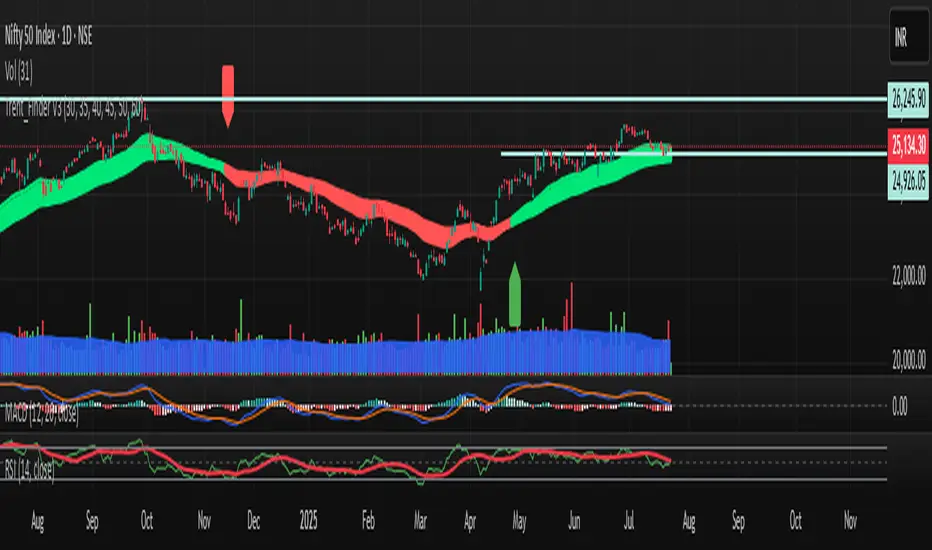
Trent_Finder V3EMA Inputs
It uses 6 EMAs with customizable lengths (defaults: 30, 35, 40, 45, 50, 60).
Trend Conditions
Bullish Trend: All EMAs are strictly ordered from smallest to largest, meaning short-term prices are leading long-term prices upward.
Bearish Trend: All EMAs are ordered from largest to smallest, meaning short-term prices are falling below long-term ones.
Neutral: EMAs are mixed and do not meet the above criteria.
Trend Tracking
The script remembers the current trend and only flips when a full trend reversal condition is confirmed.
Signals
A Buy Signal appears when a bearish or neutral trend changes to bullish.
A Sell Signal appears when a bullish or neutral trend flips to bearish.
Visual Aids
All 6 EMAs are plotted on the chart.
Green Lines = Bullish trend
Red Lines = Bearish trend
Gray Lines = No trend (neutral)
Buy/Sell markers appear at turning points.