MACD + EMA Zone Filter (with EMAs)How it works:
It plots 4 EMAs (Exponential Moving Averages):
EMA 20 (orange)
EMA 50 (yellow)
EMA 100 (blue)
EMA 200 (red)
A Buy signal is triggered when:
All three EMAs (20, 50, 100) are above EMA 200 (indicating an uptrend)
The MACD line crosses above the Signal line (bullish momentum)
A Sell signal is triggered when:
All three EMAs (20, 50, 100) are below EMA 200 (indicating a downtrend)
The MACD line crosses below the Signal line (bearish momentum)
📊 Visual Features:
Buy/Sell arrows directly on the chart
Background turns green in strong uptrends and red in strong downtrends
Built-in alerts for automation or notifications
🕒 Works on any timeframe, using the current chart's data.
use with fractals indicator for SL, aim for 1:2 RR
Trendtrading

Double MACD StrategyDouble MACD Strategy (Default Settings)
This automated strategy uses two independent MACD indicators to flip between long and short positions.
How It Works
• Fast MACD (MACD 1) captures rapid micro-trends
• Slow MACD (MACD 2) confirms broader momentum
• Long Entry when both MACD lines cross above their signal lines
• Short Entry when both MACD lines cross below their signal lines
• Existing opposing trades are closed before opening new ones
Default Input Settings
• Fast MACD (MACD 1)
• Fast Length 1: 12
• Slow Length 1: 26
• Signal Length 1: 9
• MA Type 1: EMA
• Slow MACD (MACD 2)
• Fast Length 2: 24
• Slow Length 2: 52
• Signal Length 2: 9
• MA Type 2: EMA
• Position Sizing: 100 % of equity
• Pyramiding: 1 concurrent entry per direction
Usage
1. Apply to any chart on your desired timeframe.
2. Monitor background shading (green for bullish, red for bearish bias).
3. Manage risk with your own stop loss, take profit, and position-sizing rules.
Disclaimer
This script is provided for educational purposes only. It is not financial advice or a recommendation to buy or sell any instrument. All trading involves risk, and any losses incurred are the sole responsibility of the trader.

📊 Visual MTF VMA Dashboard🔄️📊 Visual MTF VMA Dashboard🔄️
This powerful multi-timeframe indicator provides a clean, emoji-enhanced dashboard that helps you quickly identify the Variable Moving Average (VMA) trend direction across multiple key timeframes — all in real-time.
🔍 What It Does:
The Visual MTF VMA Dashboard calculates the LazyBear-style VMA on the following timeframes:
📆 Daily
🕰 195 Minutes
🕒 65 Minutes
⏳ 39 Minutes
⏱ 15 Minutes
Each cell in the table shows the current trend:
📈 BULLISH – VMA rising
📉 BEARISH – VMA falling
⚪ NEUTRAL – No change
🎨 Visual Boost:
This feature can be toggled on/off for cleaner visuals.
📌 Customization:
Adjustable VMA Length
Selectable table position: Top Left, Top Right, Bottom Left, Bottom Right
✅ Ideal For:
Multi-timeframe traders
Trend confirmation
Quick-glance analysis without cluttering your chart
Use this dashboard as a high-level trend confirmation tool — designed for simplicity, speed, and visual clarity.

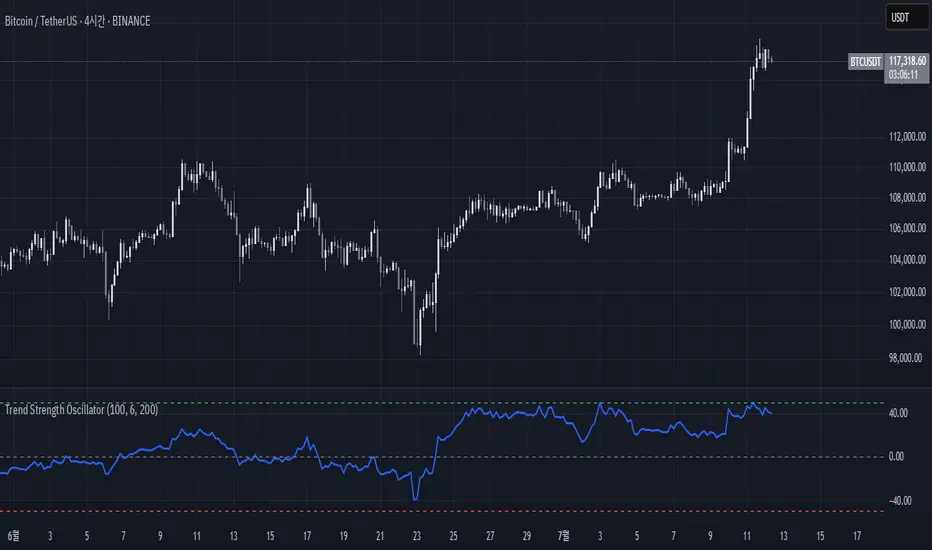
Trend Strength Oscillator📌 Trend Strength Oscillator
📄 Description
Trend Strength Oscillator measures the directional strength of price relative to an adaptive dynamic trend band. It evaluates how far the current price is from the midpoint of a trend channel and normalizes this value by recent volatility range, allowing traders to detect trend strength, direction, and potential exhaustion in any market condition.
📌 Features
🔹 Adaptive Trend Band Logic: Uses a modified ATR and time-dependent spread formula to dynamically adjust upper and lower trend bands.
🔹 Trendline Midpoint Calculation: The central trendline is defined as the average between upper and lower bands.
🔹 Relative Positioning: Measures how far the close is from the center of the band as a percentage.
🔹 Range Normalization: Uses a normalized range to account for recent volatility, reducing noise in the oscillator reading.
🔹 Oscillator Output (±100 scale):
+100 indicates strong bullish momentum
-100 indicates strong bearish momentum
0 is the neutral centerline
🛠️ How to Use
✅ Trend Strength > +50: Indicates a strong bullish phase.
✅ Trend Strength < -50: Indicates a strong bearish phase.
⚠️ Crossing above 0: Potential bullish trend initiation.
⚠️ Crossing below 0: Potential bearish trend initiation.
📉 Values near 0: Suggest trend weakness or ranging conditions.
Best suited timeframes: 1H, 4H, Daily
Ideal combination with: RSI, MACD, volume-based oscillators, moving average crosses
✅ TradingView House Rules Compliance
This indicator is written in Pine Script v5 and fully open-source.
The script does not repaint, does not generate false alerts, and does not access external or private data.
It is intended strictly as a technical analysis tool, and not a buy/sell signal generator.
Users are encouraged to combine this tool with other confirmations and independent judgment in trading decisions.
=========================================================
📌 Trend Strength Oscillator
📄 설명 (Description)
Trend Strength Oscillator는 가격이 동적 추세 밴드 내 어디에 위치해 있는지를 정량적으로 분석하여, 추세의 방향성과 강도를 시각적으로 보여주는 오실레이터 지표입니다. 최근 변동성을 반영한 밴드를 기반으로 가격 위치를 정규화하여, 과매수·과매도 상태나 추세의 소멸 가능성까지 탐지할 수 있도록 설계되었습니다.
📌 주요 특징 (Features)
🔹 적응형 추세 밴드 계산: ATR과 시간 경과를 기반으로 상단/하단 밴드를 동적으로 조정
🔹 중심 추세선 산출: 상단과 하단 밴드의 평균값을 중심선으로 활용하여 기준 축 제공
🔹 상대 위치 계산: 현재 종가가 중심선에서 얼마나 떨어져 있는지를 정규화하여 추세 강도 계산
🔹 변동성 기반 정규화: 최근 밴드 범위를 기준으로 상대 거리를 0~100 사이 값으로 변환
🔹 오실레이터 출력 (범위: ±100):
+100에 가까울수록 강한 상승 추세
-100에 가까울수록 강한 하락 추세
0에 가까울수록 횡보 구간 가능성
🛠️ 사용법 (How to Use)
✅ +50 이상: 강한 상승 추세 지속 중
✅ -50 이하: 강한 하락 추세 지속 중
⚠️ 0선 돌파 상향: 상승 추세 시작 가능성
⚠️ 0선 돌파 하향: 하락 추세 시작 가능성
🟡 0 근처 유지: 추세 약화 또는 횡보장 가능성
추천 시간대: 1시간봉, 4시간봉, 일봉
보조 지표로 추천: RSI, MACD, OBV, 이동평균 크로스 등과 함께 활용 시 효과적
✅ 트레이딩뷰 하우스룰 준수사항 (TradingView House Rules Compliance)
본 지표는 Pine Script v5로 작성된 오픈소스 공개용 스크립트입니다.
리페인트(Repaint) 현상이 없으며, **허위 경고(Spam Alerts)**나 성능 저하 요소도 없습니다.
외부 데이터 접근 없이 완전히 자체 계산으로 동작합니다.
이 지표는 투자 판단을 돕기 위한 분석용 도구이며, 직접적인 매수·매도 신호로 사용해서는 안 됩니다.
모든 트레이딩은 사용자의 독립적인 판단과 책임 하에 이루어져야 합니다.
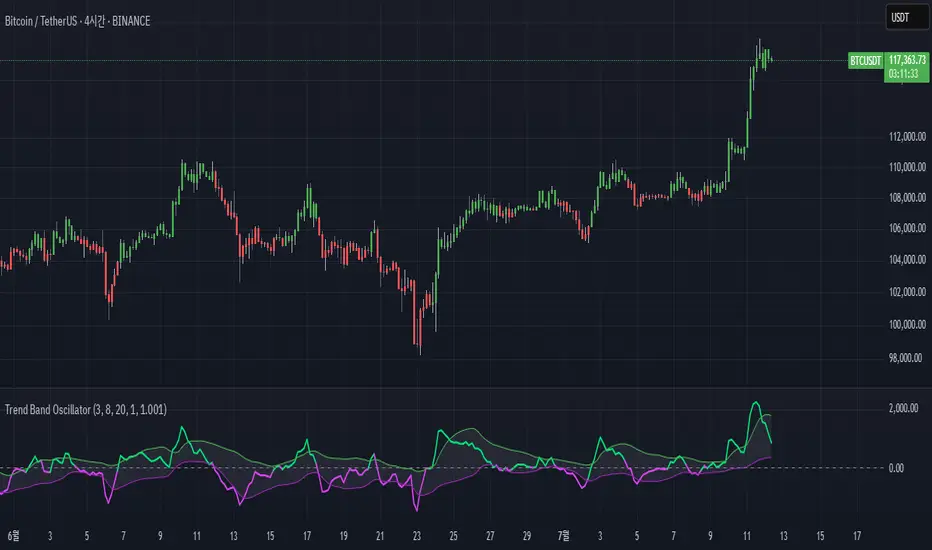
Trend Band Oscillator📌 Trend Band Oscillator
📄 Description
Trend Band Oscillator is a momentum-based trend indicator that calculates the spread between two EMAs and overlays it with a volatility filter using a standard deviation band. It helps traders visualize not only the trend direction but also the strength and stability of the trend.
📌 Features
🔹 EMA Spread Calculation: Measures the difference between a fast and slow EMA to quantify short-term vs mid-term trend dynamics.
🔹 Volatility Band Overlay: Applies an EMA of standard deviation to the spread to filter noise and highlight valid momentum shifts.
🔹 Color-Based Visualization: Positive spread values are shown in lime (bullish), negative values in fuchsia (bearish) for quick directional insight.
🔹 Upper/Lower Bands: Help detect potential overbought/oversold conditions or strong trend continuation.
🔹 Zero Line Reference: A horizontal baseline at zero helps identify trend reversals and neutral zones.
🛠️ How to Use
✅ Spread > 0: Indicates a bullish trend. Consider maintaining or entering long positions.
✅ Spread < 0: Indicates a bearish trend. Consider maintaining or entering short positions.
⚠️ Spread exceeds bands: May signal overextension or strong momentum; consider using with additional confirmation indicators.
🔄 Band convergence: Suggests weakening trend and potential transition to a ranging market.
Recommended timeframes: 1H, 4H, Daily
Suggested complementary indicators: RSI, MACD, OBV, SuperTrend
✅ TradingView House Rules Compliance
This script is open-source and published under Pine Script v5.
It does not repaint, spam alerts, or cause performance issues.
It is designed as an analytical aid only and should not be considered financial advice.
All calculations are transparent, and no external data sources or insecure functions are used.
====================================================================
📌 Trend Band Oscillator
📄 설명 (Description)
Trend Band Oscillator는 두 개의 EMA 간 스프레드(차이)를 기반으로 한 모멘텀 중심의 추세 오실레이터입니다. 여기에 표준편차 기반의 변동성 밴드를 적용하여, 추세의 방향뿐 아니라 강도와 안정성까지 시각적으로 분석할 수 있도록 설계되었습니다.
📌 주요 특징 (Features)
🔹 EMA 기반 스프레드 계산: Fast EMA와 Slow EMA의 차이를 활용해 시장 추세를 정량적으로 표현합니다.
🔹 표준편차 필터링: Spread에 대해 EMA 및 표준편차 기반의 밴드를 적용해 노이즈를 줄이고 유효한 추세를 강조합니다.
🔹 컬러 기반 시각화: 오실레이터 값이 양수일 경우 초록색, 음수일 경우 마젠타 색으로 추세 방향을 직관적으로 파악할 수 있습니다.
🔹 밴드 범위 시각화: 상·하위 밴드를 통해 스프레드의 평균 편차 범위를 보여주며, 추세의 강약과 포화 여부를 진단할 수 있습니다.
🔹 제로 라인 표시: 추세 전환 가능 지점을 시각적으로 확인할 수 있도록 중심선(0선)을 제공합니다.
🛠️ 사용법 (How to Use)
✅ 오실레이터가 0 이상 유지: 상승 추세 구간이며, 롱 포지션 유지 또는 진입 검토
✅ 오실레이터가 0 이하 유지: 하락 추세 구간이며, 숏 포지션 유지 또는 진입 검토
⚠️ 상·하위 밴드를 이탈: 일시적인 과매수/과매도 혹은 강한 추세 발현 가능성 있음 → 다른 보조지표와 함께 필터링 권장
🔄 밴드 수렴: 추세가 약해지고 있음을 나타냄 → 변동성 하락 또는 방향성 상실 가능성 있음
권장 적용 시간대: 1시간봉, 4시간봉, 일봉
보조 적용 지표: RSI, MACD, OBV, SuperTrend 등과 함께 사용 시 신호 필터링에 유리
✅ 트레이딩뷰 하우스룰 준수사항 (TV House Rules Compliance)
이 지표는 **무료 공개용(Open-Source)**이며, Pine Script Version 5로 작성되어 있습니다.
과도한 리페인트, 비정상적 반복 경고(alert spam), 실시간 성능 저하 등의 요소는 포함되어 있지 않습니다.
사용자는 본 지표를 투자 결정의 참고용 보조 도구로 활용해야 하며, 독립적인 매매 판단이 필요합니다.
데이터 소스 및 계산 방식은 완전히 공개되어 있으며, 외부 API나 보안 취약점을 유발하는 구성 요소는 없습니다.
The Great Anchors: Dual AVWAP Powered by RSI
The Great Anchors
*Dual Anchored Volume Weighted Average Price Powered by RSI*
---
📌 Overview
The Great Anchors is a dual AVWAP-based indicator that resets dynamically using RSI extremes — either from the current asset or a master symbol (e.g., BTCUSDT). It identifies meaningful shifts in price structure and momentum using these "anchored" levels.
It’s designed to help traders spot trend continuations, momentum inflection points, and entry signals aligned with overbought/oversold conditions — but only when the market confirms through volume-weighted price direction.
---
🛠 Core Logic
• AVWAP 1 (favwap): Anchored when RSI reaches overbought levels (top anchor)
• AVWAP 2 (savwap): Anchored when RSI reaches oversold levels (bottom anchor)
• AVWAPs are recalculated each time a new OB/OS condition is triggered — acting like "fresh anchors" at key market turning points.
---
⚙️ Key Features
🔁 Auto or Manual RSI Thresholds
→ Automatically determines dynamic RSI OB/OS levels based on past peaks and troughs, or lets you set fixed levels.
🧠 Master Symbol Control
→ Use the RSI of a separate asset (like BTCUSDT, ETHUSDT, SOLUSDT, BNBUSDT, SUPRAUSDT) or indices (like TOTAL, TOTAL2, BFR) to control resets — ideal for tracking how BTC/major coins impacts altcoins/others.
🔍 Trend-Filtering Signal Logic
→ Signals are filtered for less noise and are triggered when:
- Both AVWAPs are rising (bullish) or falling (bearish)
- Price action confirms the structure
🎯 Visual Markers & Alerts
→ "💥" for bullish signals and "🔥" for bearish ones. Alerts included for automation or push notifications.
---
🎯 How to Use It
1. Add the indicator to your chart.
2. Choose whether to use RSI from the current symbol or a master symbol (e.g., BTC).
3. Select auto-adjusted or manual OB/OS levels.
4. Watch for:
- AVWAP(s) making a significant change (at this point it's one of the AVWAPs resetting)
- Check if price flip it upwards or downwards
- If price goes above both AVWAPs thats a likely bullish trend
- If price can't go above both AVWAPs up and fall bellow both that's a likely bearish trend
- Price retesting upper AVWAP and bounce
- likely bullish continuation
- Price retesting lower AVWAP and dip
- likely bearish continuation
- Signal icons on chart ("💥 - Bullish" or "🔥- Bearish")
Best suited for:
• Swing traders
• Momentum traders
• Traders timing altcoin entries using BTC/Major asset's RSI
---
🔔 Signal Explanation
💥 Bullish Signal =
• Both AVWAPs rising
• Higher lows in price structure
• Bullish candle close
• Triggered from overbought RSI reset
🔥 Bearish Signal =
• Both AVWAPs falling
• Lower highs in price structure
• Bearish candle close
• Triggered from oversold RSI reset
Signals reset by opposite signals to prevent noise or overfitting.
---
⚠️ Tips & Notes
• Use AVWAPs as dynamic support/resistance, even without signal triggers
• Pair with volume or divergence tools for stronger confirmation
---
🧩 Credits & Philosophy
This tool is built with a simple philosophy:
"Anchor your trades to meaningful moments in price — not arbitrary time."
The dual AVWAP concept helps you see how price reacts after momentum peaks, giving you a cleaner bias and more precise trade setups.
---

Stochastic SuperTrend [BigBeluga]🔵 OVERVIEW
A hybrid momentum-trend tool that combines Stochastic RSI with SuperTrend logic to deliver clean directional signals based on momentum turns.
Stochastic SuperTrend is a straightforward yet powerful oscillator overlay designed to highlight turning points in momentum with high clarity. It overlays a SuperTrend-style envelope onto the Stochastic RSI, generating intuitive up/down signals when a momentum shift occurs across the neutral 50 level. Built for traders who appreciate simplicity without sacrificing reliability.
🔵 CONCEPTS
Stochastic RSI: Measures momentum by applying stochastic calculations to the RSI curve instead of raw price.
SuperTrend Bands: Dynamic upper/lower bands are drawn around the smoothed Stoch RSI line using a user-defined multiplier.
Momentum Direction: Trend flips when the smoothed Stoch RSI crosses above/below the calculated bands.
Neutral Bias Filter: Directional arrows only appear when momentum turns above or below the central 50 level—adding confluence.
🔵 FEATURES
Trend Detection on Oscillator: Applies SuperTrend logic directly to the Stoch RSI curve.
Clean Entry Signals:
→ 🢁 arrow printed when trend flips bullish below 50 (bottom reversals).
→ 🢃 arrow printed when trend flips bearish above 50 (top reversals).
Custom Multiplier: Adjust sensitivity of SuperTrend band spacing around the oscillator.
Neutral Zone Highlight: Visual zone between 0–50 (green) and 50–100 (red) for quick momentum polarity reference.
Toggle SuperTrend Line: Option to show/hide the SuperTrend trail on the Stoch RSI.
🔵 HOW TO USE
Use 🢁 signals for potential bottom reversals when momentum flips bullish from oversold regions.
Use 🢃 signals for potential top reversals when momentum flips bearish from overbought areas.
Combine with price-based SuperTrend or support/resistance zones for confluence.
Suitable for scalping, swing trading, or momentum filtering across all timeframes.
🔵 CONCLUSION
Stochastic SuperTrend is a simple yet refined tool that captures clean momentum shifts with directional clarity. Whether you're identifying reversals, filtering entries, or spotting exhaustion in a trend, this oscillator overlay delivers just what you need— no clutter, just clean momentum structure.

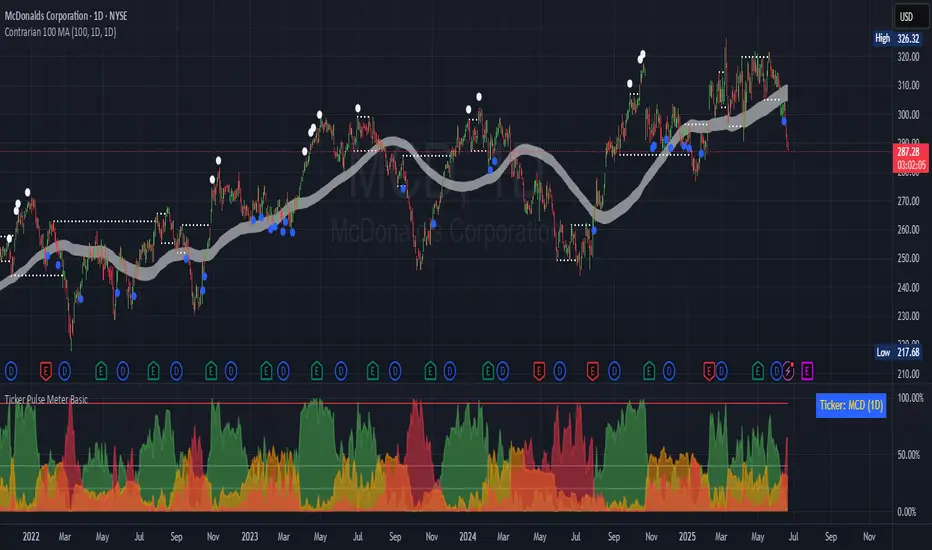
Ticker Pulse Meter + Fear EKG StrategyDescription
The Ticker Pulse Meter + Fear EKG Strategy is a technical analysis tool designed to identify potential entry and exit points for long positions based on price action relative to historical ranges. It combines two proprietary indicators: the Ticker Pulse Meter (TPM), which measures price positioning within short- and long-term ranges, and the Fear EKG, a VIX-inspired oscillator that detects extreme market conditions. The strategy is non-repainting, ensuring signals are generated only on confirmed bars to avoid false positives. Visual enhancements, such as optional moving averages and Bollinger Bands, provide additional context but are not core to the strategy's logic. This script is suitable for traders seeking a systematic approach to capturing momentum and mean-reversion opportunities.
How It Works
The strategy evaluates price action using two key metrics:
Ticker Pulse Meter (TPM): Measures the current price's position within short- and long-term price ranges to identify momentum or overextension.
Fear EKG: Detects extreme selling pressure (akin to "irrational selling") by analyzing price behavior relative to historical lows, inspired by volatility-based oscillators.
Entry signals are generated when specific conditions align, indicating potential buying opportunities. Exits are triggered based on predefined thresholds or partial position closures to manage risk. The strategy supports customizable lookback periods, thresholds, and exit percentages, allowing flexibility across different markets and timeframes. Visual cues, such as entry/exit dots and a position table, enhance usability, while optional overlays like moving averages and Bollinger Bands provide additional chart context.
Calculation Overview
Price Range Calculations:
Short-Term Range: Uses the lowest low (min_price_short) and highest high (max_price_short) over a user-defined short lookback period (lookback_short, default 50 bars).
Long-Term Range: Uses the lowest low (min_price_long) and highest high (max_price_long) over a user-defined long lookback period (lookback_long, default 200 bars).
Percentage Metrics:
pct_above_short: Percentage of the current close above the short-term range.
pct_above_long: Percentage of the current close above the long-term range.
Combined metrics (pct_above_long_above_short, pct_below_long_below_short) normalize price action for signal generation.
Signal Generation:
Long Entry (TPM): Triggered when pct_above_long_above_short crosses above a user-defined threshold (entryThresholdhigh, default 20) and pct_below_long_below_short is below a low threshold (entryThresholdlow, default 40).
Long Entry (Fear EKG): Triggered when pct_below_long_below_short crosses under an extreme threshold (orangeEntryThreshold, default 95), indicating potential oversold conditions.
Long Exit: Triggered when pct_above_long_above_short crosses under a profit-taking level (profitTake, default 95). Partial exits are supported via a user-defined percentage (exitAmt, default 50%).
Non-Repainting Logic: Signals are calculated using data from the previous bar ( ) and only plotted on confirmed bars (barstate.isconfirmed), ensuring reliability.
Visual Enhancements:
Optional moving averages (SMA, EMA, WMA, VWMA, or SMMA) and Bollinger Bands can be enabled for trend context.
A position table displays real-time metrics, including open positions, Fear EKG, and Ticker Pulse values.
Background highlights mark periods of high selling pressure.
Entry Rules
Long Entry:
TPM Signal: Occurs when the price shows strength relative to both short- and long-term ranges, as defined by pct_above_long_above_short crossing above entryThresholdhigh and pct_below_long_below_short below entryThresholdlow.
Fear EKG Signal: Triggered by extreme selling pressure, when pct_below_long_below_short crosses under orangeEntryThreshold. This signal is optional and can be toggled via enable_yellow_signals.
Entries are executed only on confirmed bars to prevent repainting.
Exit Rules
Long Exit: Triggered when pct_above_long_above_short crosses under profitTake.
Partial exits are supported, with the strategy closing a user-defined percentage of the position (exitAmt) up to four times per position (exit_count limit).
Exits can be disabled or adjusted via enable_short_signal and exitPercentage settings.
Inputs
Backtest Start Date: Defines the start of the backtesting period (default: Jan 1, 2017).
Lookback Periods: Short (lookback_short, default 50) and long (lookback_long, default 200) periods for range calculations.
Resolution: Timeframe for price data (default: Daily).
Entry/Exit Thresholds:
entryThresholdhigh (default 20): Threshold for TPM entry.
entryThresholdlow (default 40): Secondary condition for TPM entry.
orangeEntryThreshold (default 95): Threshold for Fear EKG entry.
profitTake (default 95): Exit threshold.
exitAmt (default 50%): Percentage of position to exit.
Visual Options: Toggle for moving averages and Bollinger Bands, with customizable types and lengths.
Notes
The strategy is designed to work across various timeframes and assets, with data sourced from user-selected resolutions (i_res).
Alerts are included for long entry and exit signals, facilitating integration with TradingView's alert system.
The script avoids repainting by using confirmed bar data and shifted calculations ( ).
Visual elements (e.g., SMA, Bollinger Bands) are inspired by standard Pine Script practices and are optional, not integral to the core logic.
Usage
Apply the script to a chart, adjust input settings to suit your trading style, and use the visual cues (entry/exit dots, position table) to monitor signals. Enable alerts for real-time notifications.
Designed to work best on Daily timeframe.

Uptrick: Fusion Trend Reversion SystemOverview
The Uptrick: Fusion Trend Reversion System is a multi-layered indicator designed to identify potential price reversals during intraday movement while keeping traders informed of the dominant short-term trend. It blends a composite fair value model with deviation logic and a refined momentum filter using the Relative Strength Index (RSI). This tool was created with scalpers and short-term traders in mind and is especially effective on lower timeframes such as 1-minute, 5-minute, and 15-minute charts where price dislocations and quick momentum shifts are frequent.
Introduction
This indicator is built around the fusion of two classic concepts in technical trading: identifying trend direction and spotting potential reversion points. These are often handled separately, but this system merges them into one process. It starts by computing a fair value price using five moving averages, each with its own mathematical structure and strengths. These include the exponential moving average (EMA), which gives more weight to recent data; the simple moving average (SMA), which gives equal weight to all periods; the weighted moving average (WMA), which progressively increases weight with recency; the Arnaud Legoux moving average (ALMA), known for smoothing without lag; and the volume-weighted average price (VWAP), which factors in volume at each price level.
All five are averaged into a single value — the raw fusion line. This fusion acts as a dynamically balanced centerline that adapts to price conditions with both smoothing and responsiveness. Two additional exponential moving averages are applied to the raw fusion line. One is slower, giving a stable trend reference, and the other is faster, used to define momentum and cloud behavior. These two lines — the fusion slow and fusion fast — form the backbone of trend and signal logic.
Purpose
This system is meant for traders who want to trade reversals without losing sight of the underlying directional bias. Many reversal indicators fail because they act too early or signal too frequently in choppy markets. This script filters out noise through two conditions: price deviation and RSI confirmation. Reversion trades are considered only when the price moves a significant distance from fair value and RSI suggests a legitimate shift in momentum. That filtering process gives the trader a cleaner, higher-quality signal and reduces false entries.
The indicator also visually supports the trader through colored bars, up/down labels, and a filled cloud between the fast and slow fusion lines. These features make the market context immediately visible: whether the trend is up or down, whether a reversal just occurred, and whether price is currently in a high-risk reversion zone.
Originality and Uniqueness
What makes this script different from most reversal systems is the way it combines layers of logic — not just to detect signals, but to qualify and structure them. Rather than relying on a single MA or a raw RSI level, it uses a five-MA fusion to create a baseline fair value that incorporates speed, stability, and volume-awareness.
On top of that, the system introduces a dual-smoothing mechanism. It doesn’t just smooth price once — it creates two layers: one to follow the general trend and another to track faster deviations. This structure lets the script distinguish between continuation moves and possible turning points more effectively than a single-line or single-metric system.
It also uses RSI in a more refined way. Instead of just checking if RSI is overbought or oversold, the script smooths RSI and requires directional confirmation. Beyond that, it includes signal memory. Once a signal is generated, a new one will not appear unless the RSI becomes even more extreme and curls back again. This memory-based gating reduces signal clutter and prevents repetition, a rare feature in similar scripts.
Why these indicators were merged
Each moving average in the fusion serves a specific role. EMA reacts quickly to recent price changes and is often favored in fast-trading strategies. SMA acts as a long-term filter and smooths erratic behavior. WMA blends responsiveness with smoothing in a more balanced way. ALMA focuses on minimizing lag without losing detail, which is helpful in fast markets. VWAP anchors price to real trade volume, giving a sense of where actual positioning is happening.
By combining all five, the script creates a fair value model that doesn’t lean too heavily on one logic type. This fusion is then smoothed into two separate EMAs: one slower (trend layer), one faster (signal layer). The difference between these forms the basis of the trend cloud, which can be toggled on or off visually.
RSI is then used to confirm whether price is reversing with enough force to warrant a trade. The RSI is calculated over a 14-period window and smoothed with a 7-period EMA. The reason for smoothing RSI is to cut down on noise and avoid reacting to short, insignificant spikes. A signal is only considered if price is stretched away from the trend line and the smoothed RSI is in a reversal state — below 30 and rising for bullish setups, above 70 and falling for bearish ones.
Calculations
The script follows this structure:
Calculate EMA, SMA, WMA, ALMA, and VWAP using the same base length
Average the five values to form the raw fusion line
Smooth the raw fusion line with an EMA using sens1 to create the fusion slow line
Smooth the raw fusion line with another EMA using sens2 to create the fusion fast line
If fusion slow is rising and price is above it, trend is bullish
If fusion slow is falling and price is below it, trend is bearish
Calculate RSI over 14 periods
Smooth RSI using a 7-period EMA
Determine deviation as the absolute difference between current price and fusion slow
A raw signal is flagged if deviation exceeds the threshold
A raw signal is flagged if RSI EMA is under 30 and rising (bullish setup)
A raw signal is flagged if RSI EMA is over 70 and falling (bearish setup)
A final signal is confirmed for a bullish setup if RSI EMA is lower than the last bullish signal’s RSI
A final signal is confirmed for a bearish setup if RSI EMA is higher than the last bearish signal’s RSI
Reset the bullish RSI memory if RSI EMA rises above 30
Reset the bearish RSI memory if RSI EMA falls below 70
Store last signal direction and use it for optional bar coloring
Draw the trend cloud between fusion fast and fusion slow using fill()
Show signal labels only if showSignals is enabled
Bar and candle colors reflect either trend slope or last signal direction depending on mode selected
How it works
Once the script is loaded, it builds a fusion line by averaging five different types of moving averages. That line is smoothed twice into a fast and slow version. These two fusion lines form the structure for identifying trend direction and signal areas.
Trend bias is defined by the slope of the slow line. If the slow line is rising and price is above it, the market is considered bullish. If the slow line is falling and price is below it, it’s considered bearish.
Meanwhile, the script monitors how far price has moved from that slow line. If price is stretched beyond a certain distance (set by the threshold), and RSI confirms that momentum is reversing, a raw reversion signal is created. But the script only allows that signal to show if RSI has moved further into oversold or overbought territory than it did at the last signal. This blocks repetitive, weak entries. The memory is cleared only if RSI exits the zone — above 30 for bullish, below 70 for bearish.
Once a signal is accepted, a label is drawn. If the signal toggle is off, no label will be shown regardless of conditions. Bar colors are controlled separately — you can color them based on trend slope or last signal, depending on your selected mode.
Inputs
You can adjust the following settings:
MA Length: Sets the period for all moving averages used in the fusion.
Show Reversion Signals: Turns on the plotting of “Up” and “Down” labels when a reversal is confirmed.
Bar Coloring: Enables or disables colored bars based on trend or signal direction.
Show Trend Cloud: Fills the space between the fusion fast and slow lines to reflect trend bias.
Bar Color Mode: Lets you choose whether bars follow trend logic or last signal direction.
Sens 1: Smoothing speed for the slow fusion line — higher values = slower trend.
Sens 2: Smoothing speed for the fast line — lower values = faster signal response.
Deviation Threshold: Minimum distance price must move from fair value to trigger a signal check.
Features
This indicator offers:
A composite fair value model using five moving average types.
Dual smoothing system with user-defined sensitivity.
Slope-based trend definition tied to price position.
Deviation-triggered signal logic filtered by RSI reversal.
RSI memory system that blocks repetitive signals and resets only when RSI exits overbought or oversold zones.
Real-time tracking of the last signal’s direction for optional bar coloring.
Up/Down labels at signal points, visible only when enabled.
Optional trend cloud between fusion layers, visualizing current market bias.
Full user control over smoothing, threshold, color modes, and visibility.
Conclusion
The Fusion Trend-Reversion System is a tool for short-term traders looking to fade price extremes without ignoring trend bias. It calculates fair value using five diverse moving averages, smooths this into two dynamic layers, and applies strict reversal logic based on RSI deviation and momentum strength. Signals are triggered only when price is stretched and momentum confirms it with increasingly strong behavior. This combination makes the tool suitable for scalping, intraday entries, and fast market environments where precision matters.
Disclaimer
This indicator is for informational and educational purposes only. It does not constitute financial advice. All trading involves risk, and no tool can predict market behavior with certainty. Use proper risk management and do your own research before making trading decisions.

Ticker Pulse Meter BasicPairs nicely with the Contrarian 100 MA located here:
and the Enhanced Stock Ticker with 50MA vs 200MA located here:
Description
The Ticker Pulse Meter Basic is a dynamic Pine Script v6 indicator designed to provide traders with a visual representation of a stock’s price position relative to its short-term and long-term ranges, enabling clear entry and exit signals for long-only trading strategies. By calculating three normalized metrics—Percent Above Long & Above Short, Percent Above Long & Below Short, and Percent Below Long & Below Short—this indicator offers a unique "pulse" of market sentiment, plotted as stacked area charts in a separate pane. With customizable lookback periods, thresholds, and signal plotting options, it empowers traders to identify optimal entry points and profit-taking levels. The indicator leverages Pine Script’s force_overlay feature to plot signals on either the main price chart or the indicator pane, making it versatile for various trading styles.
Key Features
Pulse Meter Metrics:
Computes three percentages based on short-term (default: 50 bars) and long-term (default: 200 bars) lookback periods:
Percent Above Long & Above Short: Measures price strength when above both short and long ranges (green area).
Percent Above Long & Below Short: Indicates mixed momentum (orange area).
Percent Below Long & Below Short: Signals weakness when below both ranges (red area).
Flexible Signal Plotting:
Toggle between plotting entry (blue dots) and exit (white dots) signals on the main price chart (location.abovebar/belowbar) or in the indicator pane (location.top/bottom) using the Plot Signals on Main Chart option.
Entry/Exit Logic:
Long Entry: Triggered when Percent Above Long & Above Short crosses above the high threshold (default: 20%) and Percent Below Long & Below Short is below the low threshold (default: 40%).
Long Exit: Triggered when Percent Above Long & Above Short crosses above the profit-taking level (default: 95%).
Visual Enhancements:
Plots stacked area charts with semi-transparent colors (green, orange, red) for intuitive trend analysis.
Displays threshold lines for entry (high/low) and profit-taking levels.
Includes a ticker and timeframe table in the top-right corner for quick reference.
Alert Conditions: Supports alerts for long entry and exit signals, integrable with TradingView’s alert system for automated trading.
Technical Innovation: Combines normalized price metrics with Pine Script v6’s force_overlay for seamless signal integration on the price chart or indicator pane.
Technical Details
Calculation Logic:
Uses confirmed bars (barstate.isconfirmed) to calculate metrics, ensuring reliability.
Short-term percentage: (close - lowest(low, lookback_short)) / (highest(high, lookback_short) - lowest(low, lookback_short)).
Long-term percentage: (close - lowest(low, lookback_long)) / (highest(high, lookback_long) - lowest(low, lookback_long)).
Derived metrics:
pct_above_long_above_short = (pct_above_long * pct_above_short) * 100.
pct_above_long_below_short = (pct_above_long * (1 - pct_above_short)) * 100.
pct_below_long_below_short = ((1 - pct_above_long) * (1 - pct_above_short)) * 100.
Signal Plotting:
Entry signals (long_entry) use ta.crossover to detect when pct_above_long_above_short crosses above entryThresholdhigh and pct_below_long_below_short is below entryThresholdlow.
Exit signals (long_exit) use ta.crossover for pct_above_long_above_short crossing above profitTake.
Signals are plotted as tiny circles with force_overlay=true for main chart or standard plotting for the indicator pane.
Performance Considerations: Optimized for efficiency by calculating metrics only on confirmed bars and using lightweight plotting functions.
How to Use
Add to Chart:
Copy the script into TradingView’s Pine Editor and apply it to your chart.
Configure Settings:
Short Lookback Period: Adjust the short-term lookback (default: 50 bars) for sensitivity.
Long Lookback Period: Set the long-term lookback (default: 200 bars) for broader context.
Entry Thresholds: Modify high (default: 20%) and low (default: 40%) thresholds for entry conditions.
Profit Take Level: Set the exit threshold (default: 95%) for profit-taking.
Plot Signals on Main Chart: Check to display signals on the price chart; uncheck for the indicator pane.
Interpret Signals:
Long Entry: Blue dots indicate a strong bullish setup when price is high relative to both lookback ranges and weakness is low.
Long Exit: White dots signal profit-taking when strength reaches overbought levels.
Use the stacked area charts to assess trend strength and momentum.
Set Alerts:
Create alerts for Long Entry and Long Exit conditions using TradingView’s alert system.
Customize Visuals:
Adjust colors and thresholds via TradingView’s settings for better visibility.
The ticker table displays the symbol and timeframe in the top-right corner.
Example Use Cases
Swing Trading: Use entry signals to capture short-term bullish moves within a broader uptrend, exiting at profit-taking levels.
Trend Confirmation: Monitor the green area (Percent Above Long & Above Short) for sustained bullish momentum.
Market Sentiment Analysis: Use the stacked areas to gauge bullish vs. bearish sentiment across timeframes.
Notes
Testing: Backtest the indicator on your chosen market and timeframe to validate its effectiveness.
Compatibility: Built for Pine Script v6 and tested on TradingView as of June 20, 2025.
Limitations: Signals are long-only; adapt the script for short strategies if needed.
Enhancements: Consider adding a histogram for the difference between metrics or additional thresholds for nuanced trading.
Acknowledgments
Inspired by public Pine Script examples and designed to simplify complex market dynamics into a clear, actionable tool. For licensing or support, contact Chuck Schultz (@chuckaschultz) on TradingView. Share feedback in the comments, and happy trading!
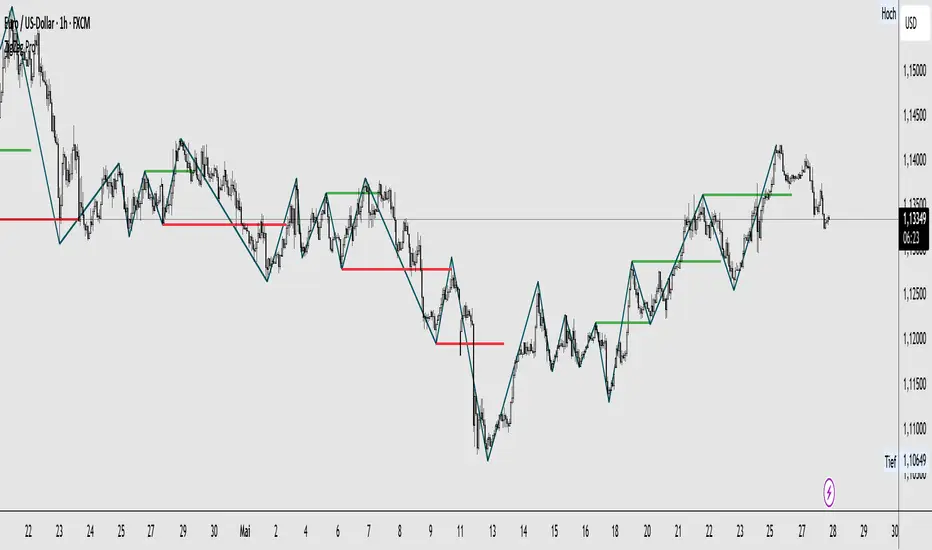
Deviation Trend Profile [BigBeluga]🔵 OVERVIEW
A statistical trend analysis tool that combines moving average dynamics with standard deviation zones and trend-specific price distribution.
This is an experimental indicator designed for educational and learning purposes only.
🔵 CONCEPTS
Trend Detection via SMA Slope: Detects trend shifts when the slope of the SMA exceeds a ±0.1 threshold.
Standard Deviation Zones: Calculates ±1, ±2, and ±3 levels from the SMA using ATR, forming dynamic envelopes around the mean.
Trend Distribution Profile: Builds a histogram that shows how often price closed within each deviation zone during the active trend phase.
🔵 FEATURES
Trend Signals: Immediate shift markers using colored circles at trend reversals.
SMA Gradient Coloring: The SMA line dynamically changes color based on its directional slope.
Trend Duration Label: A label above the histogram shows how many bars the current trend has lasted.
Trend Distribution Histogram: Visual bin-based profile showing frequency of price closes within deviation bands during trend lookback period.
Adjustable Bin Count: Set the granularity of the distribution using the “Bins Amount” input.
Deviation Labels and Zones: Clearly marked ±1, ±2, ±3 lines with consistent color scheme.
Trend Strength Insight:
• Wide profile skewed to ±2/3 = strong directional trend.
• Profile clustered near SMA = potential trend exhaustion or range.
🔵 HOW TO USE
Use trend shift dots as entry signals:
• 🔵 = Bullish start
• 🔴 = Bearish start
Trade with the trend when price clusters in outer zones (±2 or ±3).
Be cautious or fade the trend when price distribution contracts toward the SMA.
View across multiple timeframes for trend confluence or divergence.
🔵 CONCLUSION
Deviation Trend Profile visualizes how price distributes during trends relative to statistical deviation zones.
It’s a powerful confluence tool for identifying strength, exhaustion, and the rhythm of price behavior—ideal for swing traders and volatility analysts alike.

PRO Investing - LevelPRO Investing - Level
📊 Dynamic Support/Resistance
This indicator plots the PRO Investing Level, defined as the midpoint between the highest high and lowest low over the past 252 trading days (default lookback period, equivalent to ~1 year). It acts as a key mean-reversion reference level, useful for identifying potential support/resistance zones or market equilibrium levels.
Features:
🕰️ Option to display only today’s level or historical levels.
⚙️ Customizable lookback period for flexibility across timeframes and strategies.
📉 Teal line plotted directly on the chart, highlighting this institutional-grade level.
Ideal for traders looking to anchor price action to significant historical ranges—particularly useful in mean-reversion, breakout, or volatility compression strategies.

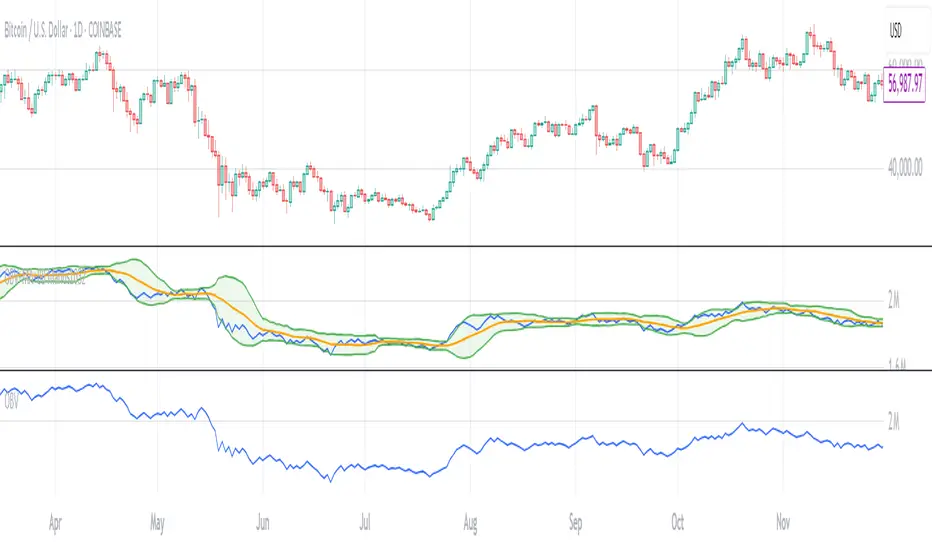
OBV with MA & Bollinger Bands by Marius1032OBV with MA & Bollinger Bands by Marius1032
This script adds customizable moving averages and Bollinger Bands to the classic OBV (On Balance Volume) indicator. It helps identify volume-driven momentum and trend strength.
Features:
OBV-based trend tracking
Optional smoothing: SMA, EMA, RMA, WMA, VWMA
Optional Bollinger Bands with SMA
Potential Combinations and Trading Strategies:
Breakouts: Look for price breakouts from the Bollinger Bands, and confirm with a rising OBV for an uptrend or falling OBV for a downtrend.
Trend Reversals: When the price touches a Bollinger Band, examine the OBV for divergence. A bullish divergence (price lower low, OBV higher low) near the lower band could signal a reversal.
Volume Confirmation: Use OBV to confirm the strength of the trend indicated by Bollinger Bands. For example, if the BBs indicate an uptrend and OBV is also rising, it reinforces the bullish signal.
1. On-Balance Volume (OBV):
Purpose: OBV is a momentum indicator that uses volume flow to predict price movements.
Calculation: Volume is added on up days and subtracted on down days.
Interpretation: Rising OBV suggests potential upward price movement. Falling OBV suggests potential lower prices.
Divergence: Divergence between OBV and price can signal potential trend reversals.
2. Moving Average (MA):
Purpose: Moving Averages smooth price fluctuations and help identify trends.
Combination with OBV: Pairing OBV with MAs helps confirm trends and identify potential reversals. A crossover of the OBV line and its MA can signal a trend reversal or continuation.
3. Bollinger Bands (BB):
Purpose: BBs measure market volatility and help identify potential breakouts and trend reversals.
Structure: They consist of a moving average (typically 20-period) and two standard deviation bands.
Combination with OBV: Combining BBs with OBV allows for a multifaceted approach to market analysis. For example, a stock hitting the lower BB with a rising OBV could indicate accumulation and a potential upward reversal.
Created by: Marius1032
Trend Impulse Channels (Zeiierman)█ Overview
Trend Impulse Channels (Zeiierman) is a precision-engineered trend-following system that visualizes discrete trend progression using volatility-scaled step logic. It replaces traditional slope-based tracking with clearly defined “trend steps,” capturing directional momentum only when price action decisively confirms a shift through an ATR-based trigger.
This tool is ideal for traders who prefer structured, stair-step progression over fluid curves, and value the clarity of momentum-based bands that reveal breakout conviction, pullback retests, and consolidation zones. The channel width adapts automatically to market volatility, while the step logic filters out noise and false flips.
⚪ The Structural Assumption
This indicator is built on a core market structure observation:
After each strong trend impulse, the market typically enters a “cooling-off” phase as profit-taking occurs and counter-trend participants enter. This often results in a shallow pullback or stall, creating a slight negative slope in an uptrend (or a positive slope in a downtrend).
These “cooling-off” phases don’t reverse the trend — they signal temporary pressure before the next leg continues. By tracking trend steps discretely and filtering for this behavior, Trend Impulse Channels helps traders align with the rhythm of impulse → pause → impulse.
█ How It Works
⚪ Step-Based Trend Engine
At the heart of this tool is a dynamic step engine that progresses only when price crosses a predefined ATR-scaled trigger level:
Trigger Threshold (× ATR) – Defines how far price must break beyond the current trend state to register a new trend step.
Step Size (Volatility-Guided) – Each trend continuation moves the trend line in discrete units, scaling with ATR and trend persistence.
Trend Direction State – Maintains a +1/-1 internal bias to support directional filters and step tracking.
⚪ Volatility-Adaptive Channel
Each step is wrapped inside a dynamic envelope scaled to current volatility:
Upper and Lower Bands – Derived from ATR and band multipliers to expand/contract as volatility changes.
⚪ Retest Signal System
Optional signal markers show when price re-tests the upper or lower band:
Upper Retest → Pullback into resistance during a bearish trend.
Lower Retest → Pullback into support during a bullish trend.
⚪ Trend Step Signals
Circular markers can be shown to mark each time the trend steps forward, making it easy to identify structurally significant moments of continuation within a larger trend.
█ How to Use
⚪ Trend Alignment
Use the Trend Line and Step Markers to visually confirm the direction of momentum. If multiple trend steps occur in sequence without reversal, this typically signals strong conviction and trend persistence.
⚪ Retest-Based Entries
Wait for pullbacks into the channel and monitor for triangle retest signals. When used in confluence with trend direction, these offer high-quality continuation setups.
⚪ Breakouts
Look for breakouts beyond the upper or lower band after a longer period of pause. For higher likelihood of success, look for breakouts in the direction of the trend.
█ Settings
Trigger Threshold (× ATR) - Defines how far price must move to register a new trend step. Controls sensitivity to trend flips.
Max Step Size (× ATR) - Caps how far each trend step can extend. Prevents runaway step expansion in high volatility.
Band Multiplier (× ATR) - Expands the upper and lower channels. Controls how much breathing room the bands allow.
Trend Hold (bars) - Minimum number of bars the trend must remain active before allowing a flip. Helps reduce noise.
Filter by Trend - Restrict retest signals to those aligned with the current trend direction.
-----------------
Disclaimer
The content provided in my scripts, indicators, ideas, algorithms, and systems is for educational and informational purposes only. It does not constitute financial advice, investment recommendations, or a solicitation to buy or sell any financial instruments. I will not accept liability for any loss or damage, including without limitation any loss of profit, which may arise directly or indirectly from the use of or reliance on such information.
All investments involve risk, and the past performance of a security, industry, sector, market, financial product, trading strategy, backtest, or individual's trading does not guarantee future results or returns. Investors are fully responsible for any investment decisions they make. Such decisions should be based solely on an evaluation of their financial circumstances, investment objectives, risk tolerance, and liquidity needs.

Trendline Breakouts With Volume Strength [TradeDots]Trendline Breakouts With Volume Strength is an innovative indicator designed to identify potential market turning points using pivot-based trendline detection and volume confirmation. By merging dynamic trendline analysis with multi-tiered volume filters, this tool helps traders quickly spot breakouts or breakdowns that may signal significant shifts in price action.
📝 HOW IT WORKS
1. Pivot-Based Trendline Detection
The script automatically scans for recent pivot highs and lows over a user-defined lookback period.
When it finds higher pivot lows, it plots green uptrend lines; when it finds lower pivot highs, it plots red downtrend lines.
These dynamic lines update as new pivots form, providing continuously refreshed trend guidance.
2. Volume Ratio Analysis
A moving average of volume is compared against the current bar’s volume to calculate a ratio (e.g., 1.5×, 2×).
Higher ratios suggest above-average volume, often interpreted as stronger participation.
The script applies color-coded cues to highlight the intensity of volume surges.
3. Breakout & Breakdown Detection
Each trendline is monitored for a defined “break threshold,” which helps avoid minor penetrations that can trigger premature signals.
When price closes beyond a threshold below an uptrend line, the indicator labels it a “BREAKDOWN.” If it closes above a threshold on a downtrend line, it labels it a “BREAKOUT.”
Volume surges accompanying these breaks are highlighted with contextual emojis and distinct color gradients for quick visual reference.
4. Trend Direction Table
A small on-chart table provides a snapshot of the current market trend—Uptrend, Downtrend, or Sideways—based on a simple moving average slope and the number of active uptrend or downtrend lines.
This table also displays quick stats on how many lines are actively tracked, helping traders assess the broader market posture at a glance.
🛠️ HOW TO USE
1. Choose a Timeframe
This script works on multiple timeframes. Intraday traders can monitor minute or hourly charts for frequent pivot updates, while swing and position traders may prefer daily or weekly intervals to reduce noise.
2. Observe Trendlines & Labels
Watch for newly drawn green/red lines connecting pivots.
When you see a “BREAKOUT” or “BREAKDOWN” label, confirm whether volume was abnormally high based on the ratio or color-coded bars.
3. Consult the Trend Table
Use the table in the bottom-right corner to quickly check if the market is trending or range-bound.
Look at the count of active uptrend vs. downtrend lines to gauge broader sentiment.
4. Employ Additional Analysis
Combine these signals with other tools (e.g., candlestick patterns, oscillators, or fundamental analysis).
Validate potential breakouts using standard techniques like retests or support/resistance checks.
❗️LIMITATIONS
Delayed Pivots: Trendlines only adjust once new pivot highs or lows form, which can introduce a slight lag in highly volatile environments.
Choppy Markets: Rapid, back-and-forth price moves may produce conflicting trendline signals and frequent breakouts/breakdowns.
Volume Data Reliability: Gaps in volume data or unusual market conditions (holidays, low-liquidity sessions) can skew ratio readings.
RISK DISCLAIMER
Trading any financial instrument involves substantial risk, and this indicator does not guarantee profits or prevent losses. All signals and visual cues are for educational and informational purposes only; past performance does not assure future outcomes. You retain full responsibility for your trading decisions, including proper risk management, position sizing, and the use of additional confirmation methods. Always consider the possibility of losing some or all of your original investment.

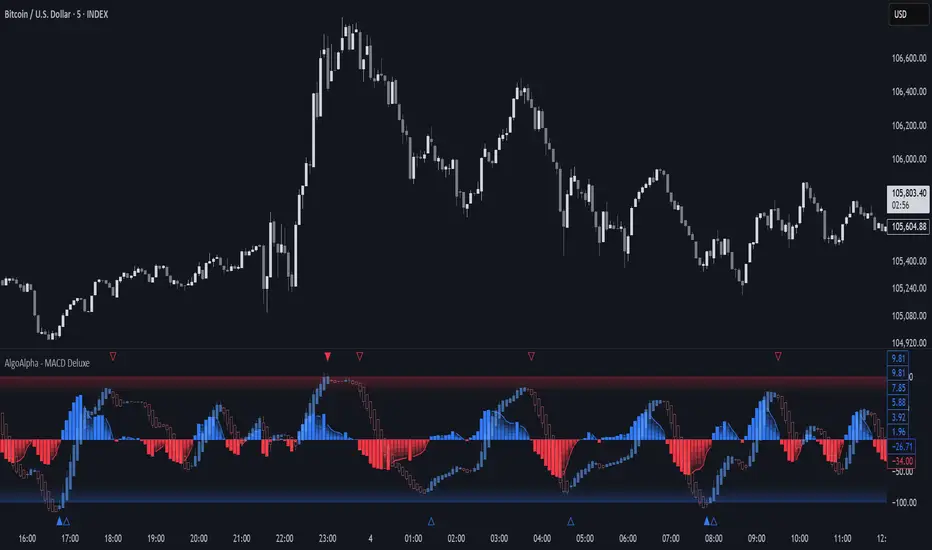
Adaptive MACD Deluxe [AlgoAlpha]OVERVIEW
This script is an advanced rework of the classic MACD indicator, designed to be more adaptive, visually informative, and customizable. It enhances the original MACD formula using a dynamic feedback loop and a correlation-based weighting system that adjusts in real-time based on how deterministic recent price action is. The signal line is flexible, offering several smoothing types including Heiken Ashi, while the histogram is color-coded with gradients to help users visually identify momentum shifts. It also includes optional normalization by volatility, allowing MACD values to be interpreted as relative percentage moves, making the indicator more consistent across different assets and timeframes.
CONCEPTS
This version of MACD introduces a deterministic weight based on R-squared correlation with time, which modulates how fast or slow the MACD adapts to price changes. Higher correlation means smoother, slower MACD responses, and low correlation leads to quicker reaction. The momentum calculation blends traditional EMA math with feedback and damping components to create a smoother, less noisy series. Heiken Ashi is optionally used for signal smoothing to better visualize short-term trend bias. When normalization is enabled, the MACD is scaled by an EMA of the high-low range, converting it into a bounded, volatility-relative indicator. This makes extreme readings more meaningful across markets.
FEATURES
The script offers six distinct options for signal line smoothing: EMA, SMA, SMMA (RMA), WMA, VWMA, and a custom Heiken Ashi mode based on the MACD series. Each option provides a different response speed and smoothing behavior, allowing traders to match the indicator’s behavior to their strategy—whether it's faster reaction or reduced noise.
Normalization is another key feature. When enabled, MACD values are scaled by a volatility proxy, converting the indicator into a relative percentage. This helps standardize the MACD across different assets and timeframes, making overbought and oversold readings more consistent and easier to interpret.
Threshold zones can be customized using upper and lower boundaries, with inner zones for early warnings. These zones are highlighted on the chart with subtle background fills and directional arrows when MACD enters or exits key levels. This makes it easier to spot strong or weak reversals at a glance.
Lastly, the script includes multiple built-in alerts. Users can set alerts for MACD crossovers, histogram flips above or below zero, and MACD entries into strong or weak reversal zones. This allows for hands-free monitoring and quick decision-making without staring at the chart.
USAGE
To use this script, choose your preferred signal smoothing type, enable normalization if you want MACD values relative to volatility, and adjust the threshold zones to fit your asset or timeframe. Use the colored histogram to detect changes in momentum strength—brighter colors indicate rising strength, while faded colors imply weakening. Heiken Ashi mode smooths out noise and provides clearer signals, especially useful in choppy conditions. Use alert conditions for crossover and reversal detection, or monitor the arrow markers for entries into potential exhaustion zones. This setup works well for trend following, momentum trading, and reversal spotting across all market types.
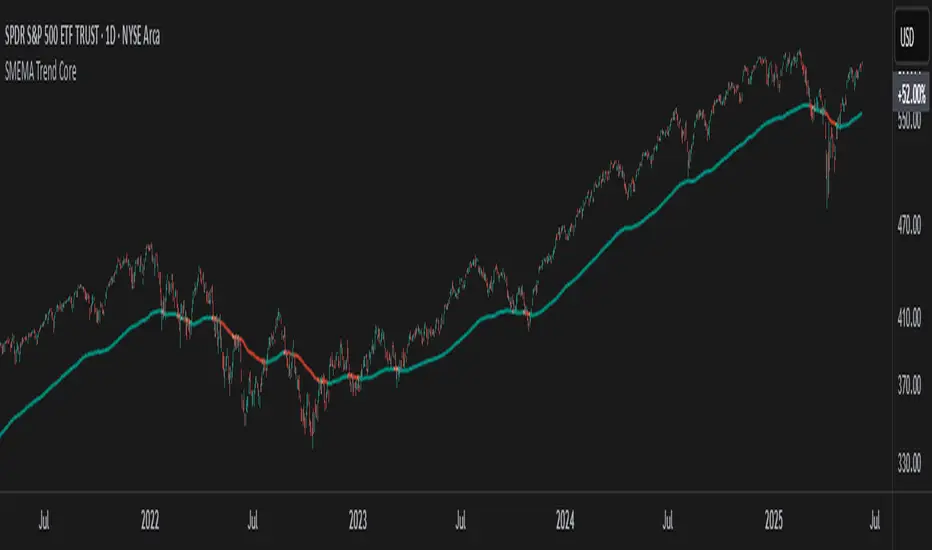
SMEMA Trend CoreSMEMA Trend Core is a multi-timeframe trend analysis tool designed to provide a clean, adaptive and structured view of the market’s directional bias. It can be used in short term, swing or long term contexts. The internal calculation adjusts automatically based on the selected trading style, while always combining data from six timeframes.
At its core, the indicator uses a SMEMA, which is a Simple Moving Average applied to an EMA. This combination improves smoothness without losing reactivity. The SMEMA is calculated separately on 1H, 4H, 1D, 3D, 1W and 1M timeframes. These six values are then combined using dynamic weights that depend on the trading mode:
Short Term mode gives more influence to 1H and 4H
Swing Trading mode gives more influence to 1D, 3D and 1W
Long Term mode gives more influence to 1W and 1M
However, all six timeframes are always included in the final result. This avoids the tunnel vision of relying on a single resolution and ensures that the indicator captures both local and structural movements.
The result is a synthetic trend line, called Global SMEMA, that adapts to market conditions and offers a realistic view of the ongoing trend. To enhance the reading, the indicator calculates a Trend Score. This score reflects the position of price relative to the Global SMEMA, scaled by a long-term ATR, and adjusted by the slope of the trend line. A hyperbolic tangent function is used to normalize values and reduce distortion from outliers.
The final score is capped between -10 and +10, and used to define the trend state:
Green when the trend is bullish (score > +1.5)
Red when the trend is bearish (score < -1.5)
Brown when the trend is neutral (score between -1.5 and +1.5)
Optional Deviation Bands can be displayed at ±1, ±2 and ±3 ATR distances around the central line. These dynamic zones help identify extended price movements or potential support and resistance areas, depending on the current trend bias.
Main features:
A single, stable trend line based on six timeframes
Automatic rebalancing depending on trading mode
Quantified score integrating distance and slope
No overreaction to short-term noise
Deviation zones for advanced market context
No repainting, no lookahead, 100% real-time
SMEMA Trend Core is not a signal tool. It is a directional framework that helps you stay aligned with the real structure of the market. Use it to confirm setups, filter trades or simply understand where the market stands in its trend cycle.
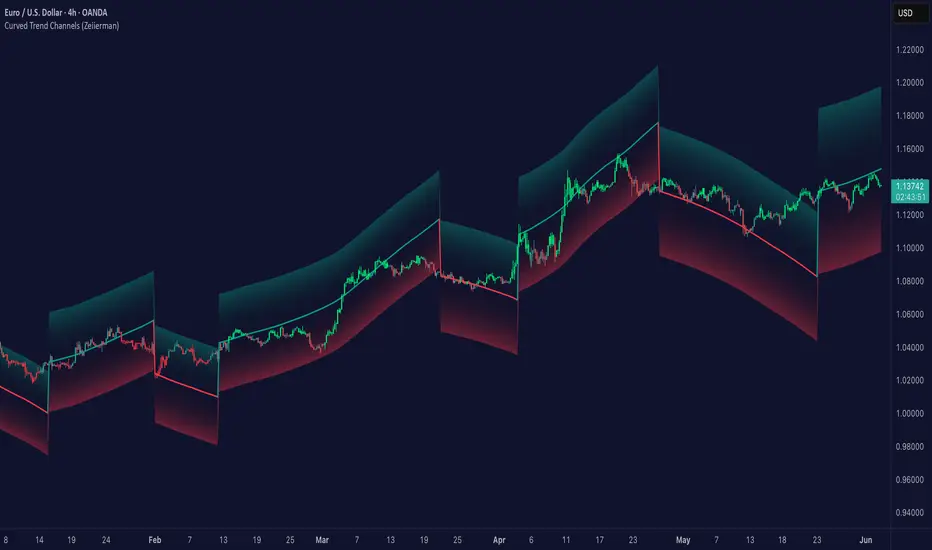
Curved Trend Channels (Zeiierman)█ Overview
Curved Trend Channels (Zeiierman) is a next-generation trend visualization tool engineered to adapt dynamically to both linear and non-linear market behavior. It introduces a novel curvature-based channeling system that grows over time during trending conditions, mirroring the natural acceleration of price trends, while simultaneously leveraging adaptive range filtering and dual-layer candle trend logic.
This tool is ideal for traders seeking smooth yet reactive dynamic channels that evolve with market structure. Whether used in curved mode or traditional slope mode, it provides exceptional clarity on trend transitions, volatility compression, and breakout development.
█ How It Works
⚪ Adaptive Range Filter Foundation
The core of the system is a volatility-based range filter that determines the underlying structure of the bands:
Pre-Smoothing of High/Low Data – Highs and lows are smoothed using a selectable moving average (SMA, EMA, HMA, KAMA, etc.) before calculating the volatility range.
Volatility Envelope – The range is scaled using a fixed factor (2.618) and further adjusted by a Band Multiplier to form the primary envelope around price.
Smoothed Volatility Curve – Final bands are stabilized using a long lookback, ensuring clean visual structure and trend clarity.
⚪ Curved Channel Logic
In Curved Mode, the trend channel grows over time when the trend direction remains unchanged:
Base Step Size (× ATR) – Sets the minimum unit of slope change.
Growth per Bar (× ATR) – Defines the acceleration rate of the channel slope with time.
Trend Persistence Recognition – The longer a trend persists, the more pronounced the slope becomes, mimicking real market accelerations.
This dynamic, time-dependent logic enables the channel to "curve" upward or downward, tracking long-standing trends with increasing confidence.
⚪ Trend Slope
As an alternative to curved logic, traders can activate a regular Trend slope using:
Slope Length – Determines how quickly the trend line adapts to price shifts.
Multiplicative Factor – Amplifies the sensitivity of the slope, useful in fast-moving markets or lower timeframes.
⚪ Candle Trend Confirmation
A robust second-layer trend detection method, the Candle Trend System evaluates directional pressure by analyzing smoothed price action:
Multi-tier Smoothing – Trend lines are derived from short-, medium-, and long-term candle movement.
█ How to Use
⚪ Trend Identification
When the Trend Line direction and Candle Colors are in agreement, this indicates strong, persistent directional conviction. Use these moments to enter with trend confirmation and manage risk more confidently.
⚪ Retest
During ongoing trends, the price will often pull back into the dynamic channel. Look for:
Support/resistance interactions at the upper or lower bands.
█ Settings
Scaled Volatility Length – Controls the historical depth used to stabilize the volatility bands.
Smoothing Type – Choose from HMA, KAMA, VIDYA, FRAMA, Super Smoother, etc. to match your asset and trading style.
Volatility MA Length – Smoothing length for the calculated range; shorter = more reactive.
High/Low Smoother Length – Additional smoothing to reduce noise from spikes or false pivots.
Band Multiplier – Widens or tightens the band range based on personal preference.
Enable Curved Channel – Toggle between curved or regular trend slope behavior.
Base Step (× ATR) – The starting point for curved slope progression.
Growth per Bar (× ATR) – How much the slope accelerates per bar during a sustained trend.
Slope – Reactivity of the standard trend line to price movements.
Multiplicative Factor – Sensitivity adjustment for HyperTrend slope.
Candle Trend Length – Lookback period for trend determination from candle structure.
-----------------
Disclaimer
The content provided in my scripts, indicators, ideas, algorithms, and systems is for educational and informational purposes only. It does not constitute financial advice, investment recommendations, or a solicitation to buy or sell any financial instruments. I will not accept liability for any loss or damage, including without limitation any loss of profit, which may arise directly or indirectly from the use of or reliance on such information.
All investments involve risk, and the past performance of a security, industry, sector, market, financial product, trading strategy, backtest, or individual's trading does not guarantee future results or returns. Investors are fully responsible for any investment decisions they make. Such decisions should be based solely on an evaluation of their financial circumstances, investment objectives, risk tolerance, and liquidity needs.
Directional Strength IndexThis indicator is designed to detect the dominant market direction and quantify its strength by aggregating signals across six key timeframes: 1H, 4H, 1D, 3D, 1W, and 1M.
At its core, it uses a SMEMA 'the Simple Moving Average of an EMA' as the main trend reference. This hybrid smoothing method was chosen for its balance: the EMA ensures responsiveness to recent price moves, while the SMA dampens short-term volatility. This makes the SMEMA more stable than a raw EMA and more reactive than a simple SMA, especially in noisy or volatile environments.
For each timeframe, a score between -10 and +10 is calculated. This score reflects:
- the distance of the price from the SMEMA, using ATR as a dynamic threshold
- the number of price deviations above or below the SMEMA
- the slope of the SMEMA, which adjusts the score based on momentum
These six timeframe scores are then combined into a single Global Score, using weighted averages. Three weighting profiles are available depending on your trading horizon:
- Long Term: emphasizes weekly and monthly data
- Swing Trading: gives balanced importance to all timeframes
- Short Term: prioritizes 1H and 4H action
This multi-timeframe aggregation makes the indicator adaptable to different styles while maintaining a consistent logic.
The result is displayed in a table on the chart, showing:
- the trend direction per timeframe (up, down or neutral)
- the strength score per timeframe
- the overall trend direction and strength based on the selected profile
Optional deviation bands based on ATR multiples are also plotted to provide visual context for overextensions relative to the SMEMA.
This indicator is non-repainting and built for objective, trend-based decision making.

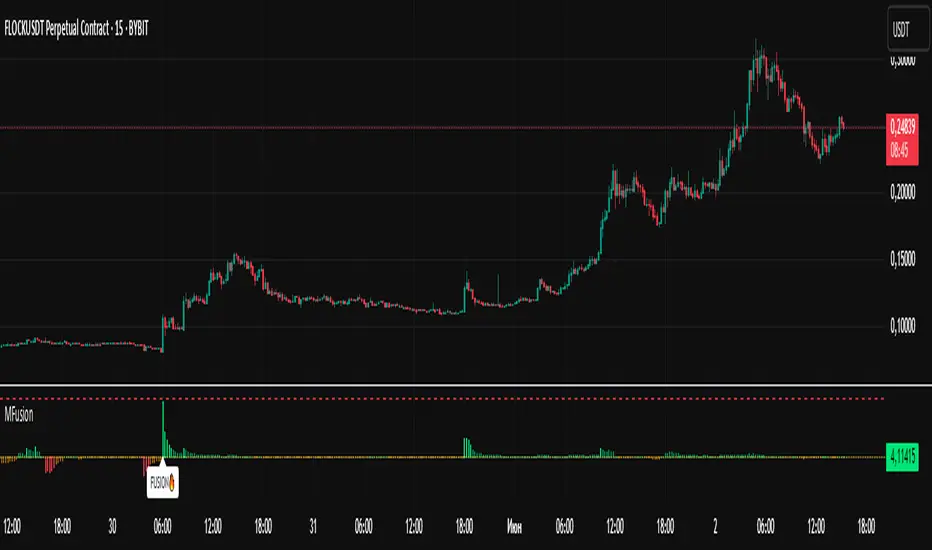
Momentum Fusion v1Momentum Fusion v1
Overview
Momentum Fusion v1 (MFusion) is a multi-oscillator indicator that combines several components to analyze market momentum and trend strength. It incorporates modified versions of classic indicators such as PVI (Positive Volume Index), NVI (Negative Volume Index), MFI (Money Flow Index), RSI, Stochastic, and Bollinger Bands Oscillator. The indicator displays a histogram that changes color based on momentum strength and includes "FUSION🔥" signal labels when extreme values are reached.
Indicator Settings
Parameters:
EMA Length – Smoothing period for the moving average (default: 255).
Smoothing Period – Internal calculation smoothing parameter (default: 15).
BB Multiplier – Standard deviation multiplier for Bollinger Bands (default: 2.0).
Show verde / marron / media lines – Toggles the display of auxiliary lines.
Show FUSION🔥 label – Enables/disables signal labels.
Indicator Components
1. PVI (Positive Volume Index)
Formula:
pvi := volume > volume ? nz(pvi ) + (close - close ) / close * sval : nz(pvi )
Description:
PVI increases when volume rises compared to the previous bar and accounts for price percentage change. The stronger the price movement with increasing volume, the higher the PVI value.
2. NVI (Negative Volume Index)
Formula:
nvi := volume < volume ? nz(nvi ) + (close - close ) / close * sval : nz(nvi )
Description:
NVI tracks price movements during declining volume. If the price rises on low volume, it may indicate a "stealth" trend.
3. Money Flow Index (MFI)
Formula:
100 - 100 / (1 + up / dn)
Description:
An oscillator measuring money flow strength. Values above 80 suggest overbought conditions, while values below 20 indicate oversold conditions.
4. Stochastic Oscillator
Formula:
k = 100 * (close - lowest(low, length)) / (highest(high, length) - lowest(low, length))
Description:
A classic stochastic oscillator showing price position relative to the selected period's range.
5. Bollinger Bands Oscillator
Formula:
(tprice - BB midline) / (upper BB - lower BB) * 100
Description:
Indicates the price position relative to Bollinger Bands in percentage terms.
Key Lines & Histogram
1. Verde (Green Line)
Calculation:
verde = marron + oscp (normalized PVI)
Interpretation:
Higher values indicate stronger bullish momentum. A FUSION🔥 signal appears when the value reaches 750+.
2. Marron (Brown Line)
Calculation:
marron = (RSI + MFI + Bollinger Osc + Stochastic / 3) / 2
Interpretation:
A composite oscillator combining multiple indicators. Higher values suggest overbought conditions.
3. Media (Red Line)
Calculation:
media = EMA of marron with smoothing period
Interpretation:
Acts as a signal line for trend confirmation.
4. Histogram
Calculation:
histo = verde - marron
Colors:
Bright green (>100) – Strong bullish momentum.
Light green (>0) – Moderate bullish momentum.
Orange (<0) – Bearish momentum.
Red (<-100) – Strong bearish momentum.
Signals & Alerts
1. FUSION🔥 (Strong Momentum)
Condition:
verde >= 750
Visualization:
A "FUSION🔥" label appears below the chart.
Alert:
Can be set to trigger notifications when the condition is met.
2. Background Aura
Condition:
verde > 850
Visualization:
The chart background turns teal, indicating extreme momentum.
Usage Recommendations
FUSION🔥 Signal – Can be used as a long entry point when confirmed by other indicators.
Histogram:
1. Green bars – Potential long entry.
2. Red/orange bars – Potential short entry.
3. Media & Marron Crossover – Can serve as an additional trend filter.
4. Suitable for a 5-15 minute time frame
Conclusion
Momentum Fusion v1 is a powerful tool for momentum analysis, combining multiple indicators into a unified system. It is suitable for:
Trend traders (catching strong movements).
Scalpers (identifying short-term impulses).
Swing traders (filtering entry points).
The indicator features customizable settings and visual signals, making it adaptable to various trading styles.
Trend Scanner ProTrend Scanner Pro, Robust Trend Direction and Strength Estimator
Trend Scanner Pro is designed to evaluate the current market trend with maximum robustness, providing both direction and strength based on statistically reliable data.
This indicator builds upon the core logic of a previous script I developed, called Best SMA Finder. While the original script focused on identifying the most profitable SMA length based on backtested trade performance, Trend Scanner Pro takes that foundation further to serve a different purpose: analyzing and quantifying the actual trend state in real time.
It begins by testing hundreds of SMA lengths, from 10 to 1000 periods. Each one is scored using a custom robustness formula that combines profit factor, number of trades, and win rate. Only SMAs with a sufficient number of trades are retained, ensuring statistical validity and avoiding curve fitting.
The SMA with the highest robustness score is selected as the dynamic reference point. The script then calculates how far the price deviates from it using rolling standard deviation, assigning a trend strength score from -5 (strong bearish) to +5 (strong bullish), with 0 as neutral.
Two detection modes are available:
Slope mode, based on SMA slope reversals
Bias mode, based on directional shifts relative to deviation zones
Optional features:
Deviation bands for visual structure
Candle coloring to reflect trend strength
Compact table showing real-time trend status
This tool is intended for traders who want an adaptive, objective, and statistically grounded assessment of market trend conditions.

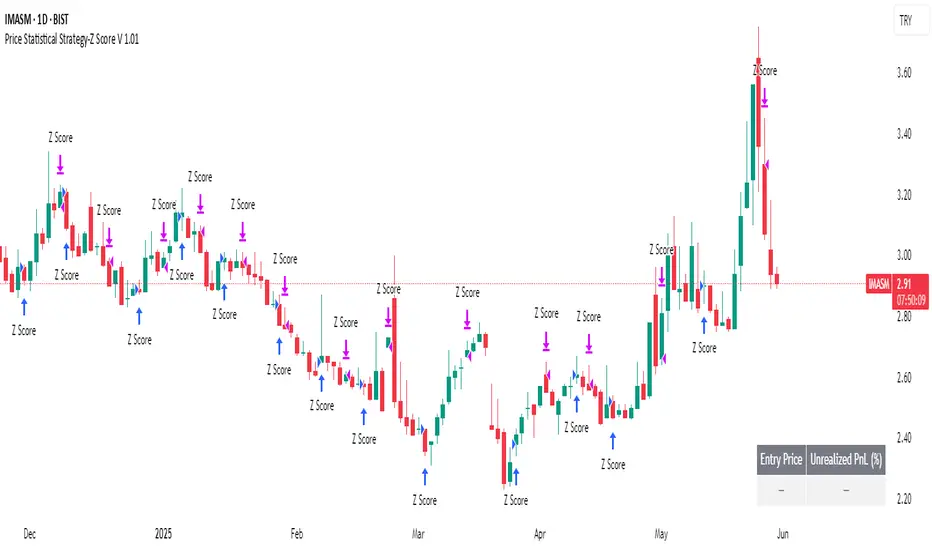
Price Statistical Strategy-Z Score V 1.01
Price Statistical Strategy – Z Score V 1.01
Overview
A technical breakdown of the logic and components of the “Price Statistical Strategy – Z Score V 1.01”.
This script implements a smoothed Z-Score crossover mechanism applied to the closing price to detect potential statistical deviations from local price mean. The strategy operates solely on price data (close) and includes signal spacing control and momentum-based candle filters. No volume-based or trend-detection components are included.
Core Methodology
The strategy is built on the statistical concept of Z-Score, which quantifies how far a value (closing price) is from its recent average, normalized by standard deviation. Two moving averages of the raw Z-Score are calculated: a short-term and a long-term smoothed version. The crossover between them generates long entries and exits.
Signal Conditions
Entry Condition:
A long position is opened when the short-term smoothed Z-Score crosses above the long-term smoothed Z-Score, and additional entry conditions are met.
Exit Condition:
The position is closed when the short-term Z-Score crosses below the long-term Z-Score, provided the exit conditions allow.
Signal Gapping:
A minimum number of bars (Bars gap between identical signals) must pass between repeated entry or exit signals to reduce noise.
Momentum Filter:
Entries are prevented during sequences of three or more consecutively bullish candles, and exits are prevented during three or more consecutively bearish candles.
Z-Score Function
The Z-Score is calculated as:
Z = (Close - SMA(Close, N)) / STDEV(Close, N)
Where N is the base period selected by the user.
Input Parameters
Enable Smoothed Z-Score Strategy
Enables or disables the Z-Score strategy logic. When disabled, no trades are executed.
Z-Score Base Period
Defines the number of bars used to calculate the simple moving average and standard deviation for the Z-Score. This value affects how responsive the raw Z-Score is to price changes.
Short-Term Smoothing
Sets the smoothing window for the short-term Z-Score. Higher values produce smoother short-term signals, reducing sensitivity to short-term volatility.
Long-Term Smoothing
Sets the smoothing window for the long-term Z-Score, which acts as the reference line in the crossover logic.
Bars gap between identical signals
Minimum number of bars that must pass before another signal of the same type (entry or exit) is allowed. This helps reduce redundant or overly frequent signals.
Trade Visualization Table
A table positioned at the bottom-right displays live PnL for open trades:
Entry Price
Unrealized PnL %
Text colors adapt based on whether unrealized profit is positive, negative, or neutral.
Technical Notes
This strategy uses only close prices — no trend indicators or volume components are applied.
All calculations are based on simple moving averages and standard deviation over user-defined windows.
Designed as a minimal, isolated Z-Score engine without confirmation filters or multi-factor triggers.
ZigZag ProZigZag Pro is a precise market structure indicator that automatically detects two independent ZigZag patterns and highlights breakouts whenever significant highs or lows are breached.
The indicator calculates two separate ZigZag structures in real time. ZigZag1 captures the broader market swings and is ideal for trend or swing trading. ZigZag2 is optional and reacts more quickly – perfect for intraday or scalping setups. Both layers are fully customizable in terms of depth, color, and line width.
What makes this tool especially useful: whenever a previous swing high (for long trades) or swing low (for short trades) is broken, the indicator draws a horizontal breakout line on the chart. This makes it easy to spot structural breakouts and take advantage of potential momentum moves.
ZigZag Pro is designed for traders who rely on clean, rule-based market structure — whether you're trading classic breakouts, smart money concepts, or simply want a clearer view of trend shifts. The visuals are minimal, responsive, and suitable for any timeframe.