Recession Warning Model [BackQuant]Recession Warning Model
Overview
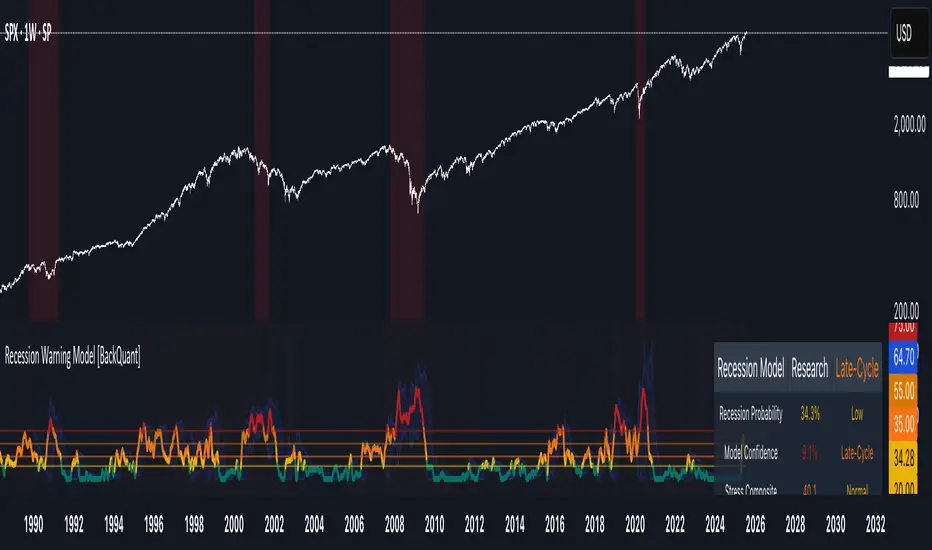
The Recession Warning Model (RWM) is a Pine Script® indicator designed to estimate the probability of an economic recession by integrating multiple macroeconomic, market sentiment, and labor market indicators. It combines over a dozen data series into a transparent, adaptive, and actionable tool for traders, portfolio managers, and researchers. The model provides customizable complexity levels, display modes, and data processing options to accommodate various analytical requirements while ensuring robustness through dynamic weighting and regime-aware adjustments.
Purpose
The RWM fulfills the need for a concise yet comprehensive tool to monitor recession risk. Unlike approaches relying on a single metric, such as yield-curve inversion, or extensive economic reports, it consolidates multiple data sources into a single probability output. The model identifies active indicators, their confidence levels, and the current economic regime, enabling users to anticipate downturns and adjust strategies accordingly.
Core Features
- Indicator Families : Incorporates 13 indicators across five categories: Yield, Labor, Sentiment, Production, and Financial Stress.
- Dynamic Weighting : Adjusts indicator weights based on recent predictive accuracy, constrained within user-defined boundaries.
- Leading and Coincident Split : Separates early-warning (leading) and confirmatory (coincident) signals, with adjustable weighting (default 60/40 mix).
- Economic Regime Sensitivity : Modulates output sensitivity based on market conditions (Expansion, Late-Cycle, Stress, Crisis), using a composite of VIX, yield-curve, financial conditions, and credit spreads.
- Display Options : Supports four modes—Probability (0-100%), Binary (four risk bins), Lead/Coincident, and Ensemble (blended probability).
- Confidence Intervals : Reflects model stability, widening during high volatility or conflicting signals.
- Alerts : Configurable thresholds (Watch, Caution, Warning, Alert) with persistence filters to minimize false signals.
- Data Export : Enables CSV output for probabilities, signals, and regimes, facilitating external analysis in Python or R.
Model Complexity Levels
Users can select from four tiers to balance simplicity and depth:
1. Essential : Focuses on three core indicators—yield-curve spread, jobless claims, and unemployment change—for minimalistic monitoring.
2. Standard : Expands to nine indicators, adding consumer confidence, PMI, VIX, S&P 500 trend, money supply vs. GDP, and the Sahm Rule.
3. Professional : Includes all 13 indicators, incorporating financial conditions, credit spreads, JOLTS vacancies, and wage growth.
4. Research : Unlocks all indicators plus experimental settings for advanced users.
Key Indicators
Below is a summary of the 13 indicators, their data sources, and economic significance:
- Yield-Curve Spread : Difference between 10-year and 3-month Treasury yields. Negative spreads signal banking sector stress.
- Jobless Claims : Four-week moving average of unemployment claims. Sustained increases indicate rising layoffs.
- Unemployment Change : Three-month change in unemployment rate. Sharp rises often precede recessions.
- Sahm Rule : Triggers when unemployment rises 0.5% above its 12-month low, a reliable recession indicator.
- Consumer Confidence : University of Michigan survey. Declines reflect household pessimism, impacting spending.
- PMI : Purchasing Managers’ Index. Values below 50 indicate manufacturing contraction.
- VIX : CBOE Volatility Index. Elevated levels suggest market anticipation of economic distress.
- S&P 500 Growth : Weekly moving average trend. Declines reduce wealth effects, curbing consumption.
- M2 + GDP Trend : Monitors money supply and real GDP. Simultaneous declines signal credit contraction.
- NFCI : Chicago Fed’s National Financial Conditions Index. Positive values indicate tighter conditions.
- Credit Spreads : Proxy for corporate bond spreads using 10-year vs. 2-year Treasury yields. Widening spreads reflect stress.
- JOLTS Vacancies : Job openings data. Significant drops precede hiring slowdowns.
- Wage Growth : Year-over-year change in average hourly earnings. Late-cycle spikes often signal economic overheating.
Data Processing
- Rate of Change (ROC) : Optionally applied to capture momentum in data series (default: 21-bar period).
- Z-Score Normalization : Standardizes indicators to a common scale (default: 252-bar lookback).
- Smoothing : Applies a short moving average to final signals (default: 5-bar period) to reduce noise.
- Binary Signals : Generated for each indicator (e.g., yield-curve inverted or PMI below 50) based on thresholds or Z-score deviations.
Probability Calculation
1. Each indicator’s binary signal is weighted according to user settings or dynamic performance.
2. Weights are normalized to sum to 100% across active indicators.
3. Leading and coincident signals are aggregated separately (if split mode is enabled) and combined using the specified mix.
4. The probability is adjusted by a regime multiplier, amplifying risk during Stress or Crisis regimes.
5. Optional smoothing ensures stable outputs.
Display and Visualization
- Probability Mode : Plots a continuous 0-100% recession probability with color gradients and confidence bands.
- Binary Mode : Categorizes risk into four levels (Minimal, Watch, Caution, Alert) for simplified dashboards.
- Lead/Coincident Mode : Displays leading and coincident probabilities separately to track signal divergence.
- Ensemble Mode : Averages traditional and split probabilities for a balanced view.
- Regime Background : Color-coded overlays (green for Expansion, orange for Late-Cycle, amber for Stress, red for Crisis).
- Analytics Table : Optional dashboard showing probability, confidence, regime, and top indicator statuses.
Practical Applications
- Asset Allocation : Adjust equity or bond exposures based on sustained probability increases.
- Risk Management : Hedge portfolios with VIX futures or options during regime shifts to Stress or Crisis.
- Sector Rotation : Shift toward defensive sectors when coincident signals rise above 50%.
- Trading Filters : Disable short-term strategies during high-risk regimes.
- Event Timing : Scale positions ahead of high-impact data releases when probability and VIX are elevated.
Configuration Guidelines
- Enable ROC and Z-score for consistent indicator comparison unless raw data is preferred.
- Use dynamic weighting with at least one economic cycle of data for optimal performance.
- Monitor stress composite scores above 80 alongside probabilities above 70 for critical risk signals.
- Adjust adaptation speed (default: 0.1) to 0.2 during Crisis regimes for faster indicator prioritization.
- Combine RWM with complementary tools (e.g., liquidity metrics) for intraday or short-term trading.
Limitations
- Macro indicators lag intraday market moves, making RWM better suited for strategic rather than tactical trading.
- Historical data availability may constrain dynamic weighting on shorter timeframes.
- Model accuracy depends on the quality and timeliness of economic data feeds.
Final Note
The Recession Warning Model provides a disciplined framework for monitoring economic downturn risks. By integrating diverse indicators with transparent weighting and regime-aware adjustments, it empowers users to make informed decisions in portfolio management, risk hedging, or macroeconomic research. Regular review of model outputs alongside market-specific tools ensures its effective application across varying market conditions.
US
London ORB + Session High/Low + FVGLondon ORB + Session High/Low + FVG
📘 Script Description: London ORB + Session High/Low + Fair Value Gap
This script is designed to assist intraday traders during the London session open by combining:
🕒 1. Opening Range Breakout (ORB)
Captures the high and low of the first 15-minute candle after the London open (08:00–08:15 GMT).
Draws lines and labels for the ORB High and Low levels.
Detects breakouts above or below the ORB and plots a triangle signal at the breakout bar.
🌐 2. Asian & US Session Levels
Automatically marks the highs and lows of the Asian (00:00–06:00 GMT) and US (13:30–20:00 GMT) sessions.
Useful for identifying prior session liquidity zones, key support/resistance levels, and potential reaction areas.
📉 3. Fair Value Gaps (FVG)
Highlights imbalances in price action between non-overlapping candles (also known as FVGs or inefficiencies).
Draws a shaded box between candles where gaps exist:
Green for bullish FVGs
Red for bearish FVGs
🔔 4. Alert Support
Optional alerts are built in for:
Long breakout (price breaks above ORB)
Short breakout (price breaks below ORB)
🎯 Use Case
Perfect for:
Day traders looking to capitalize on early volatility at the London open
Traders using liquidity-based strategies, retests, or gap-fills
Visualizing and aligning with prior session highs/lows for structure and context

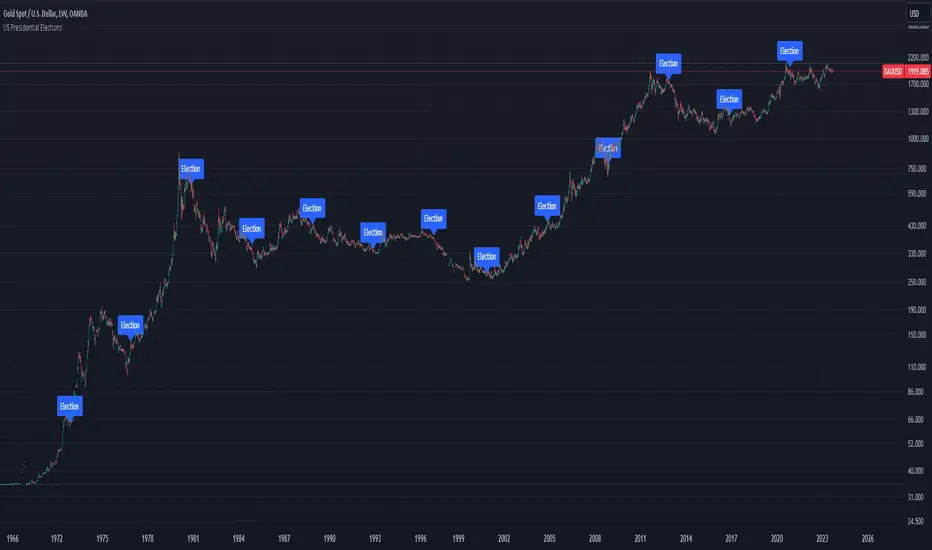
INTELLECT_city - US Presidential Elections Dates (USA)(EN)
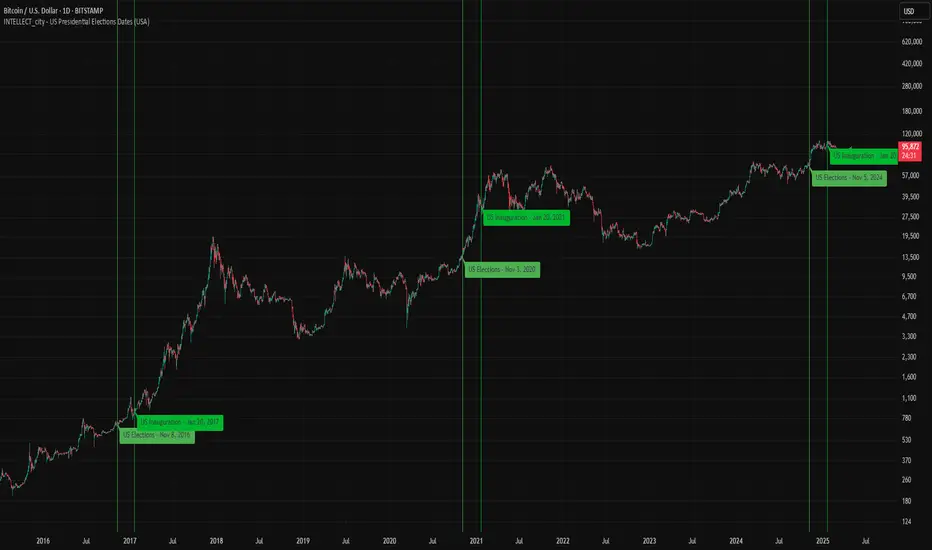
It is interesting to compare Halvings Cycles and Presidential elections.
This indicator shows all presidential elections in the USA from the period 2008, and future ones to the date 2044. The indicator will automatically show all future dates of presidential elections.
--
To apply it to your chart it is very easy:
Select:
1) Exchange: BITSTAMP
2) Pair BTC \ USD (Without "T" at the end)
3) Timeframe 1 day
4) In the Browser, switch the chart to Logarithmic (on the right bottom, click the "L" button)
or on mobile, switch to "Logarithmic" we look on the chart: "Gear" - and switch to "Logarithmic"
------------------
(RU)
Интересно сопоставить Циклы Halvings и Президентские выборы.
Данный индикатор показывает все президентские выборы в США с периода 2008 года, и будущие к дате 2044 года. Индикатор будет автоматически показывать все будущие даты .
--
Что бы применить у себя на графике это очень легко:
Выберите:
1) Биржа: BITSTAMP
2) Пара BTC \ USD (Без "T" в конце)
3) Timeframe 1 дневной
4) В Браузере переключить график на Логарифмический (с право внизу кнопка "Л")
или на мобильно переключить на "Логарифмический" ищем на графике: "Шестеренку" — и переключаем на "Логарифмический"
-------------------
(DE)
Es ist interessant, die Halbierungszyklen und die Präsidentschaftswahlen zu vergleichen.
Dieser Indikator zeigt alle US-Präsidentschaftswahlen seit 2008 und zukünftige bis zum Datum 2044. Der Indikator zeigt automatisch alle zukünftigen Präsidentschaftswahltermine an.
--
Es ist sehr einfach, dies auf Ihr Diagramm anzuwenden:
Wählen:
1) Austausch: BITSTAMP
2) Paar BTC \ USD (Ohne das „T“ am Ende)
3) Zeitrahmen 1 Tag
4) Schalten Sie im Browser das Diagramm auf Logarithmisch um (die Schaltfläche „L“ unten rechts).
oder auf dem Mobilgerät auf „Logarithmisch“ umschalten, in der Grafik nach „Getriebe“ suchen – und auf „Logarithmisch“ umschalten
Overnight Positioning w EMA - Strategy [presentTrading]I've recently started researching Market Timing strategies, and it’s proving to be quite an interesting area of study. The idea of predicting optimal times to enter and exit the market, based on historical data and various indicators, brings a dynamic edge to trading. Additionally, it is integrated with the 3commas bot for automated trade execution.
I'm still working on it. Welcome to share your point of view.
█ Introduction and How it is Different
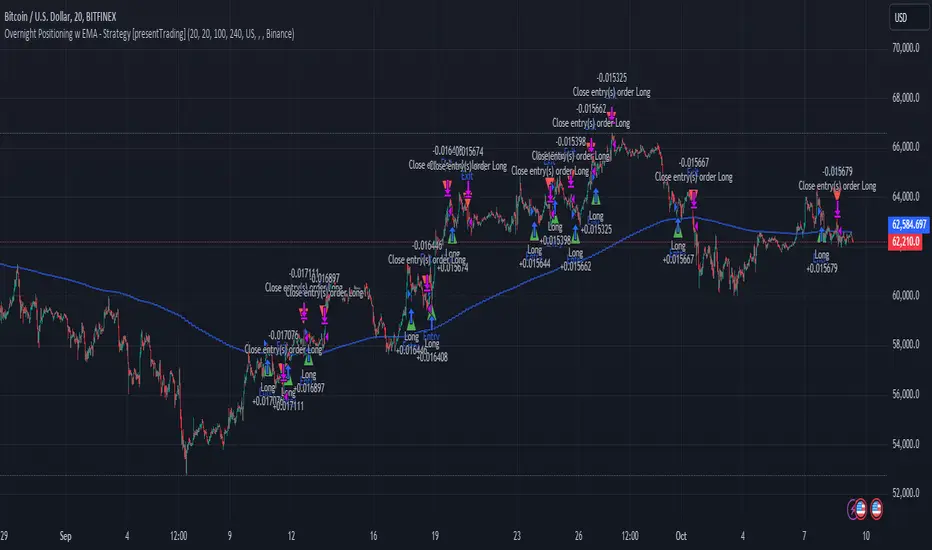
The "Overnight Positioning with EMA " is designed to capitalize on market inefficiencies during the overnight trading period. This strategy takes a position shortly before the market closes and exits shortly after it opens the following day. What sets this strategy apart is the integration of an optional Exponential Moving Average (EMA) filter, which ensures that trades are aligned with the underlying trend. The strategy provides flexibility by allowing users to select between different global market sessions, such as the US, Asia, and Europe.
It is integrated with the 3commas bot for automated trade execution and has a built-in mechanism to avoid holding positions over the weekend by force-closing positions on Fridays before the market closes.
BTCUSD 20 mins Performance
█ Strategy, How it Works: Detailed Explanation
The core logic of this strategy is simple: enter trades before market close and exit them after market open, taking advantage of potential price movements during the overnight period. Here’s how it works in more detail:
🔶 Market Timing
The strategy determines the local market open and close times based on the selected market (US, Asia, Europe) and adjusts entry and exit points accordingly. The entry is triggered a specific number of minutes before market close, and the exit is triggered a specific number of minutes after market open.
🔶 EMA Filter
The strategy includes an optional EMA filter to help ensure that trades are taken in the direction of the prevailing trend. The EMA is calculated over a user-defined timeframe and length. The entry is only allowed if the closing price is above the EMA (for long positions), which helps to filter out trades that might go against the trend.
The EMA formula:
```
EMA(t) = +
```
Where:
- EMA(t) is the current EMA value
- Close(t) is the current closing price
- n is the length of the EMA
- EMA(t-1) is the previous period's EMA value
🔶 Entry Logic
The strategy monitors the market time in the selected timezone. Once the current time reaches the defined entry period (e.g., 20 minutes before market close), and the EMA condition is satisfied, a long position is entered.
- Entry time calculation:
```
entryTime = marketCloseTime - entryMinutesBeforeClose * 60 * 1000
```
🔶 Exit Logic
Exits are triggered based on a specified time after the market opens. The strategy checks if the current time is within the defined exit period (e.g., 20 minutes after market open) and closes any open long positions.
- Exit time calculation:
exitTime = marketOpenTime + exitMinutesAfterOpen * 60 * 1000
🔶 Force Close on Fridays
To avoid the risk of holding positions over the weekend, the strategy force-closes any open positions 5 minutes before the market close on Fridays.
- Force close logic:
isFriday = (dayofweek(currentTime, marketTimezone) == dayofweek.friday)
█ Trade Direction
This strategy is designed exclusively for long trades. It enters a long position before market close and exits the position after market open. There is no shorting involved in this strategy, and it focuses on capturing upward momentum during the overnight session.
█ Usage
This strategy is suitable for traders who want to take advantage of price movements that occur during the overnight period without holding positions for extended periods. It automates entry and exit times, ensuring that trades are placed at the appropriate times based on the market session selected by the user. The 3commas bot integration also allows for automated execution, making it ideal for traders who wish to set it and forget it. The strategy is flexible enough to work across various global markets, depending on the trader's preference.
█ Default Settings
1. entryMinutesBeforeClose (Default = 20 minutes):
This setting determines how many minutes before the market close the strategy will enter a long position. A shorter duration could mean missing out on potential movements, while a longer duration could expose the position to greater price fluctuations before the market closes.
2. exitMinutesAfterOpen (Default = 20 minutes):
This setting controls how many minutes after the market opens the position will be exited. A shorter exit time minimizes exposure to market volatility at the open, while a longer exit time could capture more of the overnight price movement.
3. emaLength (Default = 100):
The length of the EMA affects how the strategy filters trades. A shorter EMA (e.g., 50) reacts more quickly to price changes, allowing more frequent entries, while a longer EMA (e.g., 200) smooths out price action and only allows entries when there is a stronger underlying trend.
The effect of using a longer EMA (e.g., 200) would be:
```
EMA(t) = +
```
4. emaTimeframe (Default = 240):
This is the timeframe used for calculating the EMA. A higher timeframe (e.g., 360) would base entries on longer-term trends, while a shorter timeframe (e.g., 60) would respond more quickly to price movements, potentially allowing more frequent trades.
5. useEMA (Default = true):
This toggle enables or disables the EMA filter. When enabled, trades are only taken when the price is above the EMA. Disabling the EMA allows the strategy to enter trades without any trend validation, which could increase the number of trades but also increase risk.
6. Market Selection (Default = US):
This setting determines which global market's open and close times the strategy will use. The selection of the market affects the timing of entries and exits and should be chosen based on the user's preference or geographic focus.
US Presidential Elections (Names & Dates)US Presidential Elections (Names & Dates)
Description :
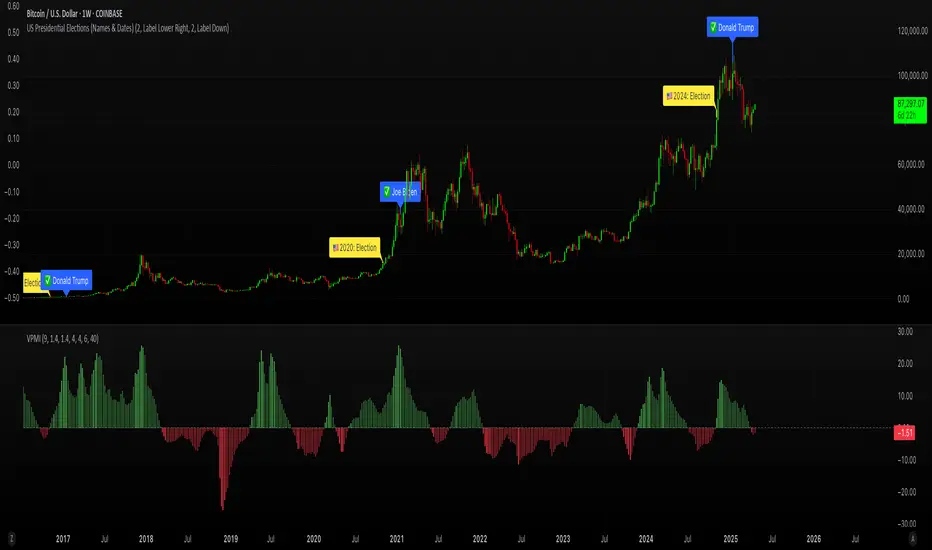
This indicator marks key dates in US presidential history, highlighting both election days and inauguration dates. It's designed to provide historical context to your charts, allowing you to see how major political events align with market movements.
Key Features:
• Displays US presidential elections from 1936 to 2052
• Shows inauguration dates for each president
• Customizable colors and styles for both election and inauguration markers
• Toggle visibility of election and inauguration labels separately
• Adapts to different timeframes (daily, weekly, monthly)
• Includes president names for historical context
The indicator uses yellow labels for election days and blue labels for inauguration dates. Election labels show the year and "Election", while inauguration labels display the name of the incoming president.
Customization options include:
• Colors for election and inauguration labels and text
• Line widths for both types of events
• Label placement styles
This tool is perfect for traders and analysts who want to correlate political events with market trends over long periods. It provides a unique perspective on how presidential cycles might influence financial markets.
Note: Future elections (2024 onwards) are marked with a placeholder (✅) as the presidents are not yet known.
Use this indicator to:
• Identify potential market patterns around election cycles
• Analyze historical market reactions to specific presidencies
• Add political context to your long-term chart analysis
Enhance your chart analysis with this comprehensive view of US presidential history!
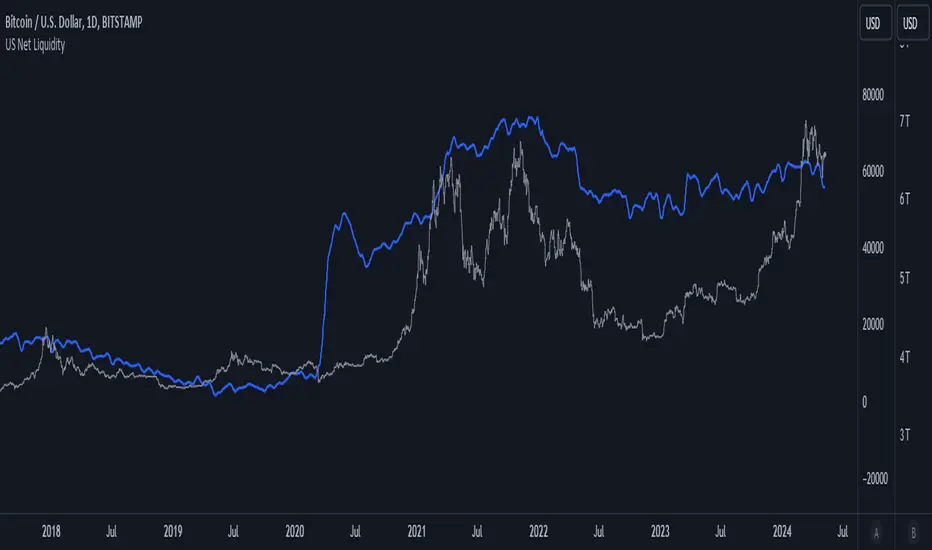
US Net LiquidityAnalysis of US Net Liquidity: A Comprehensive Overview
Introduction:
The "US Net Liquidity" indicator offers a detailed analysis of liquidity conditions within the United States, drawing insights from critical financial metrics related to the Federal Reserve (FED) and other government accounts. This tool enables economists to assess liquidity dynamics, identify trends, and inform economic decision-making.
Key Metrics and Interpretation:
1. Smoothing Period: This parameter adjusts the level of detail in the analysis by applying a moving average to the liquidity data. A longer smoothing period results in a smoother trend line, useful for identifying broader liquidity patterns over time.
2. Data Source (Timeframe): Specifies the timeframe of the data used for analysis, typically daily (D). Different timeframes can provide varying perspectives on liquidity trends.
3. Data Categories:
- FED Balance Sheet: Represents the assets and liabilities of the Federal Reserve, offering insights into monetary policy and market interventions.
- US Treasury General Account (TGA): Tracks the balance of the US Treasury's general account, reflecting government cash management and financial stability.
- Overnight Reverse Repurchase Agreements (RRP): Highlights short-term borrowing and lending operations between financial institutions and the Federal Reserve, influencing liquidity conditions.
- Earnings Remittances to the Treasury: Indicates revenues transferred to the US Treasury from various sources, impacting government cash flow and liquidity.
4. Moving Average Length: Determines the duration of the moving average applied to the data. A longer moving average length smoothens out short-term fluctuations, emphasizing longer-term liquidity trends.
Variation Lookback Length: Specifies the historical period used to assess changes and variations in liquidity. A longer lookback length captures more extended trends and fluctuations.
Interpretation:
1. Data Retrieval: Real-time data from specified financial instruments (assets) is retrieved to calculate balances for each category (FED, TGA, RRP, Earnings Remittances).
2. Global Balance Calculation: The global liquidity balance is computed by aggregating the balances of individual categories (FED Balance - TGA Balance - RRP Balance - Earnings Remittances Balance). This metric provides a comprehensive view of net liquidity.
3. Smoothed Global Balance (SMA): The Simple Moving Average (SMA) is applied to the global liquidity balance to enhance clarity and identify underlying trends. A rising SMA suggests improving liquidity conditions, while a declining SMA may indicate tightening liquidity.
Insight Generation and Decision-Making:
1. Trend Analysis: By analyzing smoothed liquidity trends over time, economists can identify periods of liquidity surplus or deficit, which can inform monetary policy decisions and market interventions.
2. Forecasting: Understanding liquidity dynamics aids in economic forecasting, particularly in predicting market liquidity, interest rate movements, and financial stability.
3. Policy Implications: Insights derived from this analysis tool can guide policymakers in formulating effective monetary policies, managing government cash flow, and ensuring financial stability.
Conclusion:
The "US Net Liquidity" analysis tool serves as a valuable resource for economists, offering a data-driven approach to understanding liquidity dynamics within the US economy. By interpreting key metrics and trends, economists can make informed decisions and contribute to macroeconomic stability and growth.
Disclaimer: This analysis is based on real-time financial data and should be used for informational purposes only. It is not intended as financial advice or a substitute for professional expertise.
US Presidential ElectionsThis script can be useful in case of analyzing the impact of US presidential election on the past market.
It has separated settings for showing Inauguration and Election labels.
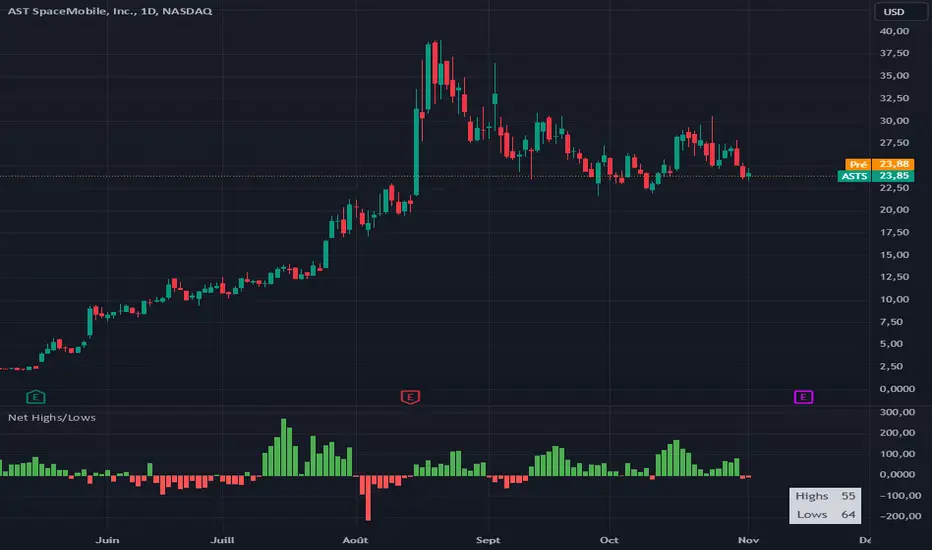
Net New Highs/Lows (With visible code)Basically the same script than Carusolnsights but without hidding the lines of code...
"This indicator displays the net number of stocks on the Nasdaq Composite making 52-week highs or lows. For instance, if there are 60 new 52-week highs and 20 new 52-week lows, the net number will display 40 net new 52 week highs. This indicator is particularty useful in gauging what the breadth is of the Nasdaq.
Three days of net 52-week highs show a healthy market which is conducive to increasing exposure. This condition is highlighted with a green background.
Three days of net 52-week lows show an unhealthy market which is conducive to reducing exposure. This condition is high|lighted with a red background."
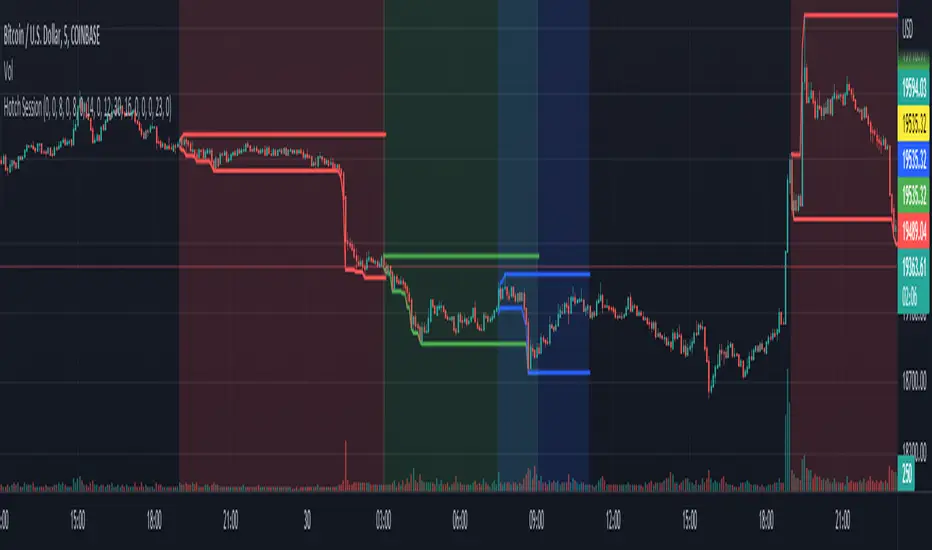
Hotch SessionSimple Session timer with separate session for Asia, Europe, and the Americas plus an extra custom session timer. each can be turned on and off separately.
The indicator also plots the highs and lows of each session.
This code was modified from the Session timer code found in the original "The Arty" by PheonixBinary but expanded to better include all trading sessions.
The code was written in a manner to be as compact as possible. I had looked at many other Session timers and found entire input sections that were longer than the entirety of this indicator.
Please feel free to use this code in any manner you choose permission not required.
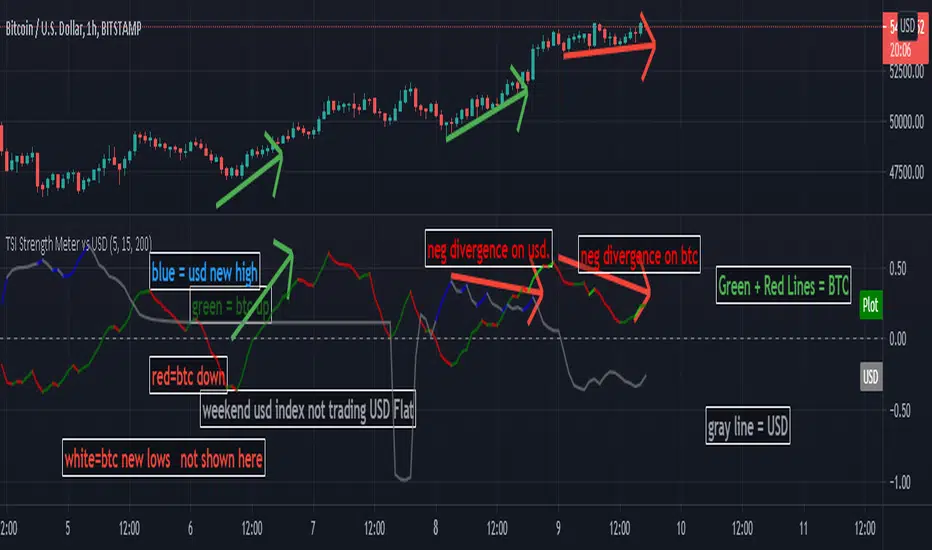
TSI Strength Meter vs USD with divergenceThis indicator consists of two lines. One is a gray line (USD) and the asset indicator is green or red.
The basis of this indicator is the true strength indicator (TSI) with parameters 5,15. Both line sets are based on a TSI (5,15).
The lookback period is for new highs / new lows. Default value is 200 periods.
GREEN/RED LINE
The first that is green and red is whatever you choose to display ( BTC in this case).
The green and red lines indicate going up or going down.
GRAY LINE
The gray line is the US Dollar . So everything is relative to that by default.
ZERO LINE CROSSES
These are momentum shifts. If you see a crossover of both around the zero line, its a good indication there is a change in momentum and a reversal of trend.
NEW HIGHS NEW LOWS
There are 4 new colors added to this indicator. For the asset you are viewing, a lime color means new highs within the lookback period. A new low is indicated by a yellow line color.
The new lows for the USD are white for new lows within the lookback period and blue line for the new highs.
DIVERGENCE
You can also spot divergences easily. For example, if a lime color is seen on the indicator line, that means "new high" but if it occurs below the last "new high" it means the asset is going up to new highs but the indicator is showing us that the readings are below the previous new highs, indicating a negative divergence.
The same goes for the yellow colored lines. higher yellows mean positive divergence.
And with the US Dollar , blue lines dropping means a negative divergence in the US Dollar , while white lines moving up means a positive dollar divergence.
INTERPRETATION
Examples:
If you see a green and sometimes red line of the asset indicator and a gray line that drops below the zero line; it may mean the asset is rising and the trend is up.
If you see a green and red line below the zero line and with a gray line above the zero line , it indicates there is a negative trend. If you suddenly see blue lines on the USD, this means its hitting new lows. If these blue lines then start to slowly move downwards; then we have a positive divergence. If that were to be followed by the green line crossing the zero line, its a pretty good be that the trend is changing and its a very good buying oportunity.
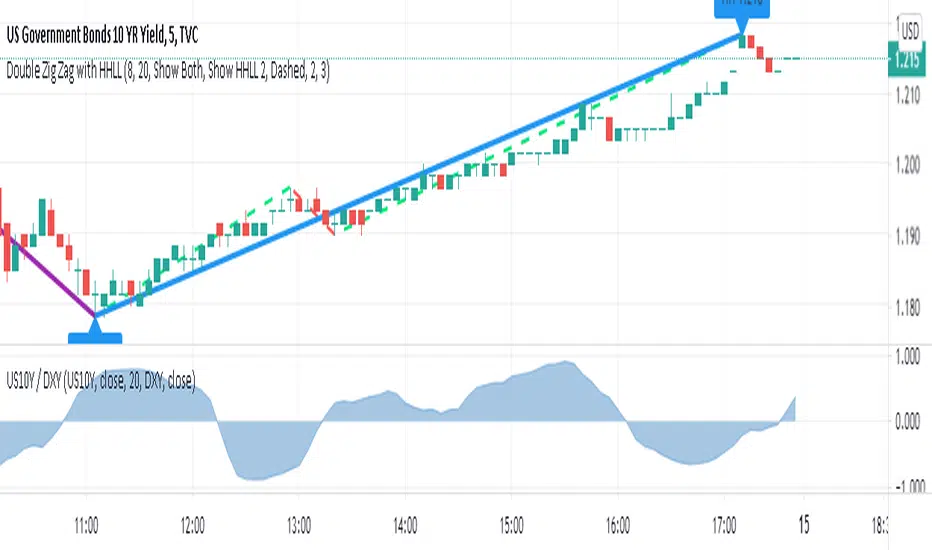
US10Y / DXY - 10 Yield correlated This oscillator tracks the US and US10Y , Script is based in SPX/US oscillator by @someguy
Presidential 2020 Candidate and Undecided Voter Poll StatsThis is just a simple indicator to show the election poll stats and include the value for undecided voters.

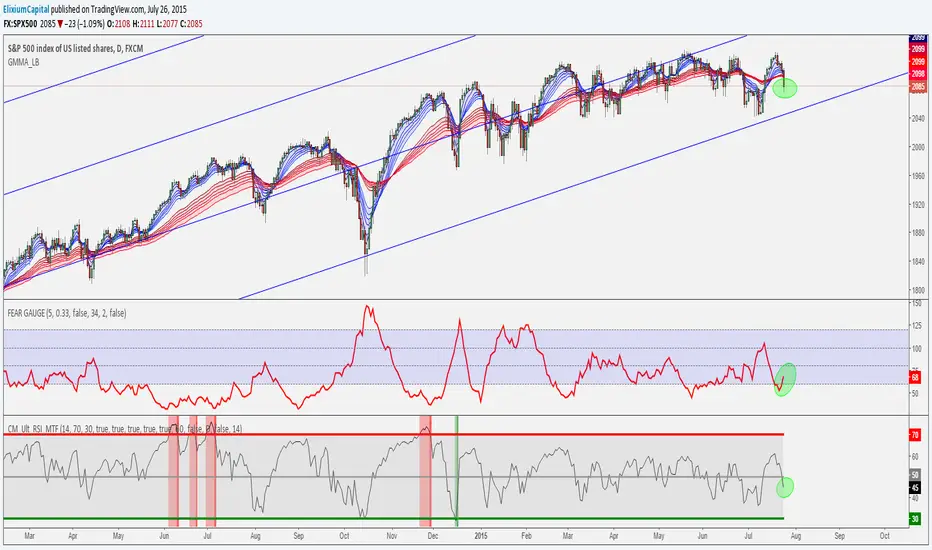
ATR Pips [LazyBear] [Elixium Mod: FEAR GAUGE]Modified version of ATR Pips
The indicator's value is a third of the daily range which is good to use as a stop loss value for intra day scalping on markets such as index futures and forex.
It's good for detecting and confirming inflection points in the market.
Pip Foundry - Simple OBVMy premium indicators are available for monthly lease at tradingview.sweetlogin.com
On request from SunnyBTC for trading Forex pairs that do not themselves have any volume indication.
The concept: A simple OBV that will display the volume of a security other than what you are charting.
Edit: This script has been updated.
