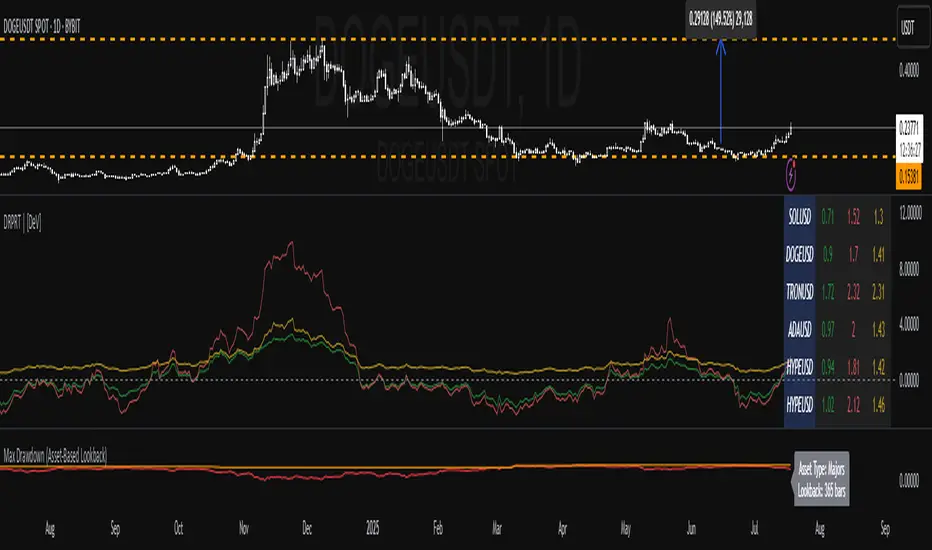
Max Drawdown (Asset-Based Lookback)Max Drawdown (Long-Term Trading)
🟦 Majors BTC, ETH, BNB, LTC 180 – 365
Captures full correction cycles and recovery patterns (6–12 months).
🟩 Altcoins SOL, ADA, DOT, LINK, AVAX 90 – 180
Alts move faster than majors; 3–6 months catches most large swings.
🟥 Meme coins DOGE, SHIB, PEPE, FLOKI 60 – 120
Volatile with quick trend reversals; 2–4 months captures parabolic runs + drawdowns.
📅 Chart Timeframe:
Use Daily (1D) timeframe for all these.
For extra macro insight, try Weekly (1W) with 52 bars (≈ 1 year).
Compare multiple assets using the same period to assess relative risk.
If you're building a long-term portfolio, combine this with:
200-day SMA or EMA for trend context.
Sharpe Ratio or Sortino Ratio if you're looking for risk-adjusted return metrics.
Volatility
Earnings [theUltimator5]This indicator highlights daily price changes on earnings announcement days using dynamic colors, labels, and optional earnings markers.
🔍 Key Features:
Earnings Detection:
Highlights only the days when an earnings event occurs.
Price Change Calculation:
Computes the percentage change from open to close on earnings day.
Color-coded Labels:
Displays the % change as a floating label above the chart on earnings days.
Color intensity reflects the size and direction of the move:
Bright green for large gains (≥ +10%)
Bright red for large losses (≤ -10%)
White for negligible change
Gradient fades between those extremes
Optional "Earnings" Marker:
A small label marked “Earnings” appears beneath the % change label, controlled by a user toggle.
Background Highlight:
The chart background is shaded on earnings days with a semi-transparent color based on the % change.
⚙️ User Input:
✅ Show 'E' Marker: Toggles the visibility of the "Earnings" label below the main price change label.
✅ Ideal Use Case:
Use this indicator to visually analyze how a stock reacts on earnings days, helping traders spot consistent behavior patterns (e.g., post-earnings rallies or selloffs).

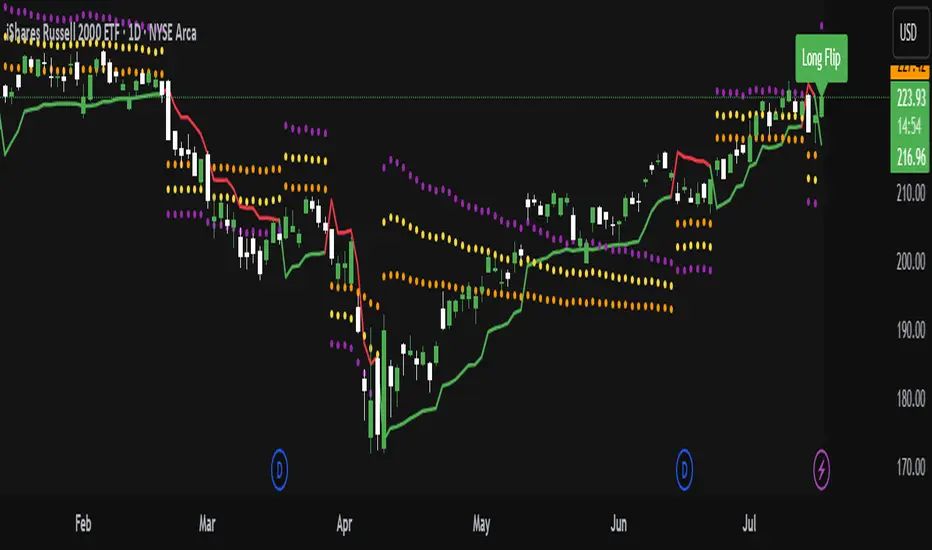
ATR Trailing Stop with ATR Targets [v6]What the Indicator Does
This custom TradingView indicator is designed for active traders who want to automate and visualize their trailing stop management and target setting, using true market volatility. It combines the Average True Range (ATR) with dynamic market structure logic to:
Trail a stop-loss behind major swings in real time, using 2×ATR (adjustable) from the highest high in uptrends or the lowest low in downtrends.
Flip trading bias between bullish and bearish when the stop is breached.
Identify and plot three profit targets (at 1, 2, and 3 ATR from the breakout/flip point) after every stop-flip, helping traders scale out or set take-profits objectively.
Maintain a visible presence on your chart every bar to avoid indicator errors, with color and labeling for clear distinction between long/short phases.
How the Indicator Works
1. ATR Calculation
ATR Period and Multiplier: You select your preferred ATR length (default is 14 bars) and a multiplier (default is 2.0).
Volatility Adjustment: ATR measures the average "true" bar range, so the trailing stop and targets adapt to current volatility.
2. Trailing Stop Logic
Uptrend (bullish bias): The indicator tracks the highest high made since the last bearish-to-bullish flip and sets the stop at - .
The stop only raises (never lowers) during an uptrend, protecting gains in strong moves.
Downtrend (bearish bias): Tracks the lowest low made since the last bullish-to-bearish flip, with stop at + .
The stop only lowers (never raises) in a downtrend.
Flip Point: If price closes through the trailing stop, the current bias “flips,” and the logic reverses (bullish to bearish or vice versa). At the new close, flip price and bar index are stored for target calculation.
3. ATR Targets after Flip
After each stop flip:
Three targets—based on the new close price—are calculated and plotted:
Long flip (new bull bias): Target1 = close + 1×ATR, Target2 = close + 2×ATR, Target3 = close + 3×ATR.
Short flip (new bear bias): Target1 = close - 1×ATR, Target2 = close - 2×ATR, Target3 = close - 3×ATR.
These targets help with scaling out, partial profit-taking, or setting automated orders.
4. Visual Feedback
Trailing stop line: Green for long bias, red for short bias.
Targets: Distinct color-coded circles at 1, 2, 3 ATR levels from the most recent flip.
Flip Labels: Mark the bar and price where bias flipped (“Long Flip” or “Short Flip”) for quick pattern recognition.
Subtle background shading: Ensures TradingView's requirement for “indicator output every bar.”
How to Use This Indicator
Parameter Setup
ATR Period and Multiplier: Adjust to match the timeframe and volatility of your instrument.
Lower periods/multipliers for short-term/volatile trading.
Higher values for smoother signals or higher timeframes.
Starting Trend: Set to match the expected initial bias if the instrument has strong trend characteristics.
Trading Application
1. Daily Bias Approach
Establish your bias in line with your trading plan (e.g., only trade long if price is above the previous day's high, short below the previous day's low).
Only look for trades in the indicator's current bias direction, as expressed by the stop and background color.
2. Entry
Use the indicator as a real-time confirmation or trailing stop for your entries.
Breakout: Enter when price establishes the current bias, using the trailing stop as your risk level.
Reversal: Wait for a bias flip after an extended move; enter in the direction of the new bias.
VWAP Rebound: Combine with a VWAP bounce—enter only if the indicator bias supports your direction.
3. Exits/Targets
Trailing stop management: Move your stop according to the plotted line; exit if your stop is hit.
Profit-taking: Scale out or take profits as price approaches each ATR-based target.
Use the dynamic labeling to identify reversal flips and reset your plan if stopped or the bias changes.
4. Market Context
Filter and frame setups by watching correlated indicators (DXY, VIX, AUDJPY, put/call ratio) and upcoming news; trade only in the daily bias direction for best consistency.
5. Practical Tips
Combine this indicator with your custom watchlist and alert settings to get notified on flips or targets.
Review the last label ("Long Flip"/"Short Flip") and targets to plan partial exits.
Remember: ATR adapts to volatility, so the stop and targets stay proportionate even when price action shifts.
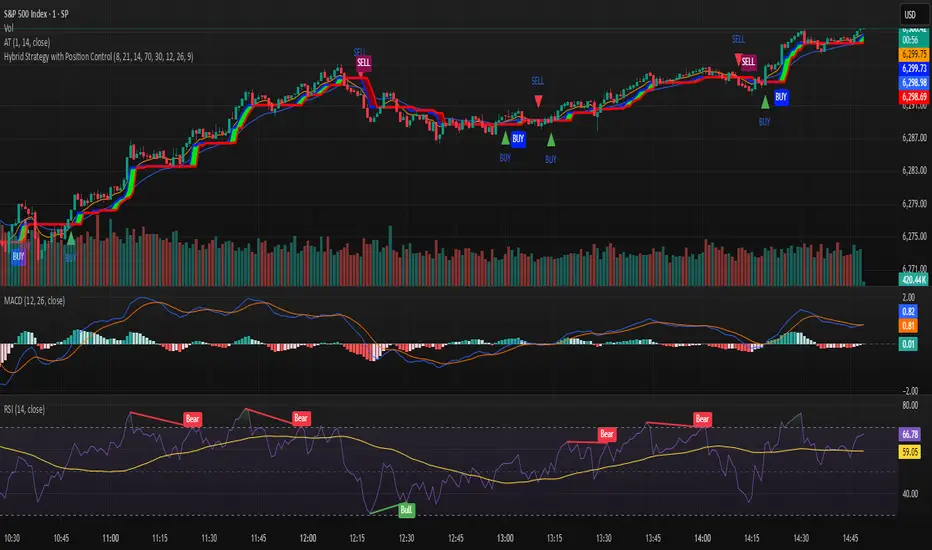
Hybrid Strategy with Position Control//@version=6
indicator('Hybrid Strategy with Position Control', overlay=true)
// === INPUTS ===
emaFastLen = input.int(8, 'Fast EMA')
emaSlowLen = input.int(21, 'Slow EMA')
rsiLen = input.int(14, 'RSI Length')
rsiOverbought = input.int(70, 'RSI Overbought')
rsiOversold = input.int(30, 'RSI Oversold')
macdFast = input.int(12, 'MACD Fast')
macdSlow = input.int(26, 'MACD Slow')
macdSignal = input.int(9, 'MACD Signal')
// === CALCULATIONS ===
emaFast = ta.ema(close, emaFastLen)
emaSlow = ta.ema(close, emaSlowLen)
rsi = ta.rsi(close, rsiLen)
= ta.macd(close, macdFast, macdSlow, macdSignal)
// === POSITION TRACKING ===
var int position = 0 // 0 = no position, 1 = long, -1 = short
// === ENTRY CONDITIONS ===
longCondition = ta.crossover(emaFast, emaSlow) and rsi < rsiOverbought and macdLine > signalLine and position != 1
shortCondition = ta.crossunder(emaFast, emaSlow) and rsi > rsiOversold and macdLine < signalLine and position != -1
// === EXIT CONDITIONS (Optional logic for reset) ===
exitLong = ta.crossunder(emaFast, emaSlow)
exitShort = ta.crossover(emaFast, emaSlow)
// === SIGNAL PLOTS ===
buySignal = longCondition
sellSignal = shortCondition
plotshape(buySignal, title='Buy Signal', location=location.belowbar, color=color.green, style=shape.triangleup, size=size.small, text='BUY')
plotshape(sellSignal, title='Sell Signal', location=location.abovebar, color=color.red, style=shape.triangledown, size=size.small, text='SELL')
// === STATE MANAGEMENT ===
if (longCondition)
position := 1
if (shortCondition)
position := -1
// Reset position if trend reverses
if (exitLong and position == 1)
position := 0
if (exitShort and position == -1)
position := 0
// === PLOT EMAs ===
plot(emaFast, color=color.orange, title='Fast EMA')
plot(emaSlow, color=color.blue, title='Slow EMA')
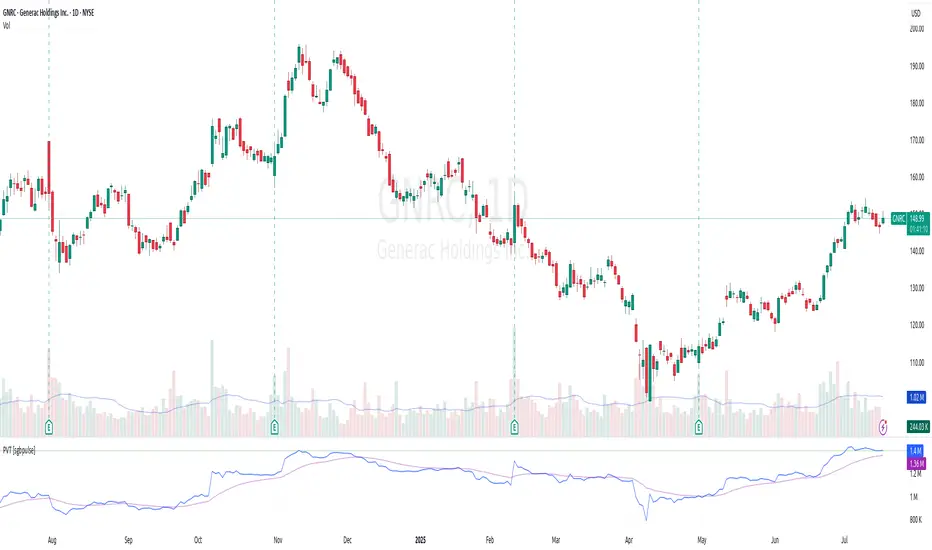
Price Volume Trend [sgbpulse]1. Introduction: What is Price Volume Trend (PVT)?
The Price Volume Trend (PVT) indicator is a powerful technical analysis tool designed to measure buying and selling pressure in the market based on price changes relative to trading volume. Unlike other indicators that focus solely on volume or price, PVT combines both components to provide a more comprehensive picture of trend strength.
How is it Calculated?
The PVT is calculated by adding or subtracting a proportional part of the daily volume from a cumulative total.
When the closing price rises, a proportional part of the daily volume (based on the percentage price change) is added to the previous PVT value.
When the closing price falls, a proportional part of the daily volume is subtracted from the previous PVT value.
If there is no change in price, the PVT value remains unchanged.
The result of this calculation is a cumulative line that rises when buying pressure is strong and falls when selling pressure dominates.
2. Why PVT? Comparison to Similar Indicators
While other indicators measure volume-price pressure, PVT offers a unique advantage:
PVT vs. On-Balance Volume (OBV):
OBV simply adds or subtracts the entire day's volume based on the closing direction (up/down), regardless of the magnitude of the price change. This means a 0.1% price change is treated the same as a 10% change.
PVT, on the other hand, gives proportional weight to volume based on the percentage price change. A trading day with a large price increase and high volume will impact the PVT significantly more than a small price increase with the same volume. This makes PVT more sensitive to trend strength and changes within it.
PVT vs. Accumulation/Distribution Line (A/D Line):
The A/D Line focuses on the relationship between the closing price and the bar's trading range (Close Location Value) and multiplies it by volume. It indicates whether the pressure is buying or selling within a single bar.
PVT focuses on the change between closing prices of consecutive bars, multiplying this by volume. It better reflects the flow of money into or out of an asset over time.
By combining volume with percentage price change, PVT provides deeper insights into trend confirmation, identifying divergences between price and volume, and spotting signs of weakness or strength in the current trend.
3. Indicator Settings (Inputs)
The "Price Volume Trend " indicator offers great flexibility for customization to your specific needs through the following settings:
Moving Average Type: Allows you to select the type of moving average used for the central line on the PVT. Your choice here will affect the line's responsiveness to PVT movements.
- "None" : No moving average will be displayed on the PVT.
- "SMA" (Simple Moving Average): A simple average, smoother, ideal for identifying longer-term trends in PVT.
- "SMA + Bollinger Bands": This unique option not only displays a Simple Moving Average but also activates the Bollinger Bands around the PVT. This is the recommended option for analyzing volatility and ranges using Bollinger Bands.
- "EMA" (Exponential Moving Average): An exponential average, giving more weight to recent data, responding faster to changes in PVT.
- "SMMA (RMA)" (Smoothed Moving Average): A smoothed average, providing extra smoothing, less sensitive to noise.
- "WMA" (Weighted Moving Average): A weighted average, giving progressively more weight to recent data, responding very quickly to changes in PVT.
Moving Average Length: Defines the number of bars used to calculate the moving average (and, if applicable, the standard deviation for the Bollinger Bands). A lower value will make the line more responsive, while a higher value will smooth it out.
PVT BB StdDev (Bollinger Bands Standard Deviation): Determines the width of the Bollinger Bands. A higher value will result in wider bands, making it less likely for the PVT to cross them. The standard value is 2.0.
4. Visual Aid: Current PVT Level Line
This indicator includes a unique and highly useful visual feature: a dynamic horizontal line displayed on the PVT graph.
Purpose: This line marks the exact level of the PVT on the most recent trading bar. It extends across the entire chart, allowing for a quick and intuitive comparison of the current level to past levels.
Why is it Important?
- Identifying Divergences: Often, an asset's price may be lower or higher than past levels, but the PVT level might be different. This auxiliary line makes it easy to spot situations where PVT is at a higher level when the price is lower, or vice-versa, which can signal potential trend changes (e.g., higher PVT than in the past while price is low could indicate strong accumulation).
- Quick Direction Indication: The line's color changes dynamically: it will be green if the PVT value on the last bar has increased (or remained the same) relative to the previous bar (indicating positive buying pressure), and red if the PVT value has decreased relative to the previous bar (indicating selling pressure). This provides an immediate visual cue about the direction of the cumulative momentum.
5. Important Note: Trading Risk
This indicator is intended for educational and informational purposes only and does not constitute investment advice or a recommendation for trading in any form whatsoever.
Trading in financial markets involves significant risk of capital loss. It is important to remember that past performance is not indicative of future results. All trading decisions are your sole responsibility. Never trade with money you cannot afford to lose.
PRO SMC DASHBOARDPRO SMC DASHBOARD - PRO LEVEL
Advanced Supply & Demand / SMC dashboard for scalping and intraday:
Multi-Timeframe Trend: Visualizes trend direction for M1, M5, M15, H1, H4.
HTF Supply/Demand: Shows closest high time frame (HTF) supply/demand zone and distance (in pips).
Smart “Flip” & Liquidity Signals: Flip and Liquidity Sweep arrows/signals are shown only when truly significant:
Near HTF Supply/Demand zone
And confirmed by volume spike or high confluence score
Momentum & Bias: Real-time momentum (RSI M1), H1 bias and fakeout detection.
Confluence Score: Objective score (out of 7) for trade confidence.
Volume Spike, Divergence, BOS: Includes volume spikes, RSI divergence (M1), and Break of Structure (BOS) for both M15 & H1.
Ultra-clean chart: Only valid signals/alerts shown; no spam or visual clutter.
Full dashboard with all signals and context, always visible bottom-right.
Best used for:
Forex, Gold/Silver, US indices, and crypto
Scalping/intraday with fast, clear decisions based on multi-factor SMC logic
Usage:
Add to your chart, monitor the dashboard for valid setups, and trade only when multiple factors align for high-probability entries.
How to Use the PRO SMC DASHBOARD
1. Add the Script to Your Chart:
Apply the indicator to your favorite Forex, Gold, crypto, or indices chart (best on M1, M5, or M15 for entries).
2. Read the Dashboard (Bottom Right):
The dashboard shows real-time information from multiple timeframes and key SMC filters, including:
Trend (M1, M5, M15, H1, H4):
Arrows show up (↑) or down (↓) trend for each timeframe, based on EMA.
Momentum (RSI M1):
Shows “Strong Up,” “Strong Down,” or “Neutral” plus the current RSI value.
RSI (H1):
Higher timeframe momentum confirmation.
ATR State:
Indicates current volatility (High, Normal, Low).
Session:
Detects if the market is in London, NY, or Asia session (based on UTC).
HTF S/D Zone:
Shows the nearest high timeframe Supply or Demand zone, its timeframe (M15, H1, H4), and exact pip distance.
Fakeout (last 3):
Detects recent false breakouts—if there are multiple fakeouts, potential for reversal is higher.
FVG (Fair Value Gap):
Indicates direction and distance to the nearest FVG (Above/Below).
Bias:
“Strong Buy,” “Strong Sell,” or “Neutral”—multi-timeframe, momentum, and volatility filtered.
Inducement:
Alerts for possible “stop hunt” or liquidity grab before reversal.
BOS (Break of Structure):
Recent or live breaks of market structure (for both M15 & H1).
Liquidity Sweep:
Shows if price just swept a key high/low and then reversed (often key reversal point).
Confluence Score (0-7):
Higher score means more factors align—look for 5+ for strong setups.
Volume Spike:
“YES” appears if the current volume is significantly above average—big players are active!
RSI Divergence:
Bullish or bearish divergence on M1—signals early reversal risk.
Momentum Flip:
“UP” or “DN” appears if RSI M1 crosses the 50 line, confirmed by location and other filters.
Chart Signals (Arrows & Markers):
Flip arrows (up/down) and Liquidity markers only appear when price is at/near a key Supply/Demand zone and confirmed by either a volume spike or strong confluence.
No signal spam:
If you see an arrow or LIQ tag, it’s a truly significant moment!
Suggested Trading Workflow:
Scan the Dashboard:
Is the multi-timeframe trend aligned?
Are you near a major Supply or Demand zone?
Is the Confluence Score high (5 or more)?
Check for Signals:
Is there a Flip or LIQ marker near a Supply/Demand zone?
Is volume spiking or a fakeout just occurred?
Look for Reversal or Continuation:
If there’s a Flip at Demand (with high confluence), consider a long setup.
If there’s a LIQ sweep + flip + volume at Supply, consider a short.
Manage Risk:
Don’t chase every signal.
Confirm with your entry criteria and preferred session timing.
Pro Tips:
Highest confidence trades:
When dashboard signals and chart arrows/markers agree, especially with high confluence and volume spike.
Adapt pip distance filter:
Dashboard is tuned for FX and gold; for other assets, adjust pip-size filter if needed.
Use alerts (if enabled):
Set up custom TradingView alerts for “Flip” or “Liquidity” signals for auto-notifications.
Designed to help you make professional, objective decisions—without chart clutter or second-guessing!

Eliora Gold 1min (Heikin Ashi)Eliora -focused trading strategy designed for anything on the 1-minute timeframe using Heikin Ashi candles. This mode combines advanced market logic with structured risk management to deliver smooth, disciplined trade execution.
Key Features:
✅ Trend Confirmation – Aligns with dominant market direction for higher accuracy.
✅ ATR-Based Volatility Filter – Avoids high-risk conditions and chaotic price action.
✅ Candle Strength Logic – Filters weak setups, focusing on strong momentum.
✅ Balanced Risk/Reward – Calculates stop-loss and take-profit dynamically for consistent results.
✅ Cooldown & Overtrade Protection – Limits frequency to maintain trade quality.
This version of Eliora is built for scalpers and intraday traders seeking high-probability entries with graceful exits.

Efficient Options Entry Signals (Call/Put/Spreads)Add to TradingView as a new Indicator Script.
Works on all timeframes, but defaults are tuned for daily/5m/15m.
Arrows and labels will show precise entries/exits for calls, puts, and debit spreads based on volatility.
Only efficient, trend-confirmed trades—no whipsaw overload!
All input parameters adjustable in the script UI.

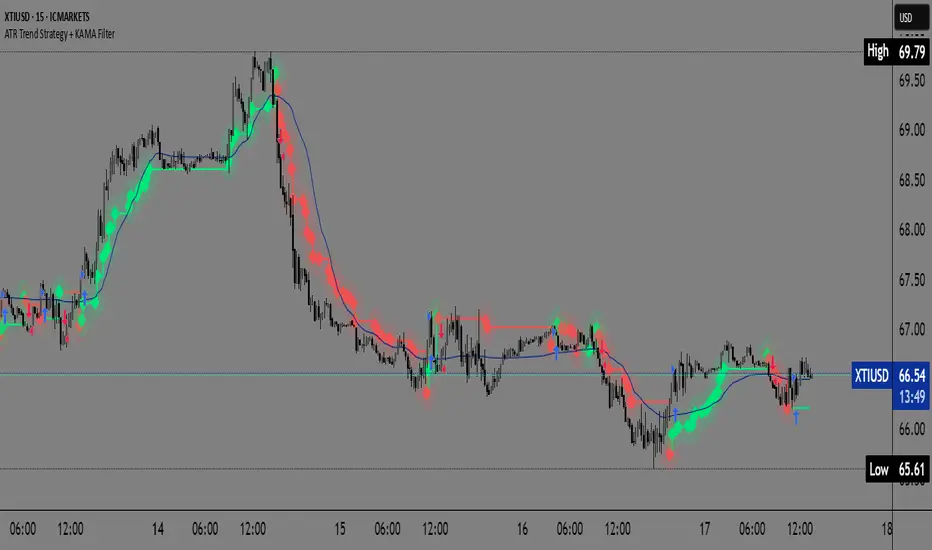
ATR Trend Strategy + KAMA FilterATR Trend Strategy with XMA KAMA Filter
Strategy Description
This strategy combines a dynamic ATR trailing stop with an XMA KAMA filter to precisely detect trends and generate reliable entry signals.
It uses a two-step trend confirmation system:
1️⃣ ATR Trailing Stop
Based on the Average True Range (ATR), this trailing stop automatically adapts to market volatility.
It determines whether the market is in a bullish or bearish phase by comparing the current price to the ATR trailing stop level.
2️⃣ KAMA Filter (XMA Version)
KAMA (Kaufman Adaptive Moving Average) provides an additional trend filter.
This XMA version of KAMA avoids the traditional fast/slow parameters and instead dynamically calculates the ratio of signal to market "noise", helping to reduce false signals and over-sensitivity.
How It Works
Long Signal:
Price is above both the ATR trailing stop and the KAMA (XMA) line.
Short Signal:
Price is below both the ATR trailing stop and the KAMA (XMA) line.
What Makes This Strategy Different?
Unlike many classic strategies that rely on simple moving averages, this system uses an adaptive KAMA filter that responds better to changing market conditions and volatility.
The ATR trailing stop automatically adjusts to current market volatility, providing an extra layer of protection against false breakouts.
By combining these tools, this strategy offers:
Precise trend filtering
Avoidance of false breakouts and noise
Dynamic adjustment to market conditions
How to Use
Apply the strategy to any market chart (Forex, stocks, crypto, indices, etc.)
Adjust the ATR and KAMA parameters to match your trading plan
Use the TradingView Strategy Tester to evaluate performance before live trading
Who Is This For?
Swing traders and trend followers
Traders looking for clean, filtered signals with reduced noise
Medium-term traders seeking a system that adapts to market dynamics
Additional Info: Heikin Ashi Compatibility
This strategy is fully compatible with Heikin Ashi candles.
By applying it to a chart with Heikin Ashi candles, traders can further reduce market noise and enhance trend visualization.
The combination of ATR trailing stop + XMA KAMA filter + Heikin Ashi smoothing provides an even cleaner trend-following system, minimizing false signals and improving decision-making clarity.
ATR Stop Loss Non-Decreasing & LineThe script calculates a custom stop-loss level based on the Average True Range (ATR) indicator, ensuring that this stop-loss level never decreases from one bar to the next unless a reset condition is met. It also visually displays the ATR value and the calculated stop-loss level as a line on the chart.

Position Size Calculator with ATR & Tick Risk Management Position Size Calculator with ATR & Tick Risk Management
This script calculates your optimal position size based on your account size, risk per trade, and either a fixed tick-based stop loss or the Average True Range (ATR) for dynamic risk control.
🔹 Flexible Risk Input : Choose between fixed ticks or ATR (Average True Range) as your risk measure
🔹 Precise Position Sizing : Calculates the maximum number of units you can trade while respecting your risk limit
🔹 Clear Table Display : Shows key values like total position size, risk in cents, ATR in ticks, and 40% / 80% partial take-profit levels
🔹 No Chart Clutter : The script runs in the background and does not plot on the chart
Perfect for traders who want to manage risk efficiently and objectively , whether trading stocks, futures, or CFDs.
⚙️ Customizable Inputs:
Account Size
Risk per Trade
Tick Risk (if ATR is disabled)
ATR Length & Multiplier (if ATR is enabled)

Adaptive Squeeze Momentum +Adaptive Squeeze Momentum+ (Auto-Timeframe Version)
Overview
Adaptive Squeeze Momentum+ is an enhanced volatility and momentum indicator designed to identify compression and expansion phases in price action. It is inspired by the classic Squeeze Momentum Indicator by LazyBear but introduces automatic parameter adaptation to any timeframe, making it simpler to use across different markets without manual configuration.
Concepts and Methodology
The script combines Bollinger Bands (BB) and Keltner Channels (KC) to detect periods when volatility contracts (squeeze) or expands (release).
A squeeze occurs when BB are inside KC, suggesting low volatility and potential breakout scenarios.
A squeeze release is detected when BB expand outside KC.
Momentum is derived using a linear regression applied to the difference between price and a midrange reference level.
Original Improvements
Compared to the original Squeeze Momentum Indicator, this version offers several enhancements:
Automatic Adaptation: BB and KC lengths and multipliers are dynamically adjusted based on the chart’s timeframe (from 1 minute up to 1 month), removing the need for manual tuning.
Simplified Visualization: A clean, minimalist histogram and clear squeeze state cross markers allow for faster interpretation.
Flexible Application: Designed to work consistently on intraday, daily, and higher timeframes across crypto, forex, stocks, and indices.
Features
Dynamic Squeeze Detection:
Gray Cross: Neutral (no squeeze detected)
Blue Cross: Active squeeze
Yellow Cross: Squeeze released
Momentum Histogram:
Positive/negative momentum shown with slope-based coloring.
Timeframe-Aware Parameters:
Automatically sets optimal BB/KC configurations.
Usage
Watch for blue crosses indicating an active squeeze phase that may precede a directional move.
Use the histogram color and slope to gauge momentum strength and direction.
Combine squeeze release signals with momentum confirmation for potential entries or exits.
Credits and Licensing
This script was inspired by LazyBear’s OLD “Squeeze Momentum Indicator” (). The implementation here significantly expands upon the original by introducing auto-adaptive parameters, restructured logic, and a new visualization approach. Published under the Mozilla Public License 2.0.
Disclaimer
This indicator is for educational purposes only and does not constitute financial advice. Use at your own risk.

YM Round Numbers & Quarters (Toggle Edition)This depicts whole numbers that helps me psychological levels
Volume Spike AlertIndicator Features:
📊 Core Functionalities:
Exceptional Volume Detection:
Calculates volume in USD (volume × price)
Compares it against a 90-day average (3 months)
Configurable from 1 to 252 days
Visual Signals:
Green labels for bullish candles with high volume
Red labels for bearish candles with high volume
Displays excess percentage (e.g., +45.2%)
Dual Alert System:
AlertCondition: For manual alert configuration in TradingView
Alert(): Automated alerts with detailed information
⚙️ Available Settings:
Average Period: 1–252 days (default: 90 days)
Enable/Disable Alerts: Configurable checkbox
Show/Hide Labels: Visual control
Label Size: Tiny, Small, Normal, Large
Minimum Threshold: Minimum percentage required to trigger a signal
📋 Displayed Information:
On Labels:
Excess percentage (e.g., +67.3%)
Color based on candle direction
In the Table:
Current volume in millions USD
Average volume in millions USD
Excess percentage
Alert status (ACTIVE/NORMAL)
Calculation period
In Alerts:
Candle type (BULLISH 🟢 / BEARISH 🔴)
Symbol and current price
Current volume vs. average
Timeframe used

NEPALI DASHBOARD NEPALI DASHBORAD - All-In-One Sentiment Dashboard
Overview
The NEPALI DASHBORAD is a comprehensive, all-in-one dashboard designed to give day traders a quick yet powerful overview of market sentiment. Instead of cluttering your chart with dozens of individual indicators, this tool consolidates the signals from 11 different technical indicators into a single, easy-to-read table. It calculates an overall bull/bear sentiment score and provides a trading recommendation based on the confluence of these signals, helping you make more informed decisions at a glance.
The dashboard is fully customizable, allowing you to adjust indicator settings, change the table size, and move it to any corner of your chart.
Key Features
Multi-Indicator Analysis: Gathers data from 11 essential indicators covering trend, momentum, volume, and volatility.
Sentiment Score: Calculates a simple "Bull vs. Bear" score to instantly gauge market sentiment.
Actionable Recommendations: Provides a clear trading recommendation (Strong Buy, Buy, Sell, Strong Sell, Hold) based on the strength of the confluence.
Higher Timeframe (HTF) Context: Includes an HTF trend analysis to ensure your trades align with the bigger picture.
Customizable Dashboard: Easily change the size and position of the dashboard to fit your workspace.
How to Use
Check the Market Sentiment: Look at the "Bull vs. Bear" score first. A high score (e.g., 8 vs. 3) indicates strong confluence in one direction.
Verify the HTF Trend: Ensure your intended trade direction aligns with the higher timeframe trend for better probability. For example, be cautious about taking "SELL" signals if the HTF Trend is strongly "BULL."
Use the Recommendation as a Guide: The "Recommendation" and "Confidence" % give you a summary of the indicator signals. A "STRONG BUY" or "STRONG SELL" means that a significant majority of the indicators are in agreement.
Drill Down into Indicators: Use the individual indicator statuses in the table to understand why the market sentiment is bullish or bearish. For example, you might see that momentum indicators (RSI, Stoch) are bullish, but trend indicators (MA, MACD) are still lagging.
Combine with Your Strategy: This dashboard is a powerful confirmation tool. Use its signals to confirm entries and exits for your existing trading strategy. Do not use it as a standalone signal provider.
Disclaimer
In simple terms: This is a tool for analysis, not a signal to trade. Your money is your responsibility.
This script is for educational and informational purposes only. I am not a financial advisor; I am just a learner sharing my work. The information and tools provided are not, and should not be construed as, financial advice, an offer, or a solicitation to buy or sell any securities.
Trading and investing in financial markets involve substantial risk of loss and is not suitable for every investor. I do not guarantee the accuracy, completeness, or profitability of this script. All trading decisions you make are your own, and you are solely responsible for any resulting profits or losses.
Always conduct your own research and seek advice from a qualified financial advisor before making any investment decisions. By using this script, you agree that I am not liable for any and all losses you may incur.

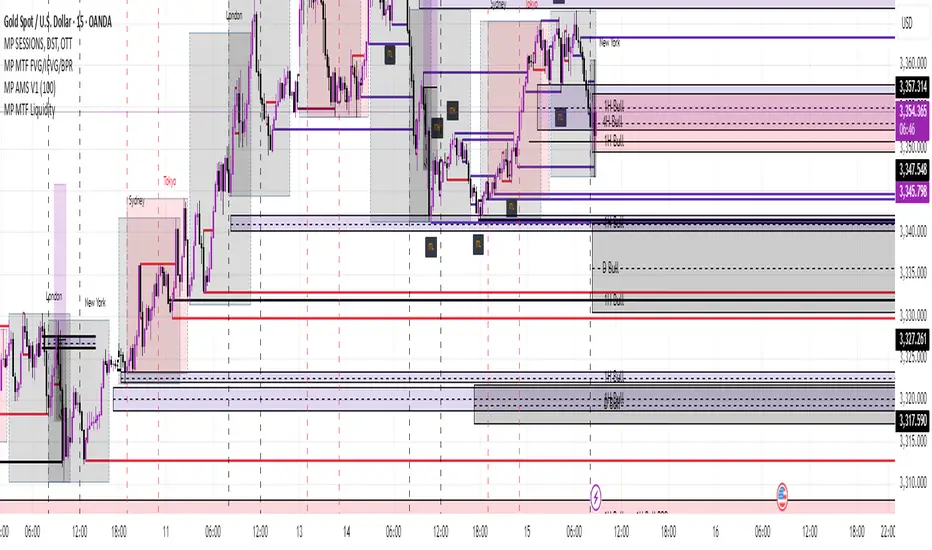
MP MTF LiquidityMP MTF Liquidity
Multi-Timeframe Liquidity Levels – Automatic High/Low Tracking
This indicator automatically tracks and draws liquidity levels (recent highs and lows) from up to 6 custom timeframes directly on your chart. It’s designed for advanced traders who want to visualize important swing points and liquidity pools across multiple timeframes—ideal for Smart Money Concepts (SMC), ICT, and price action trading.
Key Features:
Multi-Timeframe Support:
Select up to 6 different timeframes (ex: 1H, 4H, Daily, Weekly, etc.), each with separate color and visibility controls.
Real Liquidity (No Repaint):
Levels are only drawn from fully closed bars on each timeframe—no lines from currently forming candles, ensuring accuracy and no forward-looking bias.
Automatic Detection:
Highs and lows are detected automatically. Levels that get swept (price breaks through) are converted to dashed lines for easy visual distinction.
Customizable:
Choose line colors for highs/lows and set the maximum number of active levels per timeframe to keep charts clean.
Extended Lines:
All levels are extended to the right, helping you see how current price interacts with past liquidity.
How It Works:
On every new bar of your chosen higher timeframe(s), the indicator records the high and low of the previous (just-closed) candle.
These levels are extended as rays until price sweeps (crosses) them.
When a level is swept, it is redrawn as a dashed line to highlight liquidity grabs or stop hunts.
No lines are drawn for the “live” bar—only confirmed, closed levels are displayed.
Who is this for?
SMC, ICT, and price action traders seeking high-confidence liquidity zones.
Intraday, swing, and multi-timeframe traders who want an automated, visual edge.
Anyone wanting to avoid repainting or “fake” levels from unfinished candles.
Tip:
Combine this indicator with your favorite order block, fair value gap (FVG), or market structure tools for even greater context and confluence.
Disclaimer:
No indicator guarantees profits. Always use with proper risk management and in conjunction with your trading plan.
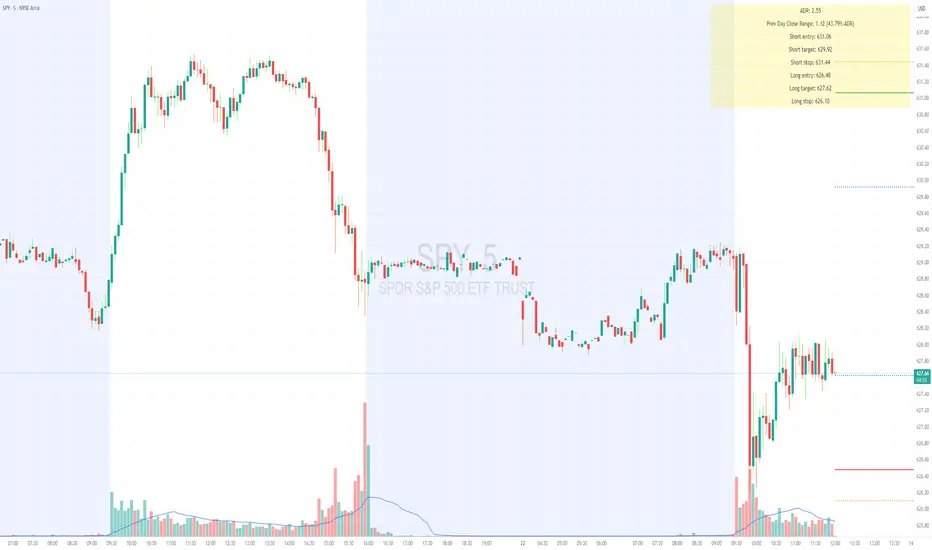
ADR TableTrack volatility and session momentum in real-time with customizable precision.
Key Features:
Average Daily Range (ADR): Configurable length (default 5 days), based on previous daily high–low ranges.
Session Anchor Options: Choose anchor at 4 am NY, 6 pm NY, 9:30 am NY, 8:30 am NY, Previous Day Close, or Current Bar.
Session Range & %ADR: Displays the real-time range from the chosen anchor, plus what percentage of ADR has been covered.
High / Low Target Levels: Calculates ADR targets based on anchor: anchor ± ADR.
Optional Target Lines: Draw horizontal lines for high and low targets across the session; customize color and width.
Dynamic Table Display: User-selectable table size and text size (Tiny to Huge) for optimal readability.
Robust Anchor Logic: Uses the first bar at-or-after anchor time each NY day, ensuring stability even on irregular intraday timeframes.
How to Use
Choose your anchor in settings.
View ADR, session range (with %ADR), and target price levels in the top-right pane.Toggle High/Low lines to overlay targets on the chart.
Adjust table and text size to match your workspace.
Why It Matters
Quickly assess where price stands relative to typical volatility.
Easily identify intraday price exhaustion or breakout zones.
Anchor flexibility enables use for both futures and equities, aligning with your trading session.
Clean, professional display—no clutter, no guesswork.
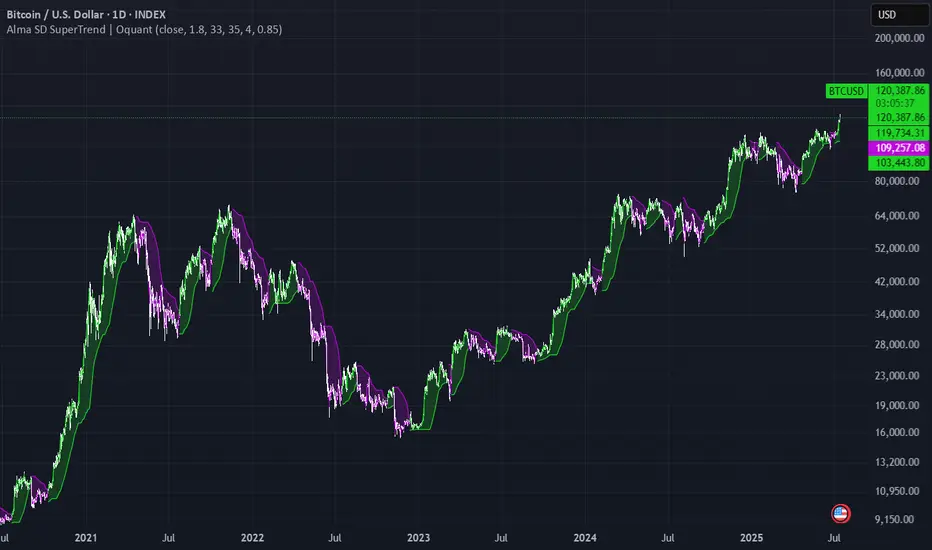
Alma SD SuperTrend | OquantAlma SD SuperTrend | Oquant
The "Alma SD SuperTrend | Oquant" is a trend-following indicator that integrates the Arnaud Legoux Moving Average (ALMA) with a SuperTrend calculation based on standard deviation (SD). Designed to quickly identify and follow market trends while reducing noise, this script provides buy and sell signals for traders across various assets and timeframes.
This script offers a unique approach by combining ALMA with a SuperTrend framework that uses standard deviation instead of the traditional Average True Range (ATR). This implementation focuses on fast trend detection with minimized noise, making it suitable for trend-following or swing trading strategies. The script’s customizable parameters allow traders to adapt it to their preferred trading style.
How It Works
Arnaud Legoux Moving Average (ALMA): ALMA is an advanced moving average that applies a Gaussian filter to smooth price data, reducing market noise while preserving responsiveness to price changes. It uses three parameters:
Length: Sets the lookback period for smoothing. Longer periods produce smoother results.
Offset: Shifts the moving average toward recent prices. Higher offsets emphasize newer data for faster trend detection.
Sigma controls the smoothness and lag of the Alma by adjusting the spread of the Gaussian distribution used in the calculation.
Standard Deviation (SD) Calculation: The script calculates the standard deviation of the price over a specified period to measure volatility. SD measures how much the prices deviate from its mean, offering a statistical perspective on market volatility. This is used to create dynamic upper and lower bands around the ALMA line, adjusted by a user-defined factor. The bands expand in volatile markets and contract in stable conditions, helping in trend detection.
SuperTrend Logic: The script generates a SuperTrend line that dynamically tracks market trends by switching between upper and lower volatility bands based on price movement. Here's how it works:
The SuperTrend line is calculated using the ALMA (Arnaud Legoux Moving Average) as a baseline, with upper and lower bands created by adding and subtracting a multiple(Factor) of the standard deviation (SD) from the ALMA.
When the price moves above the upper band, the SuperTrend line shifts to the lower band, indicating a bullish trend (potential buy signal).
When the price falls below the lower band, the SuperTrend line switches to the upper band, signaling a bearish trend (potential sell signal).
To avoid quick, unreliable changes, this script intelligently adjusts the SuperTrend bands for stability. While the SuperTrend line dynamically follows market movements, it's designed to hold at its previous level if the price doesn't cross a band or confirm a new trend direction. This approach ensures the SuperTrend quickly identifies and follows genuine market trends, providing clear signals while effectively reducing false alerts from short-term price swings.
Differences from Traditional SuperTrend:
Baseline: The traditional SuperTrend typically uses a hl2((high + low)/2)as its baseline, while this script employs ALMA for a smoother, noise-filtered trend foundation.
Volatility Measure: Instead of ATR, this script uses standard deviation to calculate the bands. Standard deviation measures how much the prices vary or spread out from its mean.
Visualization: The script plots the SuperTrend line, colors candles to match the trend, and fills the area between the price and the SuperTrend line for visual clarity, helping traders quickly identify trend direction and strength (green for bullish, purple for bearish).
How to Use It
Add to Chart: Apply the indicator to any market and timeframe.
Interpret Signals:
Green Line and Candles: Bullish trend (price above the SuperTrend line). Consider long entries.
Purple Line and Candles: Bearish trend (price below the SuperTrend line). Consider short entries.
Filled Area: The shaded area between price and the SuperTrend line highlights trend direction(green for bullish, purple for bearish).
Adjust Inputs:
Source: Select the price data to use (e.g., close, open, high, low).
Factor: Adjusts band width. Higher values widen bands, reducing sensitivity.
SD Length: Period for calculating standard deviation. Longer periods smooth volatility.
ALMA Length: Period for ALMA. Longer periods increase smoothness.
Alma Offset: Shift the moving average toward recent or older prices. Higher offsets emphasize newer data for faster trend detection.
ALMA Sigma control the smoothness and lag of the Alma by adjusting the spread of the Gaussian distribution used in the calculation.
Alerts
This indicator includes optional built-in alert conditions that notify you when the signal crosses above 0 (long signal, price above upper band) or below 0 (short signal, price below lower band). Enable these alerts to get timely updates on potential trend shifts without constantly monitoring the chart.
⚠️ Disclaimer: This indicator is intended for educational and informational purposes only. Trading/investing involves risk, and past performance does not guarantee future results. Always test and evaluate indicators/strategies before applying them in live markets. Use at your own risk.
Rally/Drop Market Structure (Multi-Timeframe)Rally/Drop Market Structure
Supply and Demand Zones from Bullish/Bearish Breaks
Overview:
The Rally/Drop Market Structure indicator is a powerful price action tool that identifies key structural turning points in the market by detecting bullish and bearish breaks . After each confirmed break, it plots either a demand zone (following a bullish break or rally) or a supply zone (following a bearish break or drop). These zones represent institutional footprints — areas where price is likely to react due to imbalance or unfilled orders.
The indicator is based on synthetic higher timeframe (HTF) candles to provide a more stable and smoothed structural map, improving clarity and signal quality over raw candles.
How It Works:
- A bullish break is defined when price makes a higher high and a higher low (or closes above the previous high depending on your selected mode).
- A bearish break is defined when price makes a lower high and a lower low (or closes below the previous low).
- After a bullish break, the indicator plots a demand zone based on the low and high of the most recent bearish candle — representing where demand stepped in.
- After a bearish break, the indicator plots a supply zone from the most recent bullish candle — indicating where supply took control.
- Optional mitigation logic marks zones as mitigated (or deletes them) once price trades into the opposing side.
- Internal shift detection highlights swing highs and lows , labels structural points (HH, HL, LH, LL), and identifies potential liquidity sweeps .
Features:
- Dynamic plotting of rally-based demand zones and drop-based supply zones
- Toggle to use Highs/Lows or Close-based breaks for structure
- Support for LTF, MTF, and HTF analysis (with selectable timeframe)
- Zone mitigation logic with optional automatic cleanup
- Labeling of key swing points: HH , HL , LH , LL , and LS (Liquidity Sweep)
- Zigzag visualization for structure flow
- Alert-ready for internal shifts, BoS, and zone creation
- Separate styling options for BoS lines, internal shift shapes, and zone colors
How to Use:
- Set your desired HTF candle source (e.g., 1H or 4H) depending on your trading style.
- Use Highs/Lows mode for pure price action structure or Close mode for more conservative signals.
- Observe when a bullish break occurs — a demand zone will form where price previously dropped before rallying. Look for long opportunities if price revisits this zone.
- After a bearish break , a supply zone forms where the rally failed — use this to scout short entries on retests.
- Use BoS lines to confirm structure shifts and validate entry triggers or trend direction.
- Monitor mitigated zones for reduced reliability or avoid them completely by enabling automatic deletion.
- Use alerts to stay notified about key changes without watching the chart constantly.
Recommended Strategies:
- Smart money or ICT-style trading : identify institutional footprints and mitigation setups
- Reversal trading : catch price rejecting off unmitigated zones after structure break
- Trend continuation : enter in the direction of internal structure after pullbacks into zones
- Liquidity sweep confirmation : filter out false breaks using HH/LL with LS detection
Tips:
- Combine this indicator with a higher timeframe bias tool (e.g., moving average, higher timeframe market structure).
- For scalping, use tighter HTFs and reduce the zone duration.
- For swing trading, use larger HTFs (1H, 4H, Daily) and increase zone persistence.
Summary:
The Rally/Drop Market Structure indicator gives you an actionable framework for understanding price structure, market intent, and supply/demand imbalances. Whether you're looking for precision entries, trend confirmation, or smart money concepts, this tool helps simplify complex price behavior into clean, usable structure and zones.

Dominance Candle Raja Saien (Detector with Alerts)Dominance Candle Finder with Alerts by Raja Saien
This powerful indicator is designed to detect dominance candles—those strong-bodied candles that often signify momentum and trend strength. Whether you're trading breakouts, trend continuations, or reversals, this tool helps you identify key market moves in real time with optional alerts.
🔍 Features:
Automatic Detection of Dominance Candles: Highlights candles with strong body size, showing decisive market movement.
Customizable Thresholds: Adjust sensitivity according to your strategy or asset volatility.
Built-in Alerts: Get notified the moment a dominance candle forms—no need to stare at charts all day!
Multi-Timeframe Compatibility: Works on any timeframe from 1-minute to daily or higher.
📊 Use Cases:
Entry confirmation on breakouts
Trend strength analysis
Volatility surge detection
Combine with support/resistance or order block zones for powerful setups
Tip: Best used with strong support/resistance levels or price action strategies for confluence
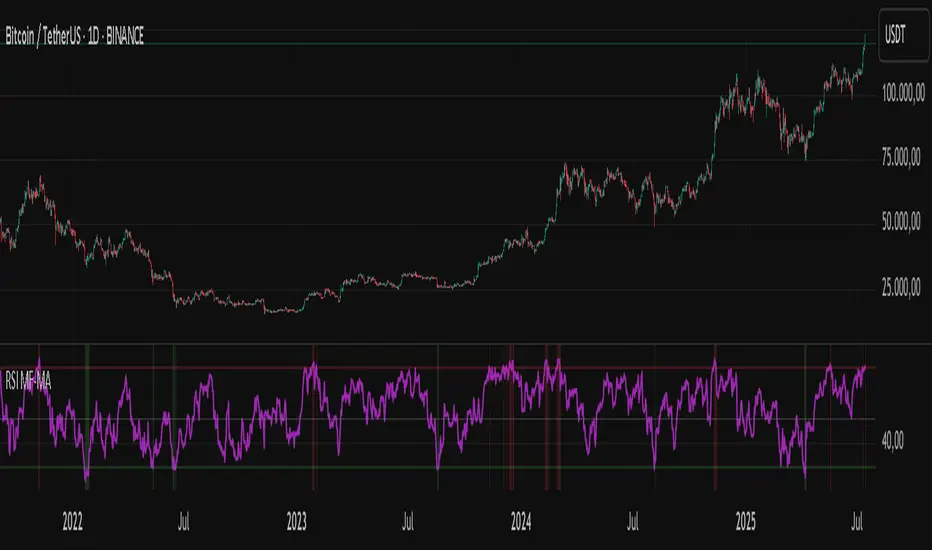
RSI Multi-Frame Multi-Asset
✅ Key Features:
Multi-Asset: Simultaneously analyze Bitcoin, SP500, Nasdaq, DXY, Gold, Oil, VIX and more
Multi-Timeframe: Configure any timeframe for all RSI calculations
Smart Average RSI: Automatically calculates the mean of all active RSI values
Special Data: Includes Bitcoin Hashrate, 10Y-2Y Spread, and US Interest Rates
Built-in Alerts: Automatic notifications on overbought/oversold crossovers
🎯 Why is it Unique?
Instead of looking at 10 different charts, you get an instant macro view of the market. The average RSI shows you the overall strength/weakness of global markets, while individual RSI values let you identify divergences and specific opportunities.
🚀 Perfect For:
Traders seeking correlations between assets
Global markets macro analysis
Identifying divergences between Bitcoin and traditional markets
Multi-timeframe breakout trading
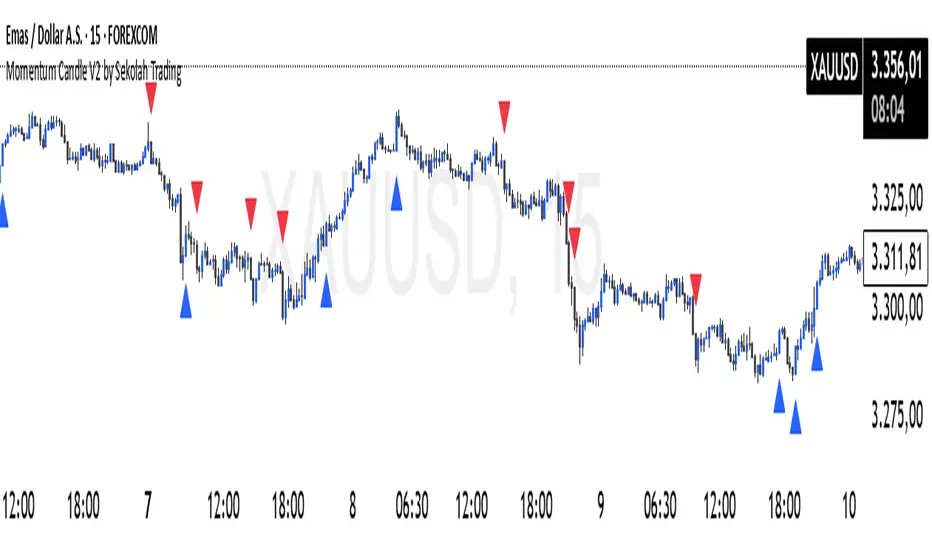
Momentum Candle V2 by Sekolah Trading📌 Momentum Candle V2 by Sekolah Trading – Pair-Based Volatility & Wick Ratio Filter
This script provides a structured and adaptive approach to detecting high-probability momentum candles in intraday markets. It dynamically adjusts pip thresholds and wick filtering conditions based on the selected symbol and timeframe, making it highly practical for real-time trading.
🔍 Concept and Originality
Momentum Candle V2 by Sekolah Trading implements a custom-built methodology combining:
Dynamic Pip Calibration
For each supported instrument (e.g., XAUUSD, USDJPY, GBPUSD, AUDUSD, EURUSD, BTCUSD), the user can define a pip threshold that determines the minimum valid body size for momentum candles. These thresholds are tailored for each pair and timeframe (M5, M15, H1), ensuring the logic adjusts to different volatility profiles.
Wick-to-Body Ratio Filtering
The script filters out candles with large wicks by requiring that total wick length (upper + lower) be no more than 30% of the full candle range. This helps identify decisive candles with minimal rejection.
Directional Validation
Bullish momentum is defined as: Close > Open with a shorter upper wick.
Bearish momentum is: Close < Open with a shorter lower wick.
Real-Time Timing Filter
Alerts are only triggered when the current candle is between 20 and 90 seconds from closing, which reduces noise and encourages confirmation-based entry.
Non-Repainting Logic
All calculations run in real-time with confirmed candles only — no lookahead or future leak.
📊 Visual Output – How to Read the Chart
When the conditions above are met, the script displays triangle markers on the chart:
🔺 Red downward triangle above the candle: valid bearish momentum signal
🔻 Blue upward triangle below the candle: valid bullish momentum signal
These shapes appear on live bars during the final moments of the candle to alert traders to potential confirmed momentum.
🔔 Alert Conditions
Two alert types are provided:
Momentum Bullish: Large bullish candle with small upper wick, during last 20–90s of bar
Momentum Bearish: Large bearish candle with small lower wick, same timing window
Alerts are designed for precision entries at candle close.
🧭 How to Use
Apply the script to a 5m, 15m, or 1h chart.
Configure pip thresholds for your preferred pairs from the input settings.
Watch for triangle markers near the close of each candle:
Blue = potential bullish momentum
Red = potential bearish momentum
Set alerts:
Go to Alerts → Select Momentum Bullish or Momentum Bearish
Frequency: Once Per Bar
Customize message: e.g. “Momentum Bullish on XAUUSD M15”
Combine signals with:
EMA, S/R, or trend filters
Volume/Order Flow
Liquidity zone or breakout context
🛡️ Why This Script Is Closed-Source
This script uses proprietary logic developed by Sekolah Trading, including:
Custom pip calibration engine
Adaptive wick filtering
Real-time entry validation with triangle plots
While the code is protected, the methodology has been explained transparently here in accordance with TradingView publishing rules.
⚠️ Disclaimer
This script is provided for educational and technical analysis purposes only.
It does not guarantee results or provide financial advice. Always verify trades with your own strategy and risk controls.
Author: Sekolah Trading
Version: Momentum Candle V2
Built with Pine Script v6
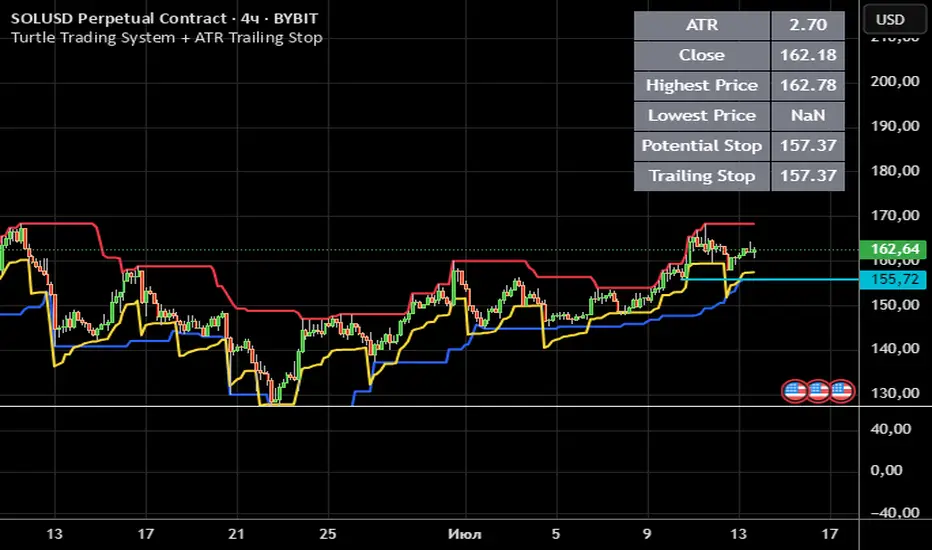
Turtle Trading System + ATR Trailing StopIndicator Description: Turtle ATR Trailing Stop
The **Turtle ATR Trailing Stop** is a technical indicator designed to enhance the classic Turtle Trading System by incorporating a dynamic trailing stop based on the Average True Range (ATR). This indicator is ideal for traders seeking to manage risk and lock in profits on both long and short positions in trending markets.
Key Features:
- Turtle Trading Levels: Calculates the 20-day highest high and lowest low to identify potential breakout points, a core principle of the Turtle Trading System.
- ATR-Based Trailing Stop: Utilizes a trailing stop that adjusts dynamically based on a multiple of the ATR (default multiplier: 2.0), providing a volatility-adjusted exit mechanism.
- Position Flexibility: Supports both long and short positions, with the trailing stop positioned below the highest price for long trades and above the lowest price for short trades.
- Smooth Updates: The trailing stop updates on each bar, ensuring a more responsive adjustment to price movements, rather than only on new highs or lows.
- Reset Mechanism: Automatically resets the trailing stop when the price deviates significantly (configurable threshold, default 0.1%), adapting to major trend reversals.
- Alerts: Includes customizable alerts that trigger when the price reaches the trailing stop level, notifying traders of potential exit points.
- Debugging Tools: Features an on-chart debug table displaying ATR, Close, Highest Price, Lowest Price, Potential Stop, and Trailing Stop values for real-time analysis.
How It Works:
- For **Long Positions**: The trailing stop starts below the initial close price (minus 2*ATR) and moves up as the highest price increases, locking in profits while trailing at a fixed ATR distance.
- For **Short Positions**: The trailing stop starts above the initial close price (plus 2*ATR) and moves down as the lowest price decreases, protecting against upward price movements.
- The stop resets if the price falls (for long) or rises (for short) beyond the set threshold, ensuring adaptability to new market conditions.
Customization:
- Period Settings: Adjust the length for highs/lows (default 20) and ATR period (default 14).
- ATR Multiplier: Modify the distance of the trailing stop (default 2.0).
- Reset Threshold: Fine-tune the percentage at which the stop resets (default 0.1%).
- Position Type: Switch between "Long" and "Short" modes via input settings.
Usage:
Apply this indicator to any chart in TradingView, set your preferred parameters, and monitor the trailing stop line (yellow) alongside the Turtle highs (red) and lows (blue). Use the debug table to validate calculations and set alerts to stay informed of stop triggers.
This indicator combines the trend-following strength of the Turtle System with a flexible, ATR-based stop-loss strategy, making it a powerful tool for both manual and automated trading strategies.