PSX OBV Divergence Labels (1D)PSX OBV Divergence Labels (1H/4H/1D/1W, Enhanced)
Description:
This indicator marks bullish and bearish OBV divergences on the price chart for PSX and other markets. Designed specifically for swing traders who operate on 1H, 4H, 1D, and 1W timeframes, it enhances basic divergence detection by incorporating volume spikes and OBV slope confirmation — improving signal reliability and reducing noise.
Key Features:
📈 Bullish Divergence: Marks potential buy zones when price hits a local low while OBV shows upward momentum with volume spike confirmation.
📉 Bearish Divergence: Flags potential sell zones when price hits a local high while OBV trends lower with volume weakness.
✅ Slope Confirmation: Filters signals based on sustained OBV direction over a user-defined number of bars.
🔊 Volume Filter: Detects divergence only when volume exceeds the average by a customizable multiplier (default 1.0).
🔍 Clean Visualization: Green “BUY” and red “SELL” labels show clearly on the chart, synced with candle price movement.
Best Timeframes to Use:
1H, 4H, 1D, and 1W (optimized for PSX stocks, KSE100, and KMI30)
Swing traders aiming for 2–4 week holding windows will find the most utility.
Recommended Settings:
OBV Lookback: 20
Volume Smoothing: 20
Spike Multiplier: 1.0
Slope Confirmation: 3 bars
Strategy Tip:
Use divergences in confluence with key support/resistance levels, price action traps, and market structure for high-probability setups. This tool is best used for trend exhaustion detection and reversal signals.
Volume

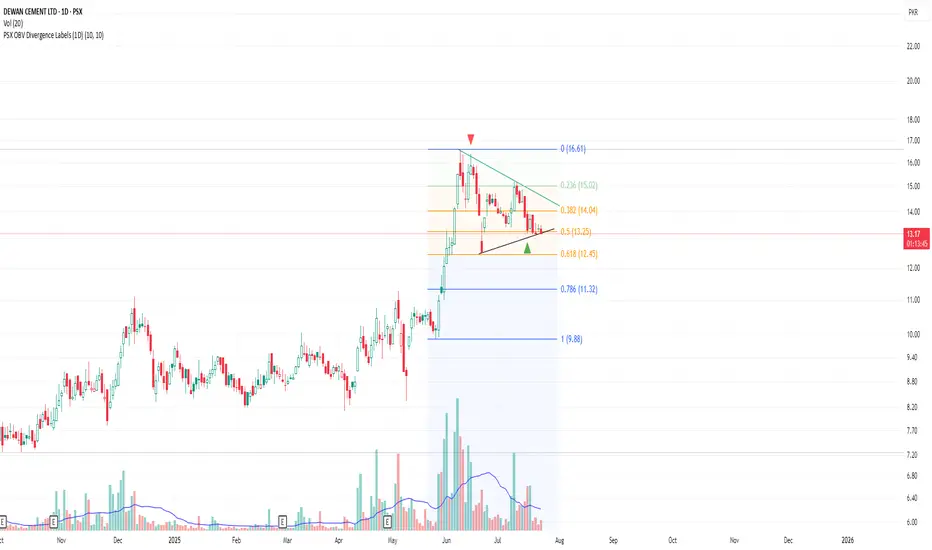
PSX OBV Divergence Labels (1D)PSX OBV Divergence Labels (1D)
This indicator highlights bullish and bearish OBV (On-Balance Volume) divergences on the price chart, specifically designed for daily timeframe swing trading in PSX (Pakistan Stock Exchange) stocks.
🟢 Green triangle (Bullish Divergence) appears when price makes a new low but OBV does not — suggesting accumulation and potential reversal.
🔴 Red triangle (Bearish Divergence) appears when price makes a new high but OBV does not — indicating weakening momentum and possible distribution.
Volume spike filtering is included to increase reliability. No trade signals or exits — this is a pure visual divergence tool to support manual decision-making. Ideal for spotting shifts in volume pressure ahead of price reversals.
JMR vwap inside barThis indicator will add vwap and according to your chart time frame and also will mark inside bar candles.
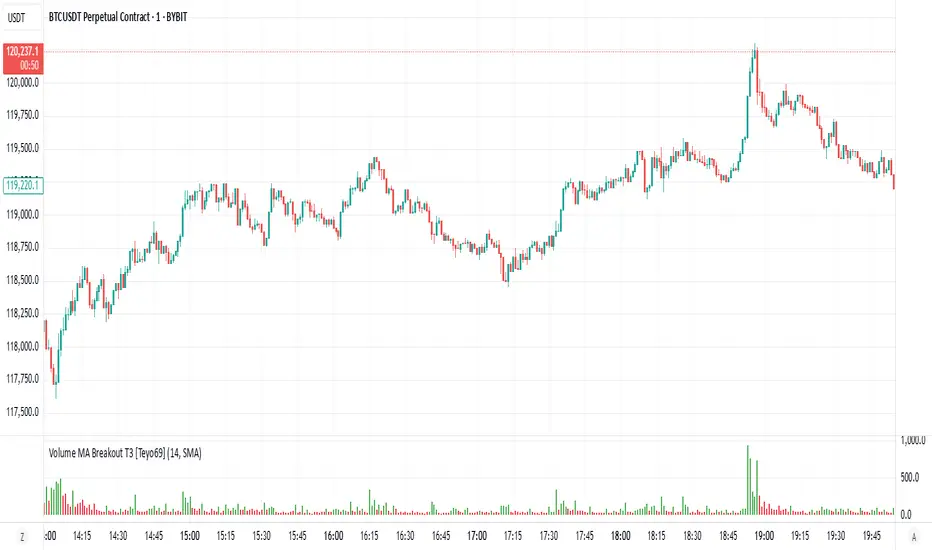
Volume MA Breakout T3 [Teyo69]🧭 Overview
Volume MA Breakout T3 highlights volume bars that exceed a dynamic moving average threshold. It helps traders visually identify volume breakouts—periods of significant buying or selling pressure—based on user-selected MA methods (SMA, EMA, DEMA).
🔍 Features
Volume Highlighting: Green bars indicate volume breakout above the MA; red bars otherwise.
Custom MA Options: Choose between SMA, EMA, or Double EMA for volume smoothing.
Dynamic Threshold: The moving average line adjusts based on user-defined length and method.
⚙️ Configuration
Length: Number of bars used for the moving average calculation (default: 14).
Method: Type of moving average to use:
"SMA" - Simple Moving Average
"EMA" - Exponential Moving Average
"Double EMA" - Double Exponential Moving Average
📈 How to Use
Apply to any chart to visualize volume behavior relative to its MA.
Look for green bars: These suggest volume is breaking out above its recent average—potential signal of momentum.
Red bars indicate normal/subdued volume.
⚠️ Limitations
Does not provide directional bias—use with price action or trend confirmation tools.
Works best with additional context (e.g., support/resistance, candle formations).
🧠 Advanced Tips
Use shorter MAs (e.g., 5–10) in volatile markets for more responsive signals.
Combine with OBV, MFI, or accumulation indicators for confluence.
📌 Notes
This is a volume-based filter, not a signal generator.
Useful for breakout traders and volume profile enthusiasts.
📜 Disclaimer
This script is for educational purposes only. Always test in a simulated environment before live trading. Not financial advice.
Persistent 1H S/R Zones with Labels (No Overlap) + 50 EMAit helps find recant support and resistance zones with swing points

Webull-style VWAPThis is a clean, simple VWAP (Volume Weighted Average Price) indicator designed to resemble the VWAP line displayed on the Webull trading platform.
🔷 Includes all trading sessions (regular and extended hours) when enabled on your chart.
🔷 Resets daily at the start of each session.
🔷 Does not include any bands or deviations — just the core VWAP line for clarity.
🔷 Plots directly on your price candles for easy reference.
Perfect for intraday traders who rely on VWAP as a key dynamic support/resistance level and want a TradingView experience closer to Webull’s default implementation.

HeatVOLFirst and foremost, credit goes to xdecow and his great work in the Heatmap Volume indicator. I copied it to make some changes that I wanted (mainly being able to color the volume bars and candlesticks independently).
Overview:
HeatVOL uses statistical analysis to instantly identify significant volume anomalies. By calculating Z-scores (standard deviations from the moving average), it creates a visual heatmap that highlights unusual market activity in real-time. Both candlesticks and volume bars are color-coded based on customizable thresholds, making volume surges immediately visible.
🎨 Visual Heatmap System
- Color-coded candlesticks and volume bars based on volume intensity
- Five threshold levels: Extra High (4σ), High (2.5σ), Medium (1σ), Normal (-0.5σ), and Low
- Multiple display modes: backgrounds, lines, or both
- Customizable colors for all threshold levels
🔔 Smart Alerts
- Set alerts for any threshold level
- Separate alerts for up/down volume bars
- Monitor unusual volume activity across multiple instruments
Use Cases:
- Identify institutional activity and large player participation
- Spot potential breakouts or reversals with volume confirmation
- Monitor volume climax and exhaustion patterns
- Analyze volume trends across different timeframes

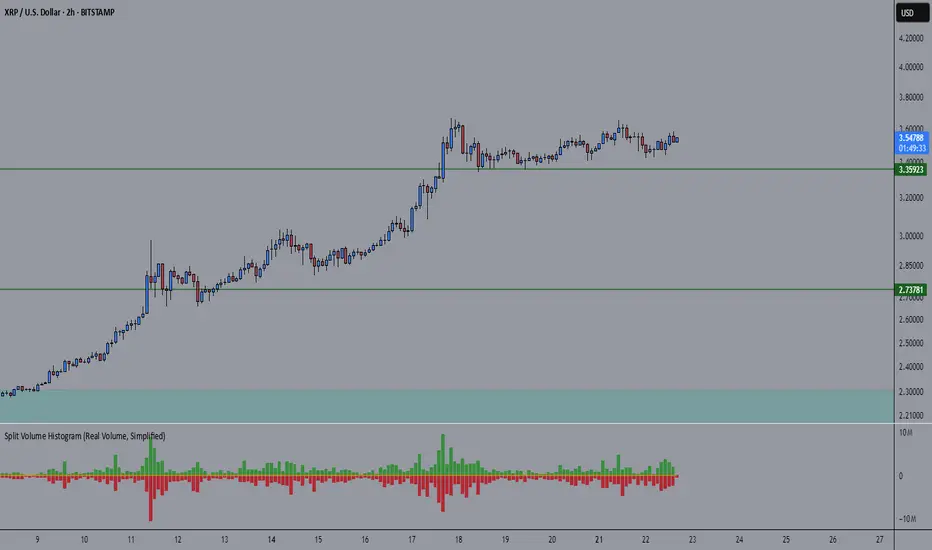
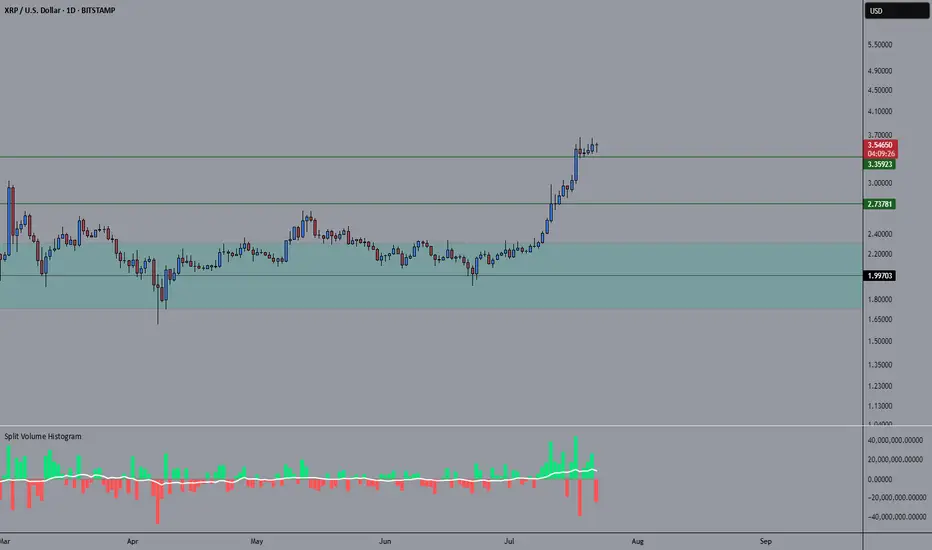
Split Volume Histogram (Real Volume)v2 better volume indicator showing you exactly how much is buy or sell volume at the same time
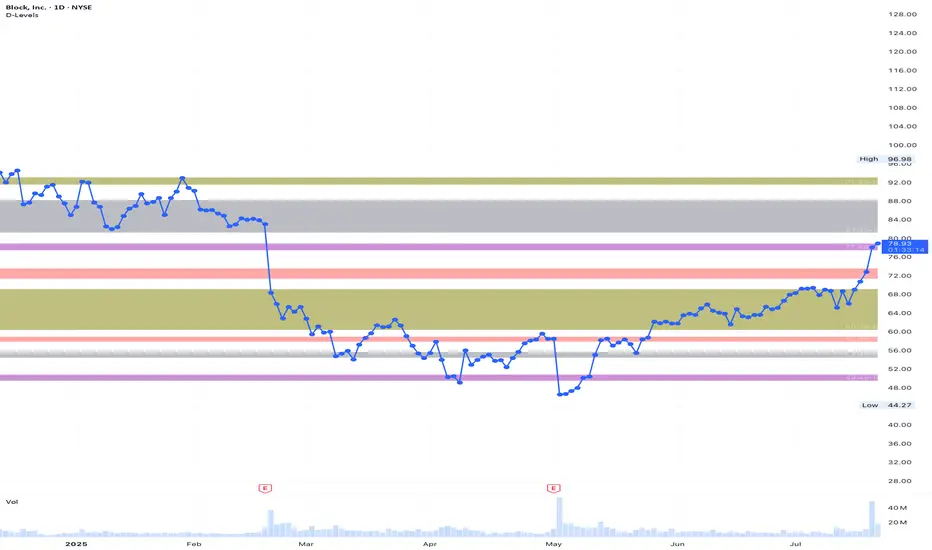
D-LevelsThis indicator accepts a comma-separated list of price ranges as input and visualizes each range as a distinct zone on the chart, using randomized colors for distinction.
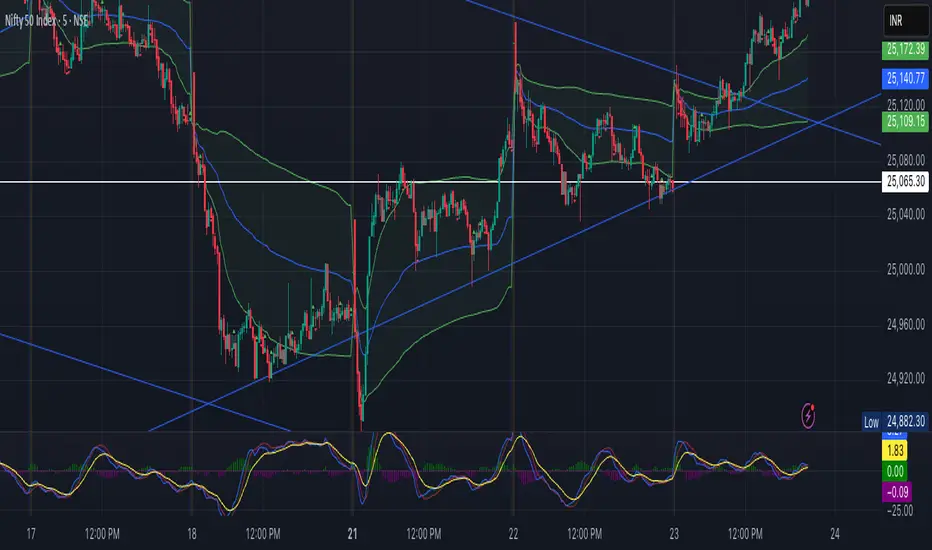
RSI + TSV Kombi📊 RSI + TSV Combo Indicator (Intraday Reversal Tool)
This custom TradingView indicator is designed for intraday traders who want to combine price momentum (via RSI) with volume-based confirmation (via TSV). It’s particularly powerful for spotting short-term reversals around key market zones like VWAP, support/resistance, or options levels.
🧠 What does the Indicator show?
The indicator contains two elements in one pane:
🔹 Top Line – RSI (Relative Strength Index)
Type: RSI(7) – a short-term version of the classic RSI
Color-coded:
🟢 Green when RSI < 30 → potential oversold → bullish bias
🔴 Red when RSI > 70 → potential overbought → bearish bias
⚪ Gray in between → neutral
🔎 Purpose: Identifies overextended price moves — early warning for possible reversal zones.
🔸 Bottom Bars – TSV (Time Segmented Volume)
Formula: EMA(change(close) * volume, 9)
Color-coded histogram:
🟢 Green when TSV > 0 → bullish volume momentum
🔴 Red when TSV < 0 → bearish volume momentum
🔎 Purpose: Confirms whether price moves are supported by actual volume — helps filter false signals from RSI.
⚖️ How to Interpret the Indicator
✅ Long Setup
RSI is below 30 (green line)
TSV bars turn green or cross above 0
Ideally at a support level or near VWAP
➡️ Buy signal confirmed by volume
❌ Short Setup
RSI above 70 (red line)
TSV bars are red or turning red
Ideally at a resistance zone or VWAP deviation
➡️ Sell signal confirmed by selling pressure
⚠️ Avoid trades when...
RSI is oversold/overbought, but TSV disagrees
(e.g. RSI < 30 but TSV is red → weak confirmation)
🧭 Practical Usage in Intraday Trading (e.g. 5-minute chart)
Step What to look for
Setup Zone RSI hits extreme level (under 30 or above 70)
Volume Confirmation TSV bars flip color (red → green or vice versa)
Entry Price breaks candle high/low with volume support
Exit VWAP, volume node, or next support/resistance zone
🔧 Options for Expansion
This script is already running cleanly, but you could easily extend it with:
📍 Buy/Sell Arrows on chart when both RSI + TSV align
🔔 Alerts for instant trade triggers
💡 Overlay version that places symbols directly on the price chart
🔒 Filter to only show signals above/below VWAP
Let me know — I can build any of these for you.
✅ Summary
This RSI + TSV Combo is a simple yet powerful tool to:
Spot momentum reversals
Confirm trades with volume
Stay disciplined and rule-based in fast-moving intraday setups
It’s especially useful when combined with:
VWAP
Volume Profile Zones (HVNs/LVNs)
Key psychological or options levels

Volume Heatmap ProVolume Heatmap Pro - Statistical Volume Analysis Indicator
First and foremost, credit goes to xdecow. You can find the original indicator here:
I forked this indicator to make some changes that I wanted (mainly being able to color the volume bars and candlesticks independently).
Overview:
Volume Heatmap Pro is an advanced volume analysis tool that uses statistical analysis to identify significant volume anomalies in real-time. By calculating how many standard deviations the current volume is from its moving average (Z-score), it provides a visual heatmap that instantly highlights unusual volume activity.
Key Features:
📊 Statistical Volume Analysis
- Measures volume using Z-score calculations (standard deviations from mean)
- Dynamically adapts to each instrument's unique volume profile
- Identifies statistically significant volume spikes and drops
🎨 Visual Heatmap System
- Color-coded candlesticks and volume bars based on volume intensity
- Five threshold levels: Extra High (4σ), High (2.5σ), Medium (1σ), Normal (-0.5σ), and Low
- Multiple display modes: backgrounds, lines, or both
- Customizable colors for all threshold levels
⚙️ Flexible Configuration
- Adjustable moving average and standard deviation lengths (default: 610)
- Two color modes: Heatmap (volume-only) or Up/Down (volume + direction)
- Volume bar opacity control
🔔 Smart Alerts
- Set alerts for any threshold level
- Separate alerts for up/down volume bars
- Monitor unusual volume activity across multiple instruments
Use Cases:
- Identify institutional activity and large player participation
- Spot potential breakouts or reversals with volume confirmation
- Monitor volume climax and exhaustion patterns
- Analyze volume trends across different timeframes
- Validate price movements with statistical volume analysis
Perfect For:
Day traders, swing traders, VPA traders, and investors who want to add visual confirmation to their volume analysis and quickly identify when "smart money" is active in the market.
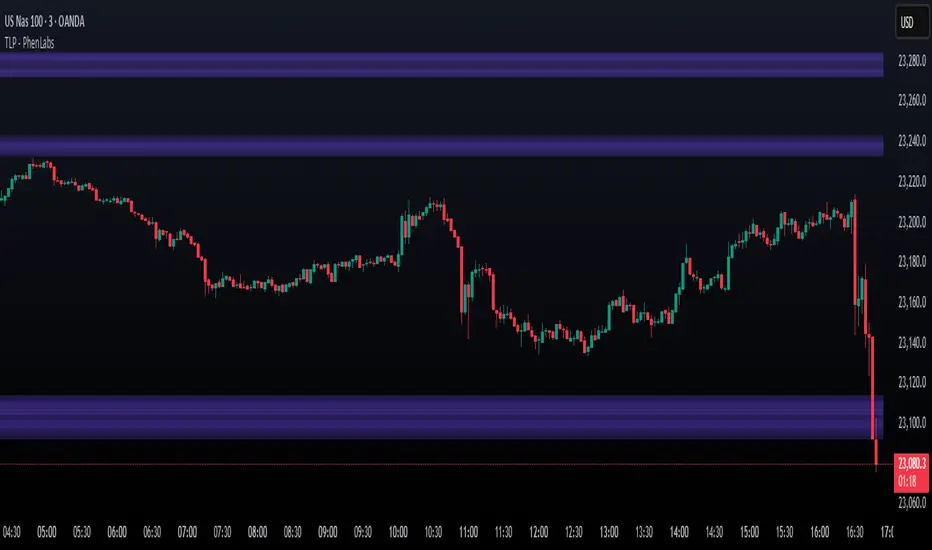
Liquidity Trap Zones [PhenLabs]📊 Liquidity Trap Zones
Version: PineScript™ v6
📌 Description
The goal of the Liquidity Trap Zones indicator is to try and help traders identify areas where market liquidity appears abundant but is actually thin or artificial, helping traders avoid potential fake outs and false breakouts. This advanced indicator analyzes the relationship between price wicks and volume to detect “mirage” zones where large price movements occur on low volume, indicating potential liquidity traps.
By highlighting these deceptive zones on your charts, the indicator helps traders recognize where institutional players might be creating artificial liquidity to trap retail traders. This enables more informed decision-making and better risk management when approaching key price levels.
🚀 Points of Innovation
Mirage Score Algorithm: Proprietary calculation that normalizes wick size relative to volume and average bar size
Dynamic Zone Creation: Automatically generates gradient-filled zones at trap locations with ATR-based sizing
Intelligent Zone Management: Maintains clean charts by limiting displayed zones and auto-updating existing ones
Scale-Invariant Design: Works across all assets and timeframes with intelligent normalization
Real-Time Detection: Identifies trap zones as they form, not after the fact
Volume-Adjusted Analysis: Incorporates tick volume when available for more accurate detection
🔧 Core Components
Mirage Score Calculator: Analyzes the ratio of price wicks to volume, normalized by average bar size
ATR-Based Filter: Ensures only significant price movements are considered for trap zone creation
EMA Smoothing: Reduces noise in the mirage score for clearer signals
Gradient Zone Renderer: Creates visually distinct zones with multiple opacity levels for better visibility
🔥 Key Features
Real-Time Trap Detection: Identifies liquidity mirages as they develop during live trading
Dynamic Zone Sizing: Adjusts zone height based on current market volatility (ATR)
Smart Zone Management: Automatically maintains a clean chart by limiting the number of displayed zones
Customizable Sensitivity: Fine-tune detection parameters for different market conditions
Visual Clarity: Gradient-filled zones with distinct borders for easy identification
Status Line Display: Shows current mirage score and threshold for quick reference
🎨 Visualization
Gradient Trap Zones: Purple gradient boxes with darker centers indicating trap strength
Mirage Score Line: Orange line in status area showing current liquidity quality
Threshold Reference: Gray line showing your configured detection threshold
Extended Zone Display: Zones automatically extend forward as new bars form
📖 Usage Guidelines
Detection Settings
Smoothing Length (EMA) - Default: 10 - Range: 1-50 - Description: Controls responsiveness of mirage score. Lower values make detection more sensitive to recent price action
Mirage Threshold - Default: 5.0 - Range: 0.1-20.0 - Description: Score above this level triggers trap zone creation. Higher values reduce false positives but may miss subtle traps
Filter Settings
ATR Length for Range Filter - Default: 14 - Range: 1-50 - Description: Period for volatility calculation. Standard 14 works well for most timeframes
ATR Multiplier - Default: 1.0 - Range: 0.0-5.0 - Description: Minimum bar range as multiple of ATR. Higher values filter out smaller moves
Display Settings
Zone Height Multiplier - Default: 0.5 - Range: 0.1-2.0 - Description: Controls trap zone height relative to ATR. Adjust for visual preference
Max Trap Zones - Default: 5 - Range: 1-20 - Description: Maximum zones displayed before oldest are removed. Balance clarity vs. history
✅ Best Use Cases
Identifying potential fakeout levels before entering trades
Confirming support/resistance quality by checking for liquidity traps
Avoiding stop-loss placement in trap zones where sweeps are likely
Timing entries after trap zones are cleared
Scalping opportunities when price approaches known trap zones
⚠️ Limitations
Requires volume data - less effective on instruments without reliable volume
May generate false signals during news events or genuine volume spikes
Not a standalone system - combine with price action and other indicators
Zone creation is based on historical data - future price behavior not guaranteed
💡 What Makes This Unique
First indicator to specifically target liquidity mirages using wick-to-volume analysis
Proprietary normalization ensures consistent performance across all markets
Visual gradient design makes trap zones immediately recognizable
Combines multiple volatility and volume metrics for robust detection
🔬 How It Works
1. Wick Analysis: Calculates upper and lower wicks for each bar. Normalizes by average bar size to ensure scale independence
2. Mirage Score Calculation: Divides total wick size by volume to identify thin liquidity. Applies EMA smoothing to reduce noise. Scales result for optimal visibility
3. Zone Creation: Triggers when smoothed score crosses threshold. Creates gradient boxes centered on trap bar. Sizes zones based on current ATR for market-appropriate scaling
💡 Note: Liquidity Trap Zones works best when combined with traditional support/resistance analysis and volume profile indicators. The zones highlight areas of deceptive liquidity but should not be the sole factor in trading decisions. Always use proper risk management and confirm signals with price action.
THF Crossover and Trend Signals Golden & Death Cross with VolumeScript Overview:
This Pine Script is designed to assist traders in identifying key buy/sell signals and major trend changes on the chart using Exponential Moving Averages (EMA) and Simple Moving Averages (SMA), as well as visualizing Golden Cross and Death Cross events. The script also includes a volume indicator to highlight the volume trading activity in relation to the price movements.
Key Features:
1. Moving Averages:
EMA 21: Exponential Moving Average over a 21-period, shown in green.
EMA 50: Exponential Moving Average over a 50-period, shown in yellow.
SMA 50: Simple Moving Average over a 50-period, shown in red.
SMA 200: Simple Moving Average over a 200-period, shown in blue.
2. Signals:
Buy Signal: Generated when EMA 21 crosses above SMA 50, indicating a potential upward trend. Displayed with a green label below the price bar.
Sell Signal: Generated when EMA 21 crosses below SMA 50, indicating a potential downward trend. Displayed with a red label above the price bar.
3. Golden Cross (Bullish Trend):
A Golden Cross occurs when EMA 50 crosses above SMA 200, which often signals the start of a long-term upward trend. The signal is displayed with a yellow label below the price bar.
4. Death Cross (Bearish Trend):
A Death Cross occurs when EMA 50 crosses below SMA 200, which often signals the start of a long-term downward trend. The signal is displayed with a blue label above the price bar.
5. Volume Indicator:
The volume is plotted as colored columns. Green indicates higher volume than the 20-period moving average, and red indicates lower volume.
A Volume Moving Average (SMA 20) is also plotted to compare volume changes over time.
How the Script Works:
1. The EMA and SMA lines are plotted on the chart, providing a visual representation of the short- and long-term trends.
2. Buy/Sell signals are triggered based on the crossover between EMA 21 and SMA 50, helping to identify potential entry and exit points.
3. The Golden Cross and Death Cross indicators highlight major trend reversals based on the crossover between EMA 50 and SMA 200, providing clear visual cues for long-term trend changes.
4. Volume is displayed alongside price movements, offering insight into the strength or weakness of a trend.
Key Customizations:
Moving Average Periods: Users can modify the lengths of the EMAs and SMAs for customized analysis.
Volume Moving Average Period: The script allows for adjustment of the volume moving average period to suit different market conditions.
Signal Visibility: The size and color of the buy, sell, Golden Cross, and Death Cross signals can be easily customized to make them more prominent on the chart.
Conclusion:
This script is ideal for traders looking to combine price action with volume analysis, using key technical indicators such as EMA, SMA, Golden Cross, and Death Cross to make informed decisions in trending markets.
---
This explanation covers all aspects of the script and provides a clear understanding of its functionality, which is helpful for sharing the script or using it as an educational resource.

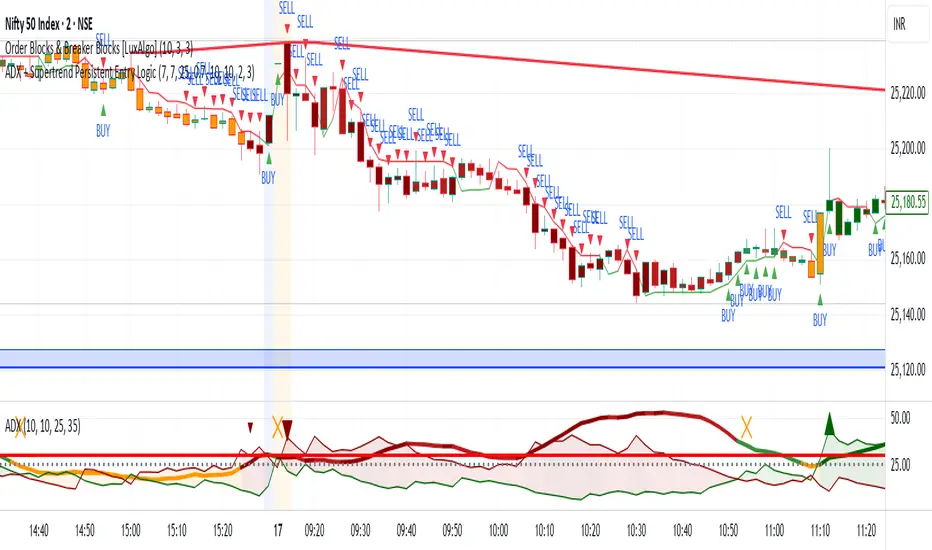
ADX + Supertrend Persistent Entry Logicbuy condition should match below condition below
ADX DI plus should above of DI minuse
Supertrend should be bullish
ADX should be above 25
Price should not have order block resistance
Exit from buy when supertrend change trend
Sell condition should match below condition below
ADX DI plus should below of DI minuse
Supertrend should be bearish
ADX should be above 25
Price should not have order block support
Exit from Sell when supertrend change trend
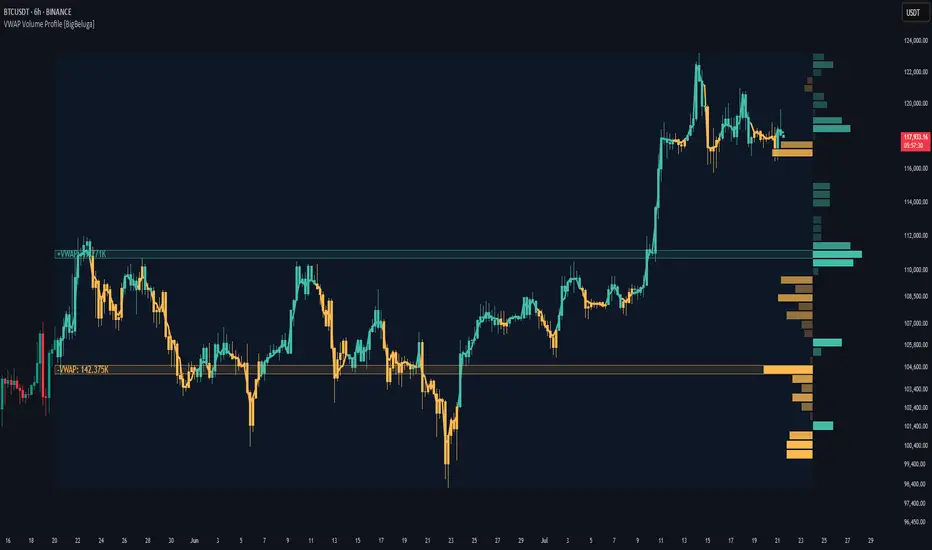
VWAP Volume Profile [BigBeluga]🔵 OVERVIEW
VWAP Volume Profile is an advanced hybrid of the VWAP and volume profile concepts. It visualizes how volume accumulates relative to VWAP movement—separating rising (+VWAP) and declining (−VWAP) activity into two mirrored horizontal profiles. It highlights the dominant price bins (POCs) where volume peaked during each directional phase, helping traders spot hidden accumulation or distribution zones.
🔵 CONCEPTS
VWAP-Driven Profiling: Unlike standard volume profiles, this tool segments volume based on VWAP movement—accumulating positive or negative volume depending on VWAP slope.
Dual-Sided Profiles: Profiles expand horizontally to the right of price. Separate bins show rising (+) and falling (−) VWAP volume.
Bin Logic: Volume is accumulated into defined horizontal bins based on VWAP’s position relative to price ranges.
Gradient Coloring: Volume bars are colored with a dynamic gradient to emphasize intensity and direction.
POC Highlighting: The highest-volume bin in each profile type (+/-) is marked with a transparent box and label.
Contextual VWAP Line: VWAP is plotted and dynamically colored (green = rising, orange = falling) for instant trend context.
Candle Overlay: Price candles are recolored to match the VWAP slope for full visual integration.
🔵 FEATURES
Dual-sided horizontal volume profiles based on VWAP slope.
Supports rising VWAP , falling VWAP , or both simultaneously.
Customizable number of bins and lookback period.
Dynamically colored VWAP line to show rising/falling bias.
POC detection and labeling with volume values for +VWAP and −VWAP.
Candlesticks are recolored to match VWAP bias for intuitive momentum tracking.
Optional background boxes with customizable styling.
Adaptive volume scaling to normalize bar length across markets.
🔵 HOW TO USE
Use POC zones to identify high-volume consolidation areas and potential support/resistance levels.
Watch for shifts in VWAP direction and observe how volume builds differently during uptrends and downtrends.
Use the gradient profile shape to detect accumulation (widening volume below price) or distribution (above price).
Use candle coloring for real-time confirmation of VWAP bias.
Adjust the profile period or bin count to fit your trading style (e.g., intraday scalping or swing trading).
🔵 CONCLUSION
VWAP Volume Profile merges two essential concepts—volume and VWAP—into a single, high-precision tool. By visualizing how volume behaves in relation to VWAP movement, it uncovers hidden dynamics often missed by traditional profiles. Perfect for intraday and swing traders who want a more nuanced read on market structure, trend strength, and volume flow.
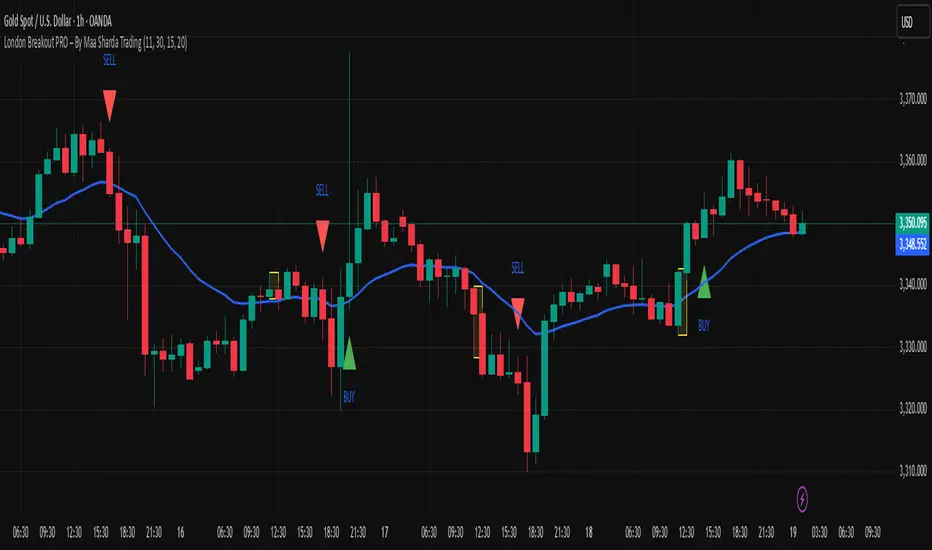
London Breakout PRO – By Maa Sharda Trading📈 London Breakout PRO (MAA SHARDA TRADING) – Indicator Description for TradingView
Introducing: London Breakout PRO – The Advanced Breakout Tool for Gold & Forex!
Unlock the real power of London session trading with this next-generation indicator.
Specially designed for serious traders, this tool combines classic London Breakout logic with EMA Trend Confirmation and an optional Volume Filter to eliminate fake breakouts and boost your accuracy.
How It Works:
Session Box: Automatically marks the first session candle (default: 1H for London Open).
Breakout Signal: Gives only one clean BUY/SELL signal each day – only when the candle breaks out above/below the session box.
Trend Filter: Signals fire only when price is above (BUY) or below (SELL) the EMA 20, ensuring you always trade with the trend.
Volume Confirmation: (Optional) Signals only if breakout happens with volume higher than the last 10 candles’ average, so you avoid low-liquidity fakeouts.
Ultra-Clean Chart: No repainting, no clutter, just pure breakout action.
Key Features:
✅ Works on any timeframe (M15, M30, H1 best for Gold/XAUUSD & FX)
✅ Fully customizable session start time and box duration
✅ One breakout signal per day – no overtrading, no noise
✅ Trend & volume filters for high-probability setups
✅ Easy visual backtesting – perfect for serious traders and strategy builders
Recommended Settings for GOLD (XAUUSD):
Timeframe: 1 Hour (H1) – best accuracy & lowest noise
Session Start (IST): 11:30 AM (London Open)
Box Length: 1 Candle (1 Hour)
EMA Length: 20
Volume Filter: On (for strong confirmations)
How To Use:
Wait for London session box to form at your set time.
Trade only when price closes above (BUY) or below (SELL) the box and EMA 20 & volume filters are satisfied.
Place SL at the opposite side of the box. Target 1:1 or let profits run with trailing stop.
Avoid trading during high-impact news events for even better results.
Pro Tip:
Backtest on H1 and combine with major support/resistance for the highest win-rate. Use with proper risk management for best results!
Disclaimer:
Trading involves risk. This indicator is for educational purposes only. Test thoroughly before live trading.
#LondonBreakout #XAUUSD #BreakoutStrategy #EMAConfirmation #VolumeFilter #TradingView #ForexIndicator #IntradayTrading
Big Trade % Heatmap### Big Trade % Heatmap
**Quick overview**
This indicator highlights where “whale” activity is clustered by showing what fraction of the recent candles contained *large‑value trades*. A candle is considered “big” when its notional volume (`volume × close`) exceeds your chosen USD threshold. You instantly see:
* **Percent of big candles** in the last *N* bars, refreshed at the cadence you pick.
* **On‑chart labels & markers** every refresh, so the chart stays clean.
* **Optional heat‑map background** that turns orange (>20 %) or green (>50 %) when big‑trade concentration spikes.
* **Ready‑made alert** when big‑trade dominance crosses 50 %.
---
#### How it works
1. **Trade size per candle** – Calculates `close × volume` to estimate dollars traded.
2. **Threshold filter** – Flags candles whose value is above *Big Trade Threshold (\$)*.
3. **Look‑back window** – Counts what percentage of the last *Lookback Window (X Candles)* were “big.”
4. **Refresh interval** – Repeats the measurement only every *Refresh Interval (Every X Candles)* to avoid label spam.
5. **Visuals** –
* A small blue ▼ above the bar + a text label such as `35.00 % > $25 000`.
* Background shading (green/orange) for quick, at‑a‑glance sentiment.
---
#### Inputs
| Input | Purpose | Default |
| -------------------------------------- | ----------------------------------------------------- | ------- |
| **Lookback Window (X Candles)** | How many recent bars to sample for the % calculation. | 20 |
| **Refresh Interval (Every X Candles)** | How often to display a new label/marker. | 5 |
| **Big Trade Threshold (\$)** | Minimum USD value for a candle to count as “big.” | 10 000 |
Tune these to the symbol and timeframe you trade (e.g., raise the threshold for BTC‑USDT 1‑h, lower it for micro‑caps).
---
#### Alerts
Enable **“High Big Trade %”** to get notified the moment more than half of the last *N* candles qualify as big trades—handy for spotting sudden accumulation or distribution.
---
#### Typical use cases
* **Breakout confirmation** – A surge in big‑trade % just before price escapes a range can validate the move.
* **Whale spotting** – Detect hidden accumulation on pullbacks or aggressive selling into rallies.
* **Filter noise** – Combine with your favorite trend indicator; only act when both align.
---
> *Built with Pine Script v6. Always back‑test before trading live; this tool is for educational purposes and not financial advice.*

Confluence AVWAP Breakout RibbonThis advanced indicator overlays up to five Anchored VWAPs—Daily Session, Weekly, Monthly, Prior Swing High, and Prior Swing Low—directly onto your chart. It highlights a "confluence ribbon" between these levels, visually mapping the real-time price zone where institutional activity may cluster. The ribbon is colored dynamically so you can instantly spot which side of value price is breaking towards.
How it works:
• The script automatically recalculates each selected VWAP anchor in real time.
• For swing-high and swing-low anchors, it starts a new VWAP every time a new price swing is confirmed.
• You can enable or disable any anchor via the script’s Inputs panel to suit your trading style or asset.
Entry Signals:
• A long breakout (green up-arrow) triggers only on the first candle that closes above all active VWAP anchors.
• A short breakout (red down-arrow) triggers only on the first close below all active anchors.
• These signals help confirm when price makes a decisive move out of a key value zone, filtering out false or weak breakouts.
How to use:
Add the indicator to any chart or timeframe.
In the Inputs, choose which VWAP anchors to activate.
Watch for the ribbon color and width: a wider ribbon means more confluence between price zones.
Trade signals (arrows) are only painted on the first candle to break out above or below all anchors, making them easy to see and avoiding repaint.
Optional: Set up alerts using the built-in TradingView alerts for each breakout direction.
Customization:
• Toggle each anchor on/off for your preferred strategy.
• Adjust the swing length for pivots.
• Change ribbon opacity for better chart visibility.
Why it’s unique:
• Most VWAP scripts only plot a single line, or show basic session anchors.
• This indicator lets you stack up to five important VWAP anchors and requires consensus: price must clear all active anchors in one move to signal a breakout.
• The live ribbon and dynamic visuals provide clear confluence zones and breakout cues that go beyond traditional VWAP use.
Best practices:
• Works well on all major assets (stocks, crypto, FX, indices) and all chart timeframes.
• For highest reliability, use two or more anchors at a time.
• Consider using alongside your preferred trend or volatility filter.
For educational and research purposes only. This is not financial advice or a recommendation to buy or sell. Always use proper risk management and test before live trading.

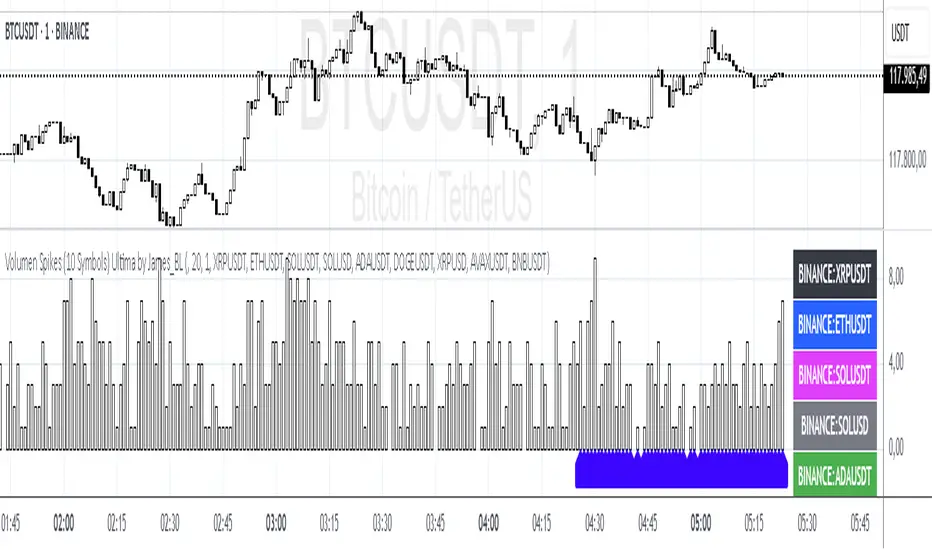
Volumen Spike Übersicht (10 Symbole) Ultima by James_BLThe script checks up to 10 volume sources simultaneously to see if they are above average.
There is also a volume spike factor that allows you to specify the strength compared to the average.
It supports alerts for each individual volume or for any one out of ten, which minimizes the limited number of available alerts.
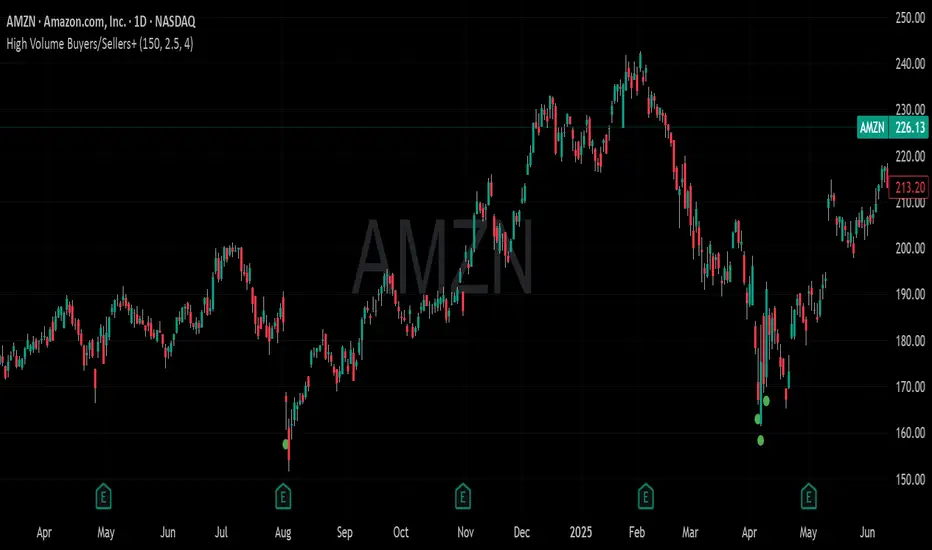
High Volume Buyers/Sellers+High Volume Buyers/Sellers+
This indicator helps traders spot bars where unusually high or extreme volume occurs, indicating strong buying or selling pressure.
How it works:
Calculates a volume moving average (SMA) over a user-defined period.
Marks bars where the current volume exceeds:
High Volume Multiplier → small green circle (bullish) or red circle (bearish).
Extreme Volume Multiplier → small green up-triangle (bullish) or red down-triangle (bearish).
Settings:
Volume MA Period → Number of bars used to calculate the average volume.
High Volume Multiplier → Threshold to define high volume.
Extreme Volume Multiplier → Threshold to define extreme volume.
Show Extreme Volume Signals → Option to enable or disable extreme volume markers.
Usage tips:
Apply this indicator on a clean chart to visually highlight momentum bursts or exhaustion points.
It works well for both intraday and swing trading strategies where volume confirmation matters.
⚠ Note: This script only displays on-chart markers and does not plot any lines or indicators.
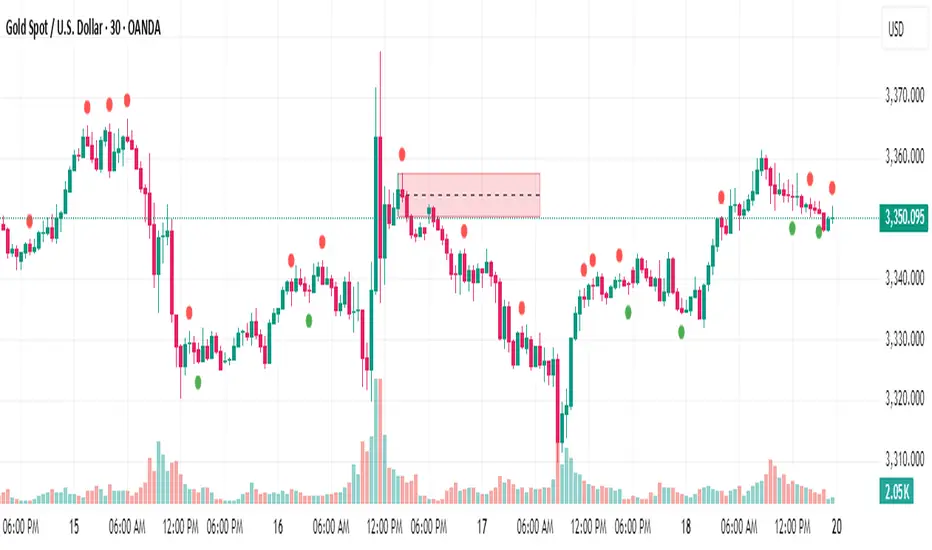
No Supply No Demand (NSND) – Volume Spread Analysis ToolThis indicator is designed for traders utilizing Volume Spread Analysis (VSA) techniques. It automatically detects potential No Demand (ND) and No Supply (NS) candles based on volume and price behavior, and confirms them using future price action within a user-defined number of lookahead bars.
Confirmed No Demand (ND): Detected when a bullish candle has volume lower than the previous two bars and is followed by weakness (next highs swept, close below).
Confirmed No Supply (NS): Detected when a bearish candle has volume lower than the previous two bars and is followed by strength (next lows swept, close above).
Adjustable lookahead bars parameter to control the confirmation window.
This tool helps identify potential distribution (ND) and accumulation (NS) areas, providing early signs of market turning points based on professional volume logic. The dot appears next to ND or NS.
Volume Peak LineA fully configurable “Volume Peak Line” indicator that draws a horizontal threshold at the highest volume over the last X candles (default 5).
Custom lookback (X volume candles)
Optional alert when current volume exceeds that peak
Separate up/down volume bars (green/red) or hide them to use your own volume overlays
Use it to spot surges in trading activity on any timeframe—ideal for intraday or swing setups where a barn-burner volume bar can signal a reversal or the start of a new trend.
