ATAI Triangles — Volume-Based & Price Pattern Analysis (v1.01)ATAI Triangles — Volume-Based & Price Pattern Analysis (v1.01)
Overview
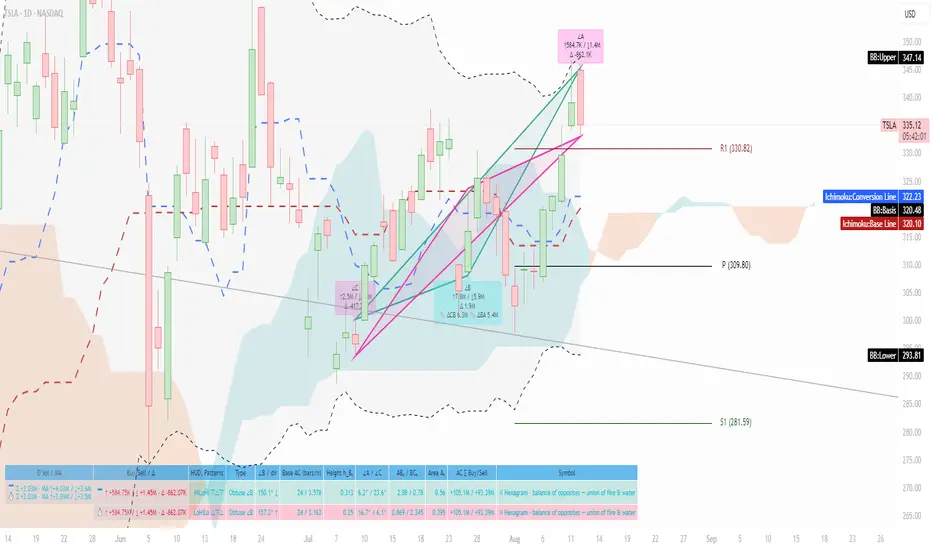
ATAI Triangles identifies two synchronized triangle structures — Hi-Lo-Hi (HLH) and Lo-Hi-Lo (LHL) — and analyzes them both geometrically and volumetrically. For each triangle, volume is split between its two legs (segments), providing interpretable insights into buyer vs seller activity along each path.
The idea is that certain geometric shapes, when paired with volume distribution on each leg, can reveal patterns worth exploring. Users are encouraged to share their observations and interpretations in the TradingView comments section so that more aspects of these triangle combinations can be discovered collectively.
Extra (for fun)
For a bit of entertainment, we’ve included a symbolic “hexagram” glyph that appears when both triangle types align in a particular way — it’s just a visual nod to geometry and has no predictive or trading value.
Interface & data clarity
- Inputs and parameters are organized by function (pattern geometry, volume analysis, visuals, HUD, labels).
- Each input includes tooltips explaining its purpose, units, and possible effects on calculations.
- All on-chart objects (polylines, labels, connectors) are named and colored to reflect their role, with volume values formatted in engineering notation (K, M, B).
- HUD columns and label texts use concise terms and consistent units, so that every displayed value is directly traceable to a calculation in the code.
- Daily and lower-timeframe volume series are clearly separated, with update logic documented to indicate intrabar provisional values vs finalized bar-close values.
Usage notes
Designed to be used alongside other indicators and chart tools for context; it is not a standalone signal generator.
All Buy/Sell volumes are absolute (non-negative); Δ = Buy − Sell.
Intrabar values update live and finalize at bar close (no repaint after close).
Disclaimer
For research, discussion, and educational purposes only. This is not financial advice and does not guarantee any outcome. Trade at your own risk.
Wealthcreator
Volume Based Analysis V 1.00
Volume Based Analysis V1.00 – Multi-Scenario Buyer/Seller Power & Volume Pressure Indicator
Description:
1. Overview
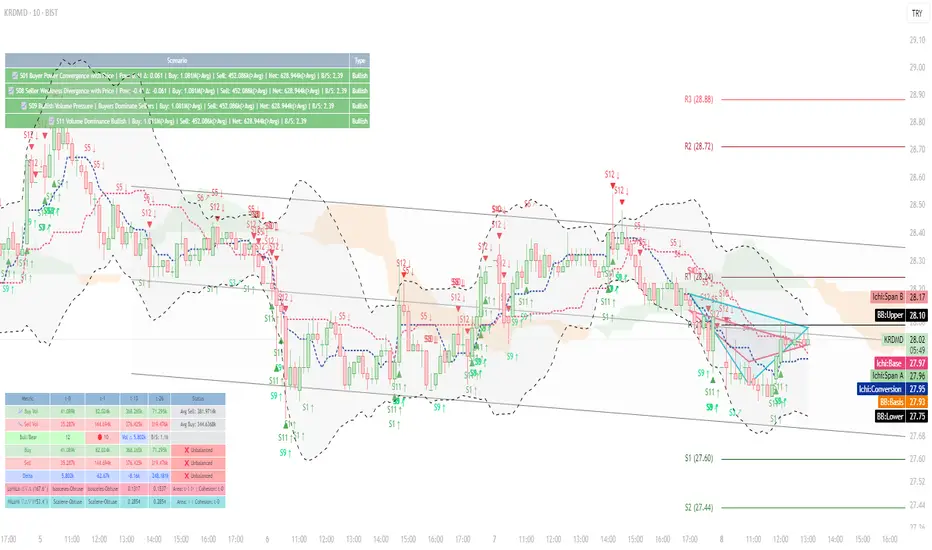
The Volume Based Analysis V1.00 indicator is a comprehensive tool for analyzing market dynamics using Buyer Power, Seller Power, and Volume Pressure scenarios. It detects 12 configurable scenarios combining volume-based calculations with price action to highlight potential bullish or bearish conditions.
When used in conjunction with other technical tools such as Ichimoku, Bollinger Bands, and trendline analysis, traders can gain a deeper and more reliable understanding of the market context surrounding each signal.
2. Key Features
12 Configurable Scenarios covering Buyer/Seller Power convergence, divergence, and dominance
Advanced Volume Pressure Analysis detecting when both buy/sell volumes exceed averages
Global Lookback System ensuring consistency across all calculations
Dominance Peak Module for identifying strongest buyer/seller dominance at structural pivots
Real-time Signal Statistics Table showing bullish/bearish counts and volume metrics
Fully customizable inputs (SMA lengths, multipliers, timeframes)
Visual chart markers (S01 to S12) for clear on-chart identification
3. Usage Guide
Enable/Disable Scenarios: Choose which signals to display based on your trading strategy
Fine-tune Parameters: Adjust SMA lengths, multipliers, and lookback periods to fit your market and timeframe
Timeframe Control: Use custom lower timeframes for refined up/down volume calculations
Combine with Other Indicators:
Ichimoku: Confirm volume-based bullish signals with cloud breakouts or trend confirmation
Bollinger Bands: Validate divergence/convergence signals with overbought/oversold zones
Trendlines: Spot high-probability signals at breakout or retest points
Signal Tables & Peaks: Read buy/sell volume dominance at a glance, and activate the Dominance Peak Module to highlight key turning points.
4. Example Scenarios & Suggested Images
Image #1 – S01 Bullish Convergence Above Zero
S01 activated, Buyer Power > 0, both buyer power slope & price slope positive, above-average buy volume. Show S01 ↑ marker below bar.
Image #2 – Combined with Ichimoku
Display a bullish scenario where price breaks above Ichimoku cloud while S01 or S09 bullish signal is active. Highlight both the volume-based marker and Ichimoku cloud breakout.
Image #3 – Combined with Bollinger Bands & Trendlines
Show a bearish S10 signal at the upper Bollinger Band near a descending trendline resistance. Highlight the confluence of the volume pressure signal with the band touch and trendline rejection.
Image #4 – Dominance Peak Module
Pivot low with green ▲ Bull Peak and pivot high with red ▼ Bear Peak, showing strong dominance counts.
Image #5 – Statistics Table in Action
Bottom-left table showing buy/sell volume, averages, and bullish/bearish counts during an active market phase.
5. Feedback & Collaboration
Your feedback and suggestions are welcome — they help improve and refine this system. If you discover interesting use cases or have ideas for new features, please share them in the script’s comments section on TradingView.
6. Disclaimer
This script is for educational purposes only. It is not financial advice. Past performance does not guarantee future results. Always do your own analysis before making trading decisions.
Tip: Use this tool alongside trend confirmation indicators for the most robust signal interpretation.