• Products
  • Community
  • Markets
  • Brokers
  • More
Get started
  • Community
  • /Indicators and strategies
  • /Weeklies

Weeklies

Double Basics - Identify Overbought & Oversold - MultitimeframeI believe that everyone should monitor the basic indicators; EMA/SMA cross, BB and RSI on at least TWO timeframes before making any trading decisions. And because that is only possible on paid subscriptions, I created this indicator for people just getting started. It allows you to plot all of the mentioned AND 2 weeklies of your choice on 1 chart INCLUDING a higher timeframe, using only 1 indicator. 
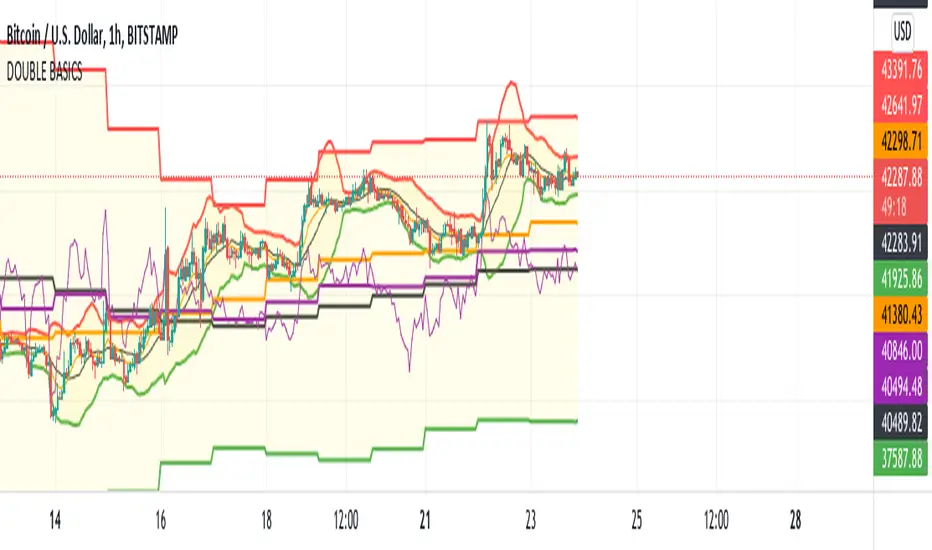
The EMA's are plotted as ORANGE and the SMA's as BLACK, you can distinguish them by the line size, thin is current chart, thick is higher timeframe. Same for the Bollinger Bands, Upper lines are red (overbought = sell signal) and bottom lines are green (oversold = buy signal) The RSI, normally plotted in its own window, are plotted on the scale of the BB of the 2nd timeframe, where the bottom line = 0, upper line = 100 and middle (think black) line = 50. The thin purple line is the RSI of the chart resolution, the thicker purple line is the RSI of the 2nd timeframe. Finally, the two weeklies are plotted as thick black lines. Enjoy, and let me know your feedback!
Pine Script® indicator
by ParrotTrading
11

Select market data provided by ICE Data services. Select reference data provided by FactSet. Copyright © 2025 FactSet Research Systems Inc.© 2025 TradingView, Inc.

More than a product
  • Supercharts
Screeners
  • Stocks
  • ETFs
  • Bonds
  • Crypto coins
  • CEX pairs
  • DEX pairs
  • Pine
Heatmaps
  • Stocks
  • ETFs
  • Crypto
Calendars
  • Economic
  • Earnings
  • Dividends
More products
  • Yield curves
  • Options
  • News Flow
  • Pine Script®
Apps
  • Mobile
  • Desktop
Community
  • Social network
  • Wall of Love
  • Refer a friend
  • House Rules
  • Moderators
Ideas
  • Trading
  • Education
  • Editors' picks
Pine Script
  • Indicators & strategies
  • Wizards
  • Freelancers
Tools & subscriptions
  • Features
  • Pricing
  • Market data
Trading
  • Overview
  • Brokers
Special offers
  • CME Group futures
  • Eurex futures
  • US stocks bundle
About company
  • Who we are
  • Manifesto
  • Athletes
  • Blog
  • Careers
  • Media kit
Merch
  • TradingView store
  • Tarot cards for traders
  • The C63 TradeTime
Policies & security
  • Terms of Use
  • Disclaimer
  • Privacy Policy
  • Cookies Policy
  • Accessibility Statement
  • Security vulnerability
  • Status page
Business solutions
  • Widgets
  • Charting libraries
  • Lightweight Charts™
  • Advanced Charts
  • Trading Platform
Growth opportunities
  • Advertising
  • Brokerage integration
  • Partner program
  • Education program
Community
  • Social network
  • Wall of Love
  • Refer a friend
  • House Rules
  • Moderators
Ideas
  • Trading
  • Education
  • Editors' picks
Pine Script
  • Indicators & strategies
  • Wizards
  • Freelancers
Business solutions
  • Widgets
  • Charting libraries
  • Lightweight Charts™
  • Advanced Charts
  • Trading Platform
Growth opportunities
  • Advertising
  • Brokerage integration
  • Partner program
  • Education program
Look FirstLook First