Williams BBDiv Signal [trade_lexx]📈 Williams BBDiv Signal — Improve your trading strategy with accurate signals!
Introducing Williams BBDiv Signal , an advanced trading indicator designed for a comprehensive analysis of market conditions. This indicator combines Williams%R with Bollinger Bands, providing traders with a powerful tool for generating buy and sell signals, as well as detecting divergences. It is ideal for traders who need an advantage in detecting changing trends and market conditions.
🔍 How signals work
— A buy signal is generated when the Williams %R line crosses the lower Bollinger Bands band from bottom to top. This indicates that the market may be oversold and ready for a rebound. They are displayed as green triangles located under the Williams %R graph. On the main chart, buy signals are displayed as green triangles labeled "Buy" under candlesticks.
— A sell signal is generated when the Williams %R line crosses the upper Bollinger Bands band from top to bottom. This indicates that the market may be overbought and ready for a correction. They are displayed as red triangles located above the Williams %R chart. On the main chart, the sell signals are displayed as red triangles with the word "Sell" above the candlesticks.
— Minimum Bars Between Signals
The user can adjust the minimum number of bars between the signals to avoid false signals. This helps to filter out noise and improve signal quality.
— Mode "Wait for Opposite Signal"
In this mode, buy and sell signals are generated only after receiving the opposite signal. This adds an additional level of filtering and helps to avoid false alarms.
— Mode "Overbought and Oversold Zones"
A buy signal is generated only when Williams %R is below the -80 level (Lower Band). A sell signal is generated only when Williams %R is above -20 (Upper Band).
📊 Divergences
— Bullish divergence occurs when Williams%R shows a higher low while price shows a lower low. This indicates a possible upward reversal. They are displayed as green lines and labels labeled "Bull" on the Williams %R chart. On the main chart, bullish divergences are displayed as green triangles labeled "Bull" under candlesticks.
— A bearish divergence occurs when Williams %R shows a lower high, while the price shows a higher high. This indicates a possible downward reversal. They are displayed as red lines and labels labeled "Bear" on the Williams %R chart. On the main chart, bearish divergences are displayed as red triangles with the word "Bear" above the candlesticks.
— 🔌Connector Signal🔌 and 🔌Connector Divergence🔌
It allows you to connect the indicator to trading strategies and test signals throughout the trading history. This makes the indicator an even more powerful tool for traders who want to test the effectiveness of their strategies on historical data.
🔔 Alerts
The indicator provides the ability to set up alerts for buy and sell signals, as well as for divergences. This allows traders to keep abreast of important market developments without having to constantly monitor the chart.
🎨 Customizable Appearance
Customize the appearance of Williams BBDiv Signal according to your preferences to make the analysis more convenient and visually pleasing. In the indicator settings section, you can change the colors of the buy and sell signals, as well as divergences, so that they stand out on the chart and are easily visible.
🔧 How it works
— The indicator starts by calculating the Williams %R and Bollinger Bands values for a certain period to assess market conditions. Initial assumptions are introduced for overbought and oversold levels, as well as for the standard deviation of the Bollinger Bands. The indicator then analyzes these values to generate buy and sell signals. This classification helps to determine the appropriate level of volatility for signal calculation. As the market evolves, the indicator dynamically adjusts, providing information about the trend and volatility in real time.
Quick Guide to Using Williams BBDiv Signal
— Add the indicator to your favorites by clicking on the star icon. Adjust the parameters, such as the period length for Williams %R, the type of moving average and the standard deviation for Bollinger Bands, according to your trading style. Or leave all the default settings.
— Adjust the signal filters to improve the quality of the signals and avoid false alarms, adjust the filters in the "Signal Settings" section.
— Turn on alerts so that you don't miss important trading opportunities and don't constantly sit at the chart, set up alerts for buy and sell signals, as well as for divergences. This will allow you to keep abreast of all key market developments and respond to them in a timely manner, without being distracted from other business.
— Use signals. They will help you determine the optimal entry and exit points for your positions. Also, pay attention to bullish and bearish divergences, which may indicate possible market reversals and provide additional trading opportunities.
— Use the 🔌Connector🔌 for deeper analysis and verification of the effectiveness of signals, connect it to your trading strategies. This will allow you to test signals throughout the trading history and evaluate their accuracy based on historical data. Include the indicator in your trading strategy and run testing to see how buy and sell signals have worked in the past. Analyze the test results to determine how reliable the signals are and how they can improve your trading strategy. This will help you make better informed decisions and increase your trading efficiency.
Williamspercentrange

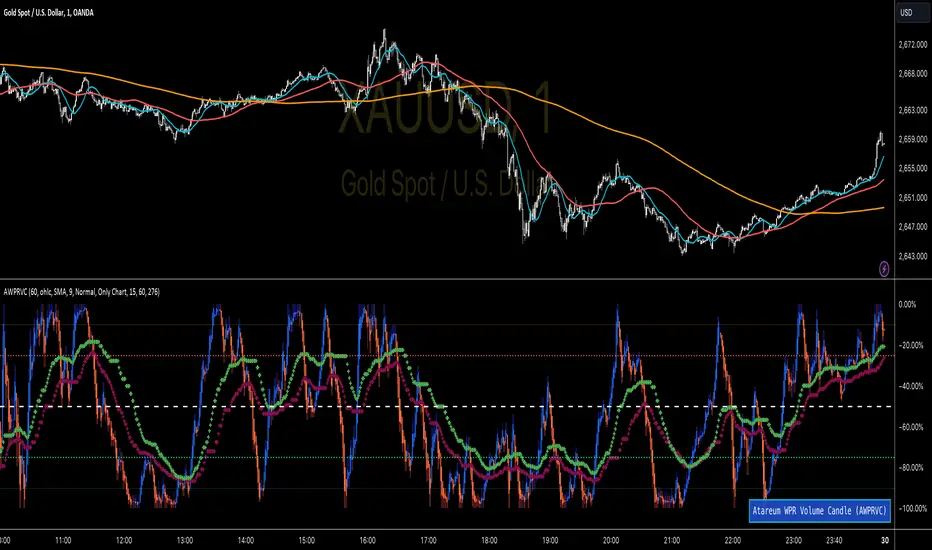
WPR Volume Candle [Atareum]AWPRVC (Atareum WPR Volume Candles) is clearly an awesome indicator produced by AtareumFX that is based on William’s Percent Range concepts by combination with volume. This is a new approach of volume candles that is combined with R% concepts and creates such a powerful tool to trace the market and assists traders to make better decisions surly and so much accurate. You can find this new indicator more useful because it has all benefits and advantages of William’s R% and cover its disadvantages. Also it is more powerful because of using volume in its calculations and generate a new candles which is more reliable and trustworthy.
Concept:
Using William’s Percent leading periods and calculations on redesigning new candles in combination with volume, that makes unique reform candles, but these new candles with their new cloud system clearly response to any reasonable price movement with so much information.
As you know if use R% there are some misleading fake signals generate by oscillator, also it could not show any sign of price moving trend which is almost confusing for beginners or even a pro trader! And finally this oscillator is so sensitive to price change that is so creepy to use for most of traders.
This new AWPRVC solve the problem and make all of them handy and useful for you.
The cloud system which is designed in AWPRVC shows the price trend moving from Bearish Zone (-100 to -50 percent) to Bullish Zone (-50 to 0 percent). You can trust the lead moving forward of the clouds in two separate Top and Bottom (Bull and Bear) lines which solely determine the trend and power of price moving. When clouds are close to each other means we continue the trend and when they get far away from each other means we will face powerful trend in near future. If they are in Bearish Zone we continue the selling pressure and vice versa. Following picture shows good sample of Long and Short positions in compare with so many fake signals generated on original R%.
Besides the cloud system of AWPRVC which is clearly show the price trend and it is completely enough for being sure about price moving trend, you can use moving average which is designated in it to confirm the price trend, also.
Also you can see this new AWPRVC candle by using volume within its conformation, make reasonable price candles which is no so sensitive and so creepy and make your decisions come true in peace and clear sense of market moves. You can see following picture which is showing although the real price candles are so unclear and nonsense of making decision but the AWPRVC candles lead you to make true and trustable position.
As you see this new combination of Williams R% oscillator with volume and also generating a perfect new cloud system will clearly help traders even pro to trust the signals and understand whole market movement better and all of original problems of R% solved and even make a most powerful, trustworthy and useful new indicator.
Parameters:
Section 1 : Candle colour setting for flourishing just as you desire !
Section 2 : Defining Periods of R% and source of candle data in combination with determining the smoothing type of moving averages and signal period.
Section 3 : Select using Standard candles alongside with redesigned cloud calculation type and three additional moving averages which can plot on each newly generated candles and standard candles on a chart with the type mode defined in the previous section.
Note: if you want to omit any or all of these moving averages, you can use 0 in period, instead of selecting "None" in the plot moving option!
Usage :
Overall:
Regardless of the additional moving averages which will lead to so many situations of market according to their types and designs, that is four different period for new redesign AWPRVC and three period for standard chart. You can easily select periods and type for these moving averages. Also, do not forget that signal moving averages is shown only on AWPRVC chart and have two different colour for upward and downward trends. Other moving averages are plot by just one single colour.
Cloud levels are so important because AWPRVC candles show respect to them and when they break the clouds upward or downward it is surly beginning of a trend. Do not forget we have 5 levels for tracing new AWPRVC candles move as follows : Ready for Short \ Long, Surly Short \ Long and Turn Trend which is in middle range of movement percent. Each level clearly shows what it means by its name.
Support and Resistance:
Any consolidation of AWPRVC candles in Ready for Short or Long Zones means the support or resistance level due to its nature, but important thing is how long the candles lasts in there or how many times repeated in the same level in AWPRVC chart zone in future.
For plotting the support or resistance you should trace range of AWPRVC candles consolidated and plot zone in standard chart candles just like following picture.
Divergence:
When standard price candles move downward but we see upward trend in clouds of AWPRVC candles that means we should face Bullish Trend because of the divergence and vice versa. You can see perfect example in following picture.
Signal:
Alert of Long :
Bullish candle cross both cloud down and up level simultaneously.
Confirmed Long :
AWPRVC candles cross up turn trend level and pullback to cloud up level.
Take profit of Long:
Any cross down of the AWPRVC candles from surly short level of chart.
Alert of Short :
Bearish candle cross both cloud up and down level simultaneously.
Confirmed Short :
AWPRVC candles cross down turn trend level and pullback to cloud down level.
Take profit of Short:
Any cross up of the AWPRVC candles from surly long level of chart.
Notes:
Use moving averages cross of standard chart candles as lead to be in positions more as they are good representative of trend.
As long as AWPRVC candles or Cloud levels are in Bullish Zone, you can stay in Long positions.
Cloud level thickness means the power of trend and can be use as confirmation of powerful trend, so when cloud levels tight or going to cross each other it means the trend is going to be reversed.
It is the result of many years of experience in markets and there are so many details about this AWPRVC chart which I am in the experiment phase to publish in the future, so please help me with your ideas and do not hesitate to comment and inform me any suggestions or criticism.
Williams %R OB/OS Candle Coloring### Description for TradingView Publication
**Title:** Williams %R OB/OS Candle Coloring
**Description:**
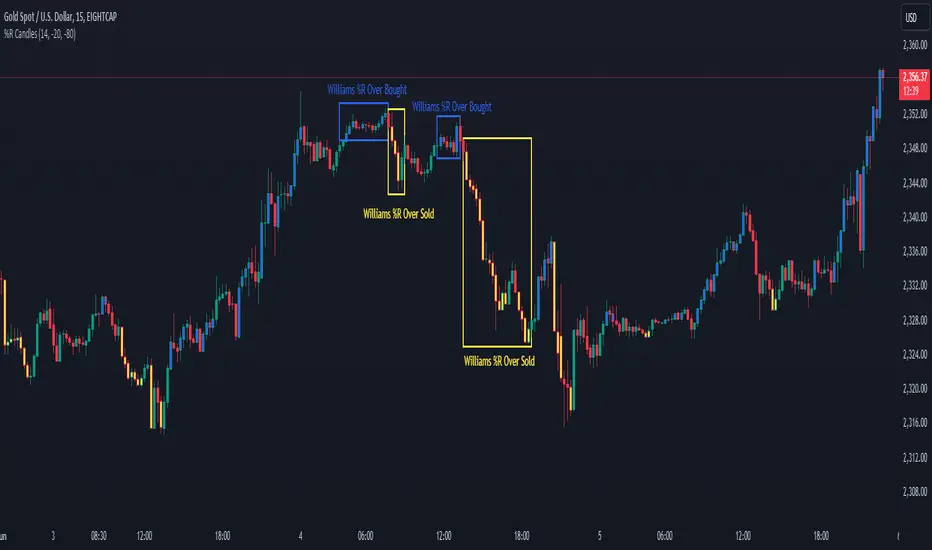
This Pine Script indicator enhances the visibility of market conditions by changing the color of the candlesticks based on the Williams %R values. It helps traders quickly identify overbought and oversold conditions without the need to display the Williams %R line or any additional bands.
**How It Works:**
- The script calculates the Williams %R value using a specified lookback period (default is 14 days).
- It then compares the Williams %R value against predefined overbought and oversold levels.
- **Overbought Condition:** When the Williams %R value is greater than the upper band level (-20 by default), the candlestick color changes to blue.
- **Oversold Condition:** When the Williams %R value is less than the lower band level (-80 by default), the candlestick color changes to yellow.
**How to Use:**
1. **Input Parameters:**
- **Length:** The lookback period for calculating Williams %R (default is 14).
- **Upper Band Level:** The threshold for overbought conditions (default is -20).
- **Lower Band Level:** The threshold for oversold conditions (default is -80).
2. **Candlestick Coloring:**
- Blue candles indicate potential overbought conditions.
- Yellow candles indicate potential oversold conditions.
This indicator is designed to provide a visual cue directly on the price chart, making it easier for traders to spot extreme market conditions at a glance.
**Concepts Underlying the Calculation:**
Williams %R, developed by Larry Williams, is a momentum indicator that measures overbought and oversold levels. It compares the current closing price to the highest high and lowest low over a specified period. By using color-coded candles, traders can quickly assess market conditions and make informed decisions without the need to interpret an additional indicator line.
This script is particularly useful for traders who prefer a clean chart but still want to leverage the insights provided by the Williams %R indicator.
---
### ภาษาไทย:
**คำอธิบาย:**
สคริปต์ Pine Script ตัวนี้ช่วยเพิ่มการมองเห็นสภาวะตลาดโดยการเปลี่ยนสีของแท่งเทียนตามค่าของ Williams %R ช่วยให้เทรดเดอร์สามารถระบุสภาวะการซื้อเกินและขายเกินได้อย่างรวดเร็วโดยไม่ต้องแสดงเส้น Williams %R หรือเส้นระดับเพิ่มเติมใดๆ
**วิธีการทำงาน:**
- สคริปต์คำนวณค่าของ Williams %R โดยใช้ช่วงเวลาที่กำหนด (เริ่มต้นที่ 14 วัน)
- จากนั้นเปรียบเทียบค่าของ Williams %R กับระดับการซื้อเกินและขายเกินที่กำหนดไว้
- **สภาวะการซื้อเกิน:** เมื่อค่าของ Williams %R มากกว่าระดับ Upper Band (-20 เริ่มต้น) สีของแท่งเทียนจะเปลี่ยนเป็นสีน้ำเงิน
- **สภาวะการขายเกิน:** เมื่อค่าของ Williams %R น้อยกว่าระดับ Lower Band (-80 เริ่มต้น) สีของแท่งเทียนจะเปลี่ยนเป็นสีเหลือง
**วิธีการใช้งาน:**
1. **ค่าพารามิเตอร์:**
- **Length:** ช่วงเวลาที่ใช้คำนวณ Williams %R (เริ่มต้นที่ 14)
- **Upper Band Level:** ระดับการซื้อเกิน (เริ่มต้นที่ -20)
- **Lower Band Level:** ระดับการขายเกิน (เริ่มต้นที่ -80)
2. **การเปลี่ยนสีแท่งเทียน:**
- แท่งเทียนสีน้ำเงินระบุถึงสภาวะการซื้อเกิน
- แท่งเทียนสีเหลืองระบุถึงสภาวะการขายเกิน
อินดิเคเตอร์นี้ถูกออกแบบมาเพื่อให้สัญญาณภาพตรงบนกราฟราคาช่วยให้เทรดเดอร์สามารถมองเห็นสภาวะตลาดได้อย่างชัดเจนและทำการตัดสินใจได้ง่ายขึ้น
**แนวคิดที่อยู่เบื้องหลังการคำนวณ:**
Williams %R ที่พัฒนาโดย Larry Williams เป็นอินดิเคเตอร์โมเมนตัมที่วัดระดับการซื้อเกินและขายเกิน มันเปรียบเทียบราคาปิดปัจจุบันกับราคาสูงสุดและต่ำสุดในช่วงเวลาที่กำหนด โดยใช้แท่งเทียนที่มีการเปลี่ยนสี เทรดเดอร์สามารถประเมินสภาวะตลาดและทำการตัดสินใจได้อย่างรวดเร็วโดยไม่ต้องตีความเส้นอินดิเคเตอร์เพิ่มเติม
สคริปต์นี้มีประโยชน์โดยเฉพาะสำหรับเทรดเดอร์ที่ต้องการกราฟที่สะอาดแต่ยังต้องการใช้ข้อมูลเชิงลึกจากอินดิเคเตอร์ Williams %R