Volatility-Enhanced Williams %R [AIBitcoinTrend]👽 Volatility-Enhanced Williams %R (AIBitcoinTrend)
The Volatility-Enhanced Williams %R takes the classic Williams %R oscillator to the next level by incorporating volatility-adaptive smoothing, making it significantly more responsive to market dynamics. Unlike the traditional version, which uses a fixed calculation method, this indicator dynamically adjusts its smoothing factor based on market volatility, helping traders capture trends more effectively while filtering out noise.
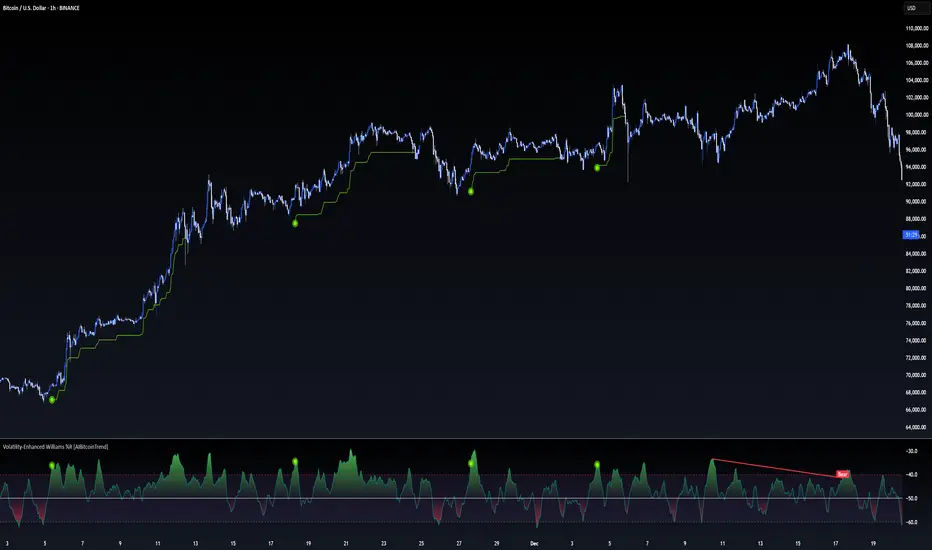
Additionally, the indicator includes real-time divergence detection and an ATR-based trailing stop system, providing traders with enhanced risk management tools and early reversal signals.
👽 What Makes the Volatility-Enhanced Williams %R Unique?
Unlike the standard Williams %R, which applies a simple lookback-based formula, this version integrates adaptive smoothing and volatility-based filtering to refine its signals and reduce false breakouts.
✅ Volatility-Adaptive Smoothing – Adjusts dynamically based on standard deviation, enhancing signal accuracy.
✅ Real-Time Divergence Detection – Identifies bullish and bearish divergences for early trend reversal signals.
✅ Crossovers & Trailing Stops – Implements Williams %R crossovers with ATR-based trailing stops for intelligent trade management.
👽 The Math Behind the Indicator
👾 Volatility-Adaptive Smoothing
The indicator smooths the Williams %R calculation by applying an adaptive filtering mechanism, which adjusts its responsiveness based on market conditions. This helps to eliminate whipsaws and makes trend-following strategies more reliable.
The smoothing function is defined as:
clamp(x, lo, hi) => math.min(math.max(x, lo), hi)
adaptive(src, prev, len, divisor, minAlpha, maxAlpha) =>
vol = ta.stdev(src, len)
alpha = clamp(vol / divisor, minAlpha, maxAlpha)
prev + alpha * (src - prev)
Where:
Volatility Factor (vol) measures price dispersion using standard deviation.
Adaptive Alpha (alpha) dynamically adjusts smoothing strength.
Clamped Output ensures that the smoothing factor remains within a stable range.
👽 How Traders Can Use This Indicator
👾 Divergence Trading Strategy
Bullish Divergence Setup:
Price makes a lower low, while Williams %R forms a higher low.
Buy signal is confirmed when Williams %R reverses upward.
Bearish Divergence Setup:
Price makes a higher high, while Williams %R forms a lower high.
Sell signal is confirmed when Williams %R reverses downward.
👾 Trailing Stop & Signal-Based Trading
Bullish Setup:
✅ Williams %R crosses above trigger level → Buy signal.
✅ A bullish trailing stop is placed at Low - (ATR × Multiplier).
✅ Exit if price crosses below the stop.
Bearish Setup:
✅ Williams %R crosses below trigger level → Sell signal.
✅ A bearish trailing stop is placed at High + (ATR × Multiplier).
✅ Exit if price crosses above the stop.
👽 Why It’s Useful for Traders
Adaptive Filtering Mechanism – Avoids excessive noise while maintaining responsiveness.
Real-Time Divergence Alerts – Helps traders anticipate market reversals before they occur.
ATR-Based Risk Management – Stops dynamically adjust based on market volatility.
Multi-Market Compatibility – Works effectively across stocks, forex, crypto, and futures.
👽 Indicator Settings
Smoothing Factor – Controls how aggressively the indicator adapts to volatility.
Enable Divergence Analysis – Activates real-time divergence detection.
Lookback Period – Defines the number of bars for detecting pivot points.
Enable Crosses Signals – Turns on Williams %R crossover-based trade signals.
ATR Multiplier – Adjusts trailing stop sensitivity.
Disclaimer: This indicator is designed for educational purposes and does not constitute financial advice. Please consult a qualified financial advisor before making investment decisions.
Williamsroscillator
Williams BBDiv Signal [trade_lexx]📈 Williams BBDiv Signal — Improve your trading strategy with accurate signals!
Introducing Williams BBDiv Signal , an advanced trading indicator designed for a comprehensive analysis of market conditions. This indicator combines Williams%R with Bollinger Bands, providing traders with a powerful tool for generating buy and sell signals, as well as detecting divergences. It is ideal for traders who need an advantage in detecting changing trends and market conditions.
🔍 How signals work
— A buy signal is generated when the Williams %R line crosses the lower Bollinger Bands band from bottom to top. This indicates that the market may be oversold and ready for a rebound. They are displayed as green triangles located under the Williams %R graph. On the main chart, buy signals are displayed as green triangles labeled "Buy" under candlesticks.
— A sell signal is generated when the Williams %R line crosses the upper Bollinger Bands band from top to bottom. This indicates that the market may be overbought and ready for a correction. They are displayed as red triangles located above the Williams %R chart. On the main chart, the sell signals are displayed as red triangles with the word "Sell" above the candlesticks.
— Minimum Bars Between Signals
The user can adjust the minimum number of bars between the signals to avoid false signals. This helps to filter out noise and improve signal quality.
— Mode "Wait for Opposite Signal"
In this mode, buy and sell signals are generated only after receiving the opposite signal. This adds an additional level of filtering and helps to avoid false alarms.
— Mode "Overbought and Oversold Zones"
A buy signal is generated only when Williams %R is below the -80 level (Lower Band). A sell signal is generated only when Williams %R is above -20 (Upper Band).
📊 Divergences
— Bullish divergence occurs when Williams%R shows a higher low while price shows a lower low. This indicates a possible upward reversal. They are displayed as green lines and labels labeled "Bull" on the Williams %R chart. On the main chart, bullish divergences are displayed as green triangles labeled "Bull" under candlesticks.
— A bearish divergence occurs when Williams %R shows a lower high, while the price shows a higher high. This indicates a possible downward reversal. They are displayed as red lines and labels labeled "Bear" on the Williams %R chart. On the main chart, bearish divergences are displayed as red triangles with the word "Bear" above the candlesticks.
— 🔌Connector Signal🔌 and 🔌Connector Divergence🔌
It allows you to connect the indicator to trading strategies and test signals throughout the trading history. This makes the indicator an even more powerful tool for traders who want to test the effectiveness of their strategies on historical data.
🔔 Alerts
The indicator provides the ability to set up alerts for buy and sell signals, as well as for divergences. This allows traders to keep abreast of important market developments without having to constantly monitor the chart.
🎨 Customizable Appearance
Customize the appearance of Williams BBDiv Signal according to your preferences to make the analysis more convenient and visually pleasing. In the indicator settings section, you can change the colors of the buy and sell signals, as well as divergences, so that they stand out on the chart and are easily visible.
🔧 How it works
— The indicator starts by calculating the Williams %R and Bollinger Bands values for a certain period to assess market conditions. Initial assumptions are introduced for overbought and oversold levels, as well as for the standard deviation of the Bollinger Bands. The indicator then analyzes these values to generate buy and sell signals. This classification helps to determine the appropriate level of volatility for signal calculation. As the market evolves, the indicator dynamically adjusts, providing information about the trend and volatility in real time.
Quick Guide to Using Williams BBDiv Signal
— Add the indicator to your favorites by clicking on the star icon. Adjust the parameters, such as the period length for Williams %R, the type of moving average and the standard deviation for Bollinger Bands, according to your trading style. Or leave all the default settings.
— Adjust the signal filters to improve the quality of the signals and avoid false alarms, adjust the filters in the "Signal Settings" section.
— Turn on alerts so that you don't miss important trading opportunities and don't constantly sit at the chart, set up alerts for buy and sell signals, as well as for divergences. This will allow you to keep abreast of all key market developments and respond to them in a timely manner, without being distracted from other business.
— Use signals. They will help you determine the optimal entry and exit points for your positions. Also, pay attention to bullish and bearish divergences, which may indicate possible market reversals and provide additional trading opportunities.
— Use the 🔌Connector🔌 for deeper analysis and verification of the effectiveness of signals, connect it to your trading strategies. This will allow you to test signals throughout the trading history and evaluate their accuracy based on historical data. Include the indicator in your trading strategy and run testing to see how buy and sell signals have worked in the past. Analyze the test results to determine how reliable the signals are and how they can improve your trading strategy. This will help you make better informed decisions and increase your trading efficiency.
