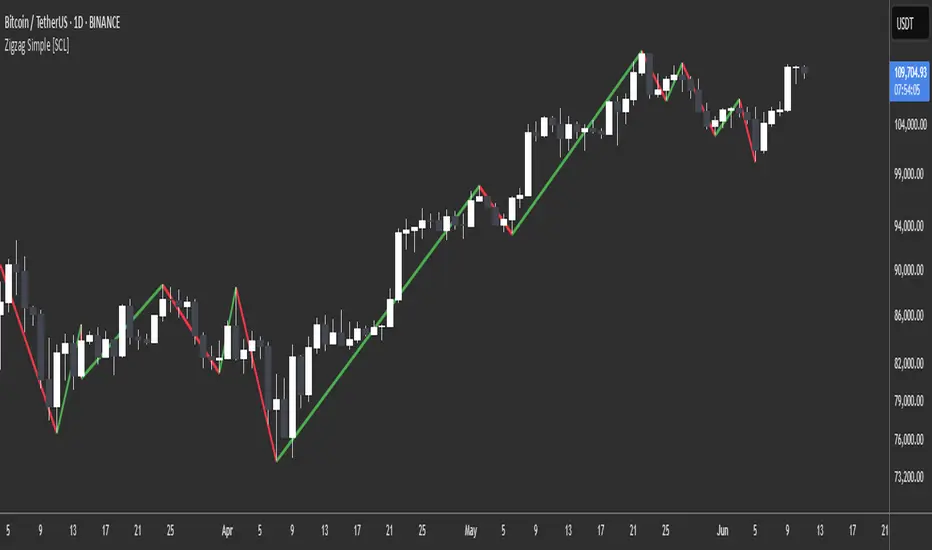
Zigzag Simple [SCL]🟩 OVERVIEW
Draws zigzag lines from pivot Highs to pivot Lows. You can choose between three different ways of calculating pivots:
• True Highs and Lows
• Williams pivots
• Oscillator pivots
🟩 HOW TO USE
This indicator can be used to understand market structure, which is arguably the primary thing you need to be aware of when trading. The zigzag by itself does not display a market structure bias, nor any information about prices of pivots, HH and HL labels, or anything like that. Nevertheless, a simple zigzag is perhaps the easiest and most intuitive way to understand what price is doing.
Choose a pivot style that you like, customise the colours and line style, and enjoy!
🟩 PIVOT TYPES EXPLAINED
True Highs and Lows
This is not an invention of mine (all credit to my humble mentor), but I haven't seen anyone else code them up. A true High is a close below the low of the candle with the highest high. A true Low is a close above the high of a candle with the lowest low. These are solid, price action-based pivots that can sometimes confirm quickly.
Williams pivots
This is how most people calculate pivots. They're simply the highest high for x bars back and x bars forwards. They're the vanilla of pivots IMO: serviceable but not very interesting. They're very convenient to code because there are built-in Pine functions for them: ta.pivothigh and ta.pivotlow . They confirm a predictable number of bars after they happen, which is great for coding but also makes the trader wait for confirmation.
Oscillator pivots
This is a completely different concept, which uses momentum in order to define pivots. For example, when you get a rise in momentum and momentum then drops a configurable amount, it confirms a pivot high, and vice versa for a pivot low. I don't know if anyone else does it –- although some indicators do mark pivots in momentum itself, and plenty do divergences, I wasn't able to find one that specifically marked *pivots in price* because of pivots in momentum 🤷♂️
Anyway, while this approach needs a whole investigation on its own, here we simply plot some pivots in a smoothed RSI. This indicator doesn't plot the actual momentum values -- for a more visual understanding of how this works, refer to the examples in the OscillatorPivots library.
🟩 UNIQUE ADVANTAGES
In contrast to other zigzag indicators available, this one lets you choose between the standard and some more unique methods of generating the zigzags. Additionally, because it's based on libraries, it is relatively easy for programmers to use as a basis for experimentation.
🟩 GEEK STUFF
Although there is considerable practical use for pivot-based zigzags in trading, this script is primarily a demonstration in coding -- specifically the power of libraries!
Most of the script consists of setup, especially defining inputs. The final section sacrifices some readability for conciseness, simply to emphasise how little code you need when the heavy lifting is done by libraries .
The actual calculations and drawing are achieved in just 8 lines.
The equivalent code in the libraries is ~250 lines long.
All libraries used are my own, public and open-source:
• MarketStructure
• DrawZigZag
• OscillatorPivots
Zigzagline
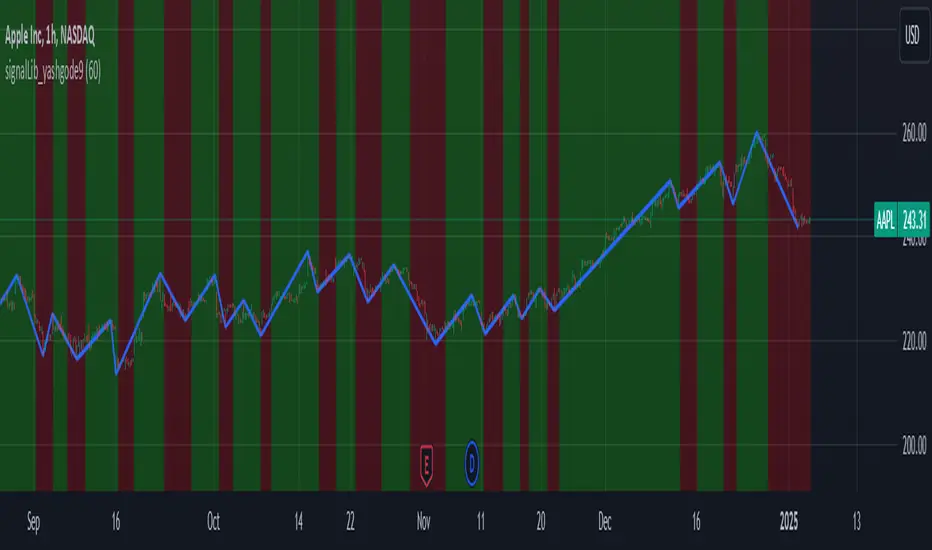
signalLib_yashgode9Signal Generation Library = "signalLib_yashgode9"
This library, named "signalLib_yashgode9", is designed to generate buy and sell signals based on the price action of a financial instrument. It utilizes various technical indicators and parameters to determine the market direction and provide actionable signals for traders.
Key Features:-
1.Trend Direction Identification: The library calculates the trend direction by comparing the number of bars since the highest and lowest prices within a specified depth. This allows the library to determine the overall market direction, whether it's bullish or bearish.
2.Dynamic Price Tracking: The library maintains two chart points, zee1 and zee2, which dynamically track the price levels based on the identified market direction. These points serve as reference levels for generating buy and sell signals.
3.Customizable Parameters: The library allows users to adjust several parameters, including the depth of the price analysis, the deviation threshold, and the number of bars to consider for the trend direction. This flexibility enables users to fine-tune the library's behavior to suit their trading strategies.
4.Visual Representation: The library provides a visual representation of the buy and sell signals by drawing a line between the zee1 and zee2 chart points. The line's color changes based on the identified market direction, with red indicating a bearish signal and green indicating a bullish signal.
Usage and Integration:
To use this library, you can call the "signalLib_yashgode9" function and pass in the necessary parameters, such as the lower and higher prices, the depth of the analysis, the deviation threshold, and the number of bars to consider for the trend direction. The function will return the direction of the market (1 for bullish, -1 for bearish), as well as the zee1 and zee2 chart points.You can then use these values to generate buy and sell signals in your trading strategy. For example, you could use the direction value to determine when to enter or exit a trade, and the zee1 and zee2 chart points to set stop-loss or take-profit levels.
Potential Use Cases:
This library can be particularly useful for traders who:
1.Trend-following Strategies: The library's ability to identify the market direction can be beneficial for traders who employ trend-following strategies, as it can help them identify the dominant trend and time their entries and exits accordingly.
2.Swing Trading: The dynamic price tracking provided by the zee1 and zee2 chart points can be useful for swing traders, who aim to capture medium-term price movements.
3.Automated Trading Systems: The library's functionality can be integrated into automated trading systems, allowing for the development of more sophisticated and rule-based trading strategies.
4.Educational Purposes: The library can also be used for educational purposes, as it provides a clear and concise way to demonstrate the application of technical analysis concepts in a trading context.
Important Notice:- This library effectively work on timeframe of 5-minute and 15-minute.
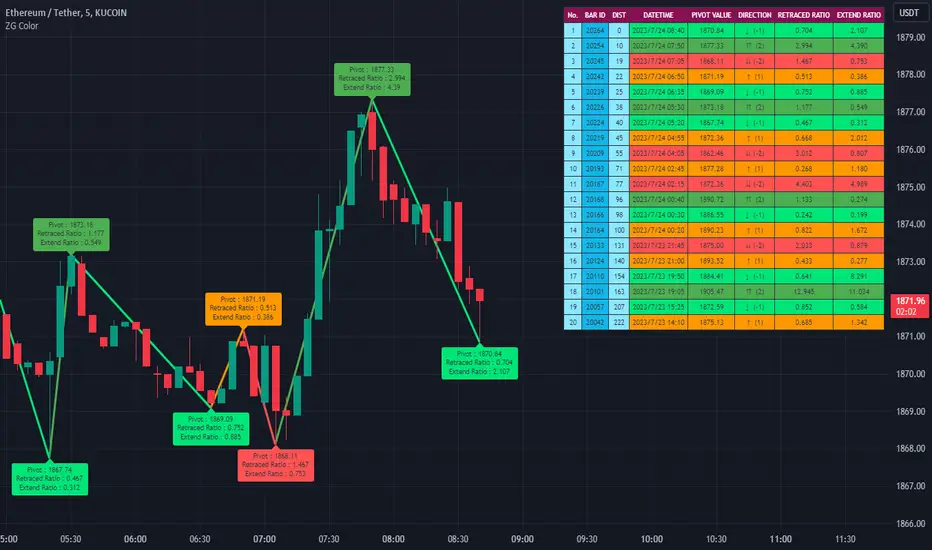
Zigzag Trend-based Color [SteinG]Zigzag Indicator with Trend-based Color Coding and Info Table
This indicator is forked from Trendoscope's Recursive Zigzag
The Zigzag Indicator with Trend-based Color Coding and Info Table is a powerful tool for technical analysis, designed to help you identify significant price swings, visualize trends, and analyze pivot points with ease. This advanced indicator offers enhanced functionalities and improved visual representation.
The primary purpose of the Zigzag Indicator is to identify and highlight important price reversals, commonly referred to as pivot points, in a given chart. These pivot points are essential in recognizing trend changes and potential market turning points. With the Zigzag Indicator, you can quickly identify these pivotal moments and gain valuable insights into market dynamics.
One of the standout features of this indicator is the color coding applied to the Zigzag line, which intuitively reflects the trend associated with each pivot point. The color scheme is as follows:
- Green : Indicates an upward trend, representing a bullish movement in the price.
- Lime : Represents a retracement during an upward trend, indicating a temporary pullback before the uptrend resumes.
- Red : Signifies a downward trend, indicating a bearish movement in the price.
- Orange : Represents a retracement during a downward trend, indicating a temporary bounce before the downtrend resumes.
This color coding allows you to easily visualize the prevailing market sentiment and make more informed trading decisions accordingly.
In addition to the visual representation, the Zigzag Indicator also includes an informative table that provides essential details about each pivot point. The table presents the following information for each pivot point:
1. Pivot Value : The price level at which the pivot point occurs.
2. Direction : Indicates whether the pivot point represents an upward or downward trend.
3. Fibo Ratios : Displays the Fibonacci retracement levels between two consecutive pivot points, offering insights into potential support and resistance levels.
The inclusion of this comprehensive info table enables you to analyze pivot points more effectively, understand the underlying price dynamics, and identify key trading opportunities.