Custom chart intervals — personalizing your analysis
To make your analysis your own, you can customize intervals. By using different chart types available on TradingView, see time and price actions in the way you need them and explore deeper using our Supercharts.
CONTENTS:
- What are intervals and custom intervals
- How to customize time interval
- How to customize price interval
- Renko, Kagi, and P&F charts price interval customization
- Range and Line break charts price interval customization
What are intervals and custom intervals
Intervals define how data is grouped and shown on your charts. There's two types of them:
- Time-based intervals: Group price data into equal time segments. For example, 1 minute, 5 minutes, or 1 day, etc. Take a daily candle chart, where each candle represents one trading day. The duration is fixed, but the price range can vary significantly

- Price-based intervals: Group data based on price movement, instead of time. They’re used in alternative chart types such as Renko, Kagi, Point & Figure, Line Break, and Range charts. This gives traders a way to filter out noise and highlight price trends or reversals

Personalization is what makes technical analysis customizable to fit everyone’s needs with its various chart types, drawing tools, and indicators. But time is not that easily configured, as we have only one data input — time itself — and it’s consistently measured in seconds, minutes, hours, etc.
That said, changing the standard time intervals may give you another angle of perspective on your chart, and may work much better with your trading strategy.
! Tip: You can customize Supercharts to display non-standard intervals. For instance, instead of a 2-hour interval, you can set the interval to 2.5-hour interval.
Also, there are price-based chart types, which don't use time as an input, but only price movements.
How to customize time interval
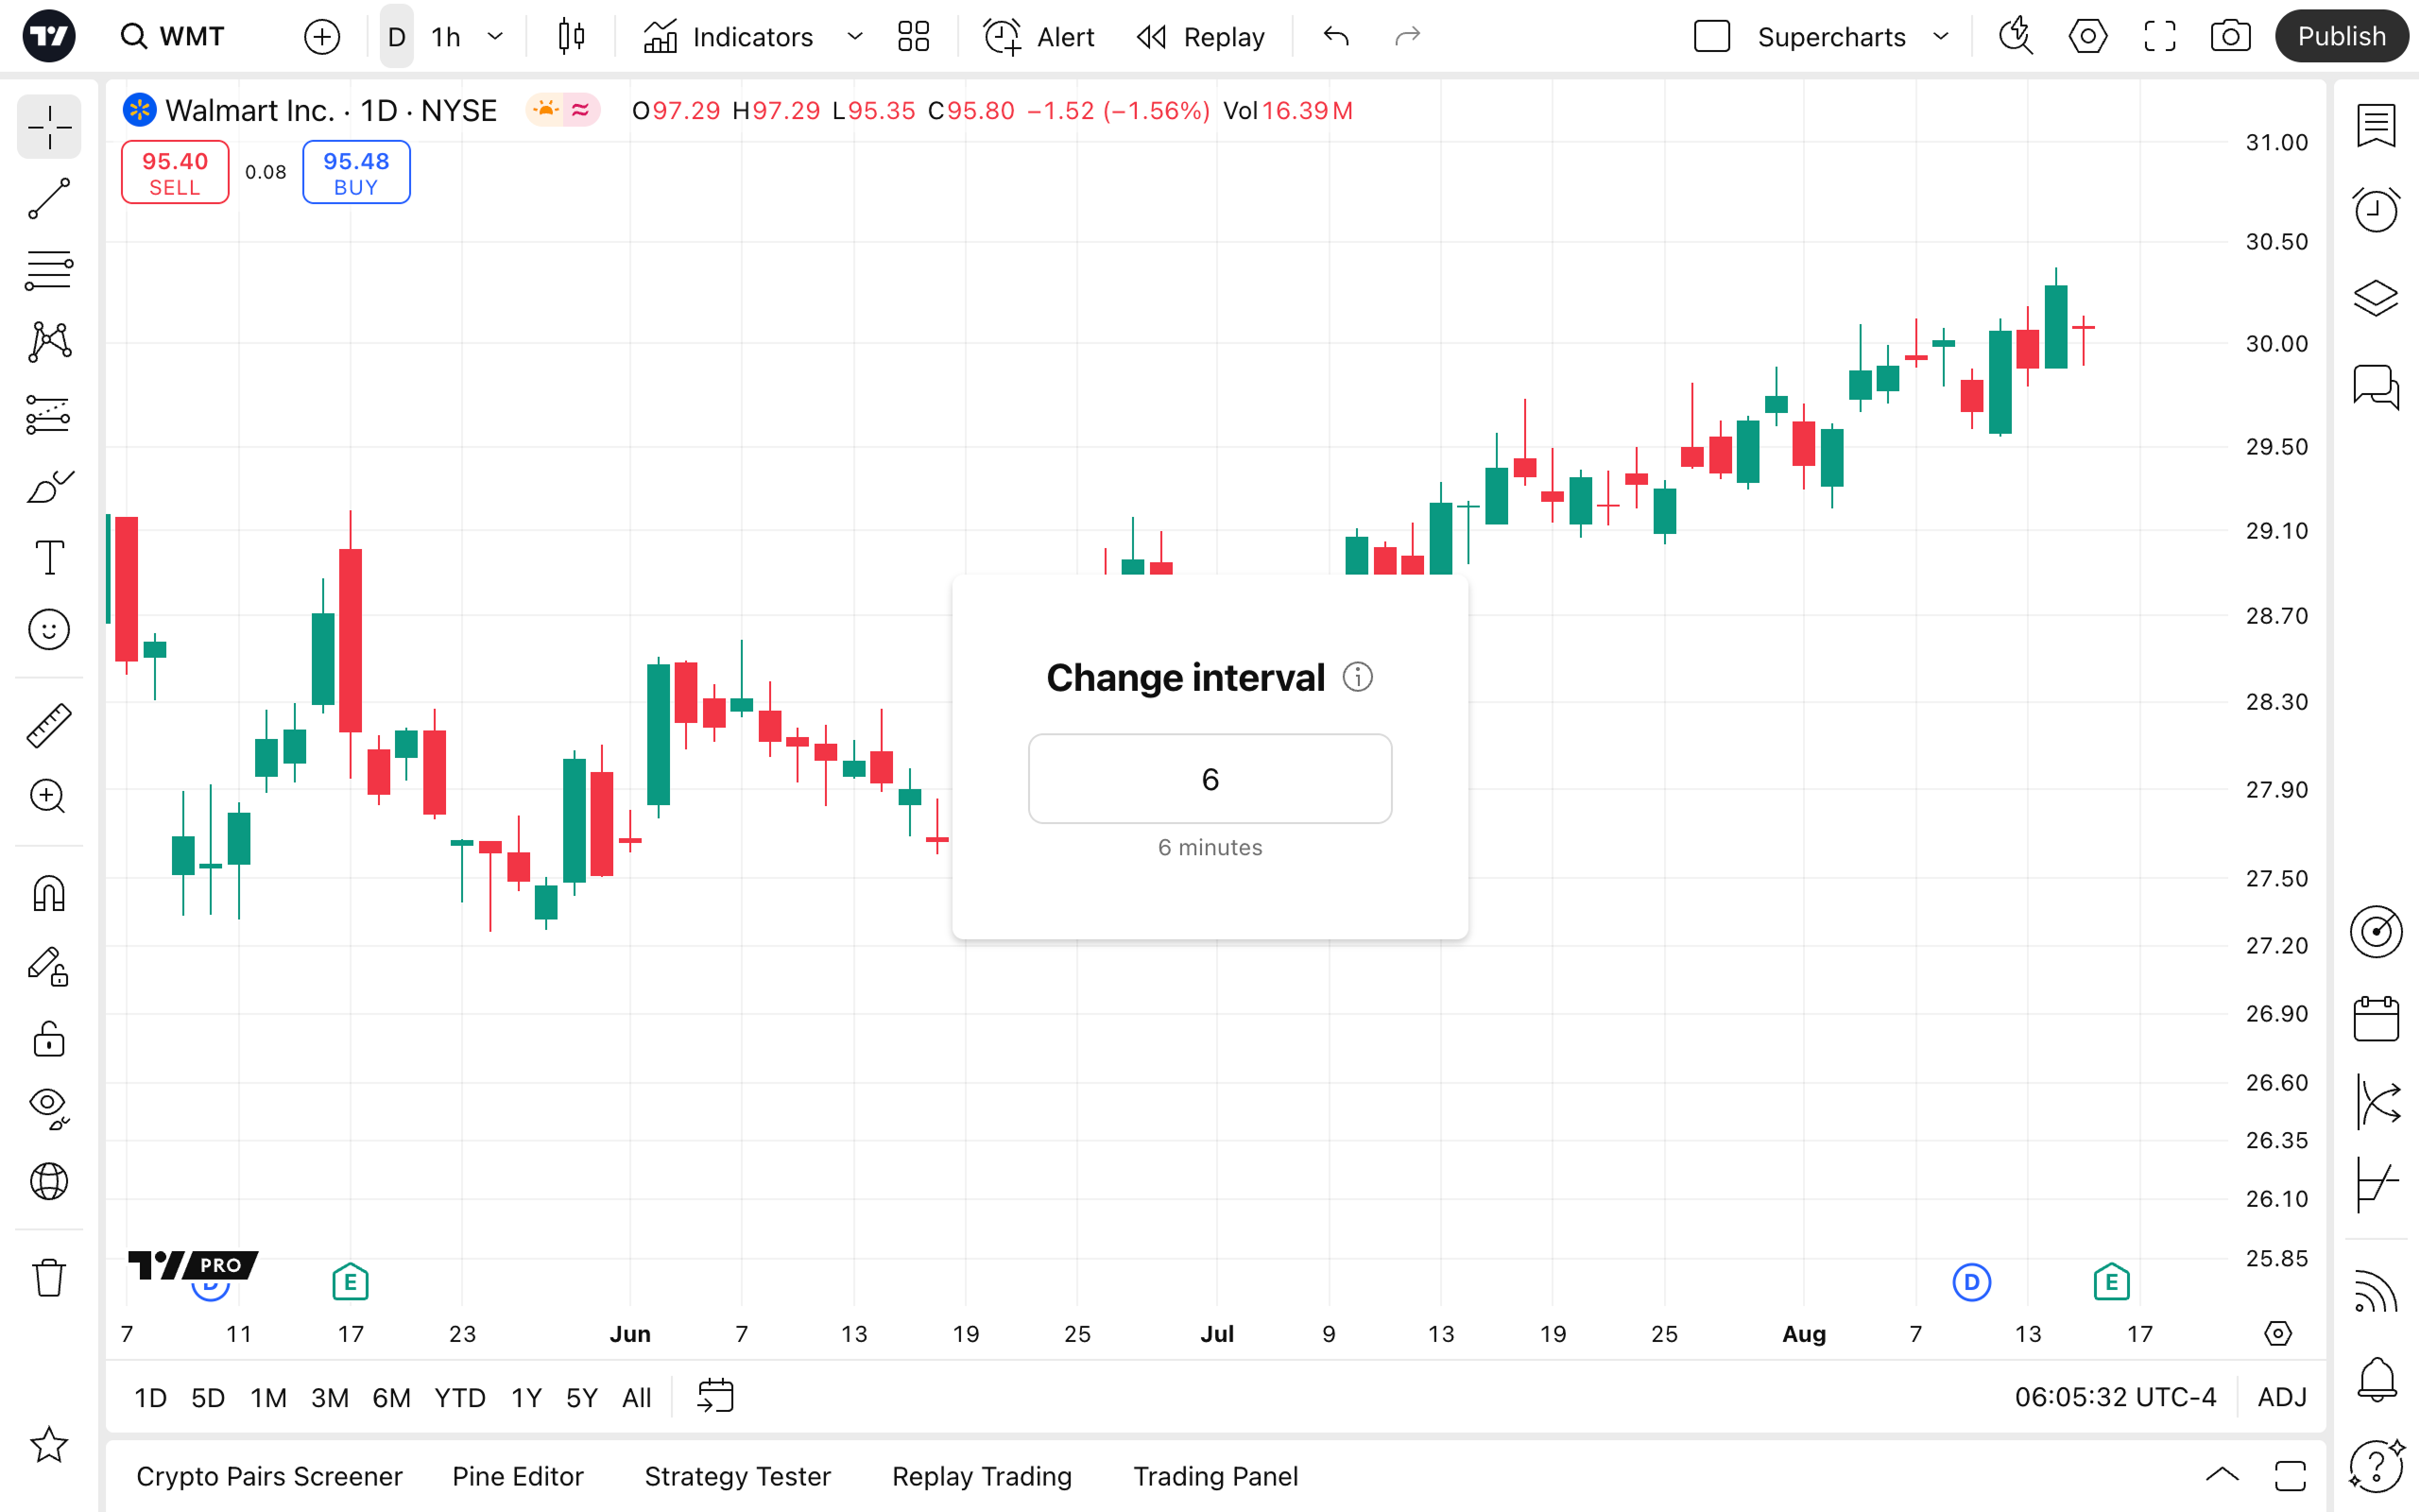
For time-based charts (e.g., line, candles, SVP, etc.), you can set your custom time interval by clicking on the "+ Add custom interval…" button in the dropdown menu.

Another way you can set your custom interval is by simply typing numbers, which will represent minutes.
How to customize price interval
These chart types use price changes as the basis for chart elements to be displayed.
On TradingView, you can access the following price-based chart types:
Renko, Kagi, and P&F charts price interval customization
Each of these charts uses a different visualization method, but the inputs they use for their calculations remain the same across all three. You can choose any of the following:
- Average True Range (ATR): Uses the values generated by the Average True Range (ATR) indicator.
- Traditional: Uses a user-defined absolute value for line size. New lines are only created when price movement is at least as large as the pre-determined line size.
- Percentage LTP: The line size is based on the percentage defined by the user. This percentage is applied to the most recent closing price to calculate the line size, and then rounded to the nearest minimum tick size and applied consistently across all bars.
Range and Line break charts price interval customization
These charts' price intervals are configured differently.
Range bars use minimum price changes to draw new bars. In the dropdown "Time interval" menu you can find the pre-configured ranges:
- 1 range
- 10 ranges
- 100 ranges
- 1000 ranges
Line break charts use previous lines' highs and lows to determine whether a new line is going to be green (rising) or red (falling).
For this chart type, you can define the number of lines the system will consider while drawing new lines. This number of lines is the Line break chart's interval.
The bottom line
Personalization is what makes charting suitable for many traders, each utilizing individual strategies and aiming to achieve different goals within different time horizons.
We support your uniqueness and creativity in analytics — view the markets as you need them to appear and get the most out of the tradingverse with TradingView.
Also read: