Auto Fib Retracement
What is the Fibonacci Retracement indicator
Auto fib retracement was developed for technical analysis and is mainly used to better understand and define support and resistance levels in the market. It is named after its use of the Fibonacci sequence and is based on the theory that markets will retrace a specific portion of a move before continuing moving in the original direction.
Fibonacci retracements are a popular instrument used by technical analysts to determine support and resistance areas. In technical analysis, this tool is created by taking two extreme points (usually a peak and a trough) on the chart and dividing the vertical distance by the key Fibonacci ratios: 23.6%, 38.2%, 50%, 61.8%, and 100%.
Once these levels are defined, horizontal lines are drawn and used to determine possible support and resistance levels.
When using the Auto Fibonacci Retracement (Auto Fib) indicator, there is no need to explicitly set two points, as is done when using the Fib Retracement drawing tool. The indicator does everything for you.
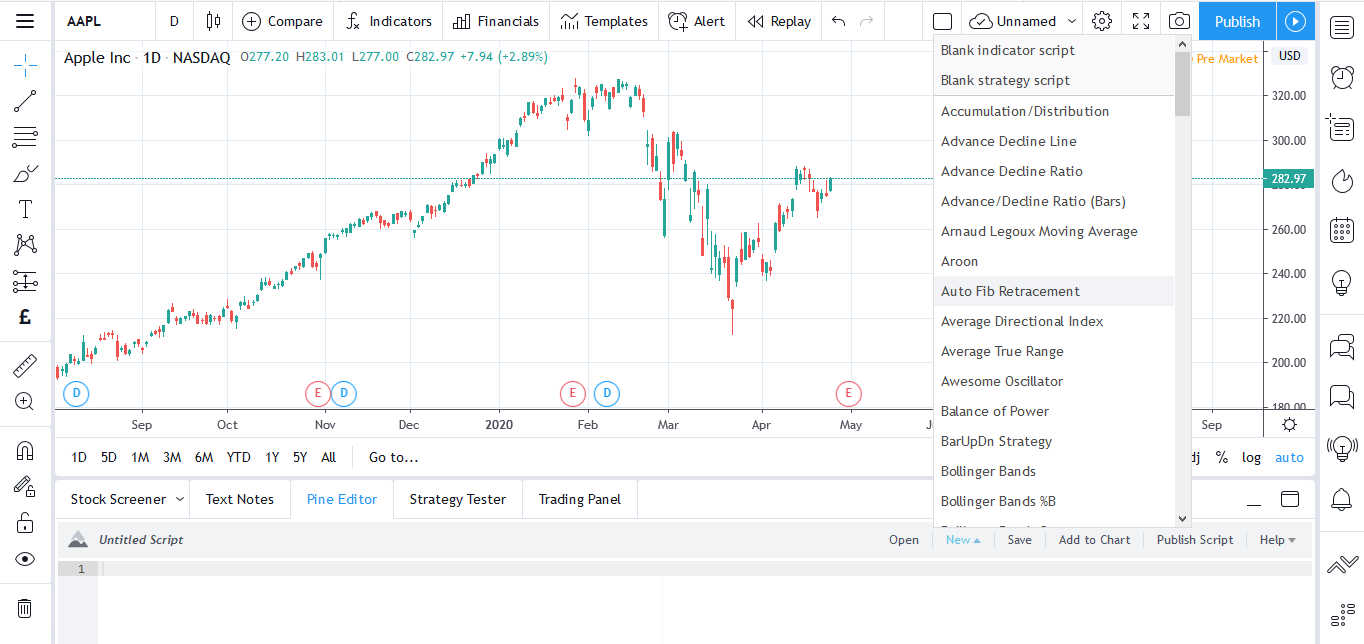
To use this tool, open the "Indicators, metrics, and strategies" menu at the upper toolbar on your chart and find Auto Fib Retracement in the "Technicals" tab or simply start typing its name in the "Search" field.

You can also find it in Pine Editor via the new tab — Auto Fib Retracements.
Inputs
Deviation: A multiplier that affects how much the price should deviate from the previous pivot for the bar to become a new pivot
Depth: Affects the minimum number of bars that will be taken into account when building
Extend lines: Extends lines to the left or right on the chart
Reverse: Reverse the order of lines
Prices: Displays all prices
Levels: Displays all levels
Levels format: The format for displaying levels. It can incorporate values and percentages

Auto Fib Retracement in a nutshell
Many traders and investors value this tool and use Fibonacci ratios and retracements to place trades within long-term price trends. It can be even more beneficial when used with other tools and indicators, so go ahead and find the best configuration for your analysis.
Also read: